4070
Combined Effect of Iron Overload and Steatosis on Liver R2* Using Morphological Modeling and MRI Signal Synthesis via Monte Carlo Simulations1Biomedical Engineering, The University of Memphis, Memphis, TN, United States, 2Department of Medicine, North Shore University Hospital/Northwell Health, Manhasset, NY, United States, 3College of Medicine, University of Tennessee Health Science Center, Memphis, TN, United States, 4St. Jude Children’s Research Hospital, Memphis, TN, United States
Synopsis
Chemical-shift based multi-spectral fat-water models accounting for single or dual R2* correction are used to assess hepatic iron concentration (HIC) and fat fraction (FF). In this study, we developed a Monte-Carlo based approach for simulating steatosis and iron overload models mimicking the in-vivo characteristics and synthesizing MRI signal to compare the accuracy of the R2* models to estimate FF in the presence of iron. Our results show that R2* estimated by single R2* model is highly governed by iron whereas dual R2* model predicts R2*-FF relationship close to the in-vivo calibration. Nevertheless, FF predicted by both the models were close to the true FF.
Introduction
Chemical shift based multi-spectral fat-water MRI signal models with single or dual R2*(1/T2*) correction have been proposed for simultaneous assessment of hepatic iron content (HIC) and steatosis1,2. For simplicity, most multi-spectral models that incorporate the R2* correction assume that the R2* for water (R2*W) and fat (R2*F) are the same (single R2*). However, this assumption may not hold true in co-existing conditions of iron overload and steatosis as iron could affect the MRI signal of water and fat molecules differently due to their difference in molecular sizes3. The objective of this study is to compare the accuracy of R2* and FF estimation of single and dual R2* models in the presence of both iron and fat by building combined liver iron overload and steatosis models using morphological descriptors from histology4,5 and synthesizing MRI signal using Monte-Carlo simulations.Methods
Fat droplets (FDs) were segmented from 68 human liver histology samples. Morphometric (radius, circularity) and space organizational (NN distance and regional anisotropy) characteristics of FDs were extracted from the segmented images and were statistically modeled using gamma distribution function (GDF). Relationships between the extracted features and GDF parameters were computed using regression analysis. Similar relationships were obtained for iron from a study conducted by Ghugre et al4. Virtual liver volume with dimension 120X120X120 µm3 was simulated with different FFs and HICs based on those relationships.MRI signal was generated using the Monte-Carlo approach described in previous studies4,5, by accounting for both iron-induced and fat-induced susceptibilities. The MRI signals from water and fat were computed and superimposed to obtain the final combined MRI signal. The signals were synthesized for FFs ranging from 0-50% and HIC = [0.4, 0.6, 0.8, 1, 5] mg of iron/g of dry tissue weight with echo times (TE): 1, 1.5, 2, …, 14.5ms at 1.5T.
R2* and FF were calculated using fat water toolbox1 (FWT) (single R2*) and auto regressive moving average2 (ARMA) (dual R2*) models. R2*-FF as well as R2*-HIC relationship were compared with their corresponding in-vivo calibration and the relationship between R2*, FF and HIC was computed using multi-regression analysis.
Results & Discussion
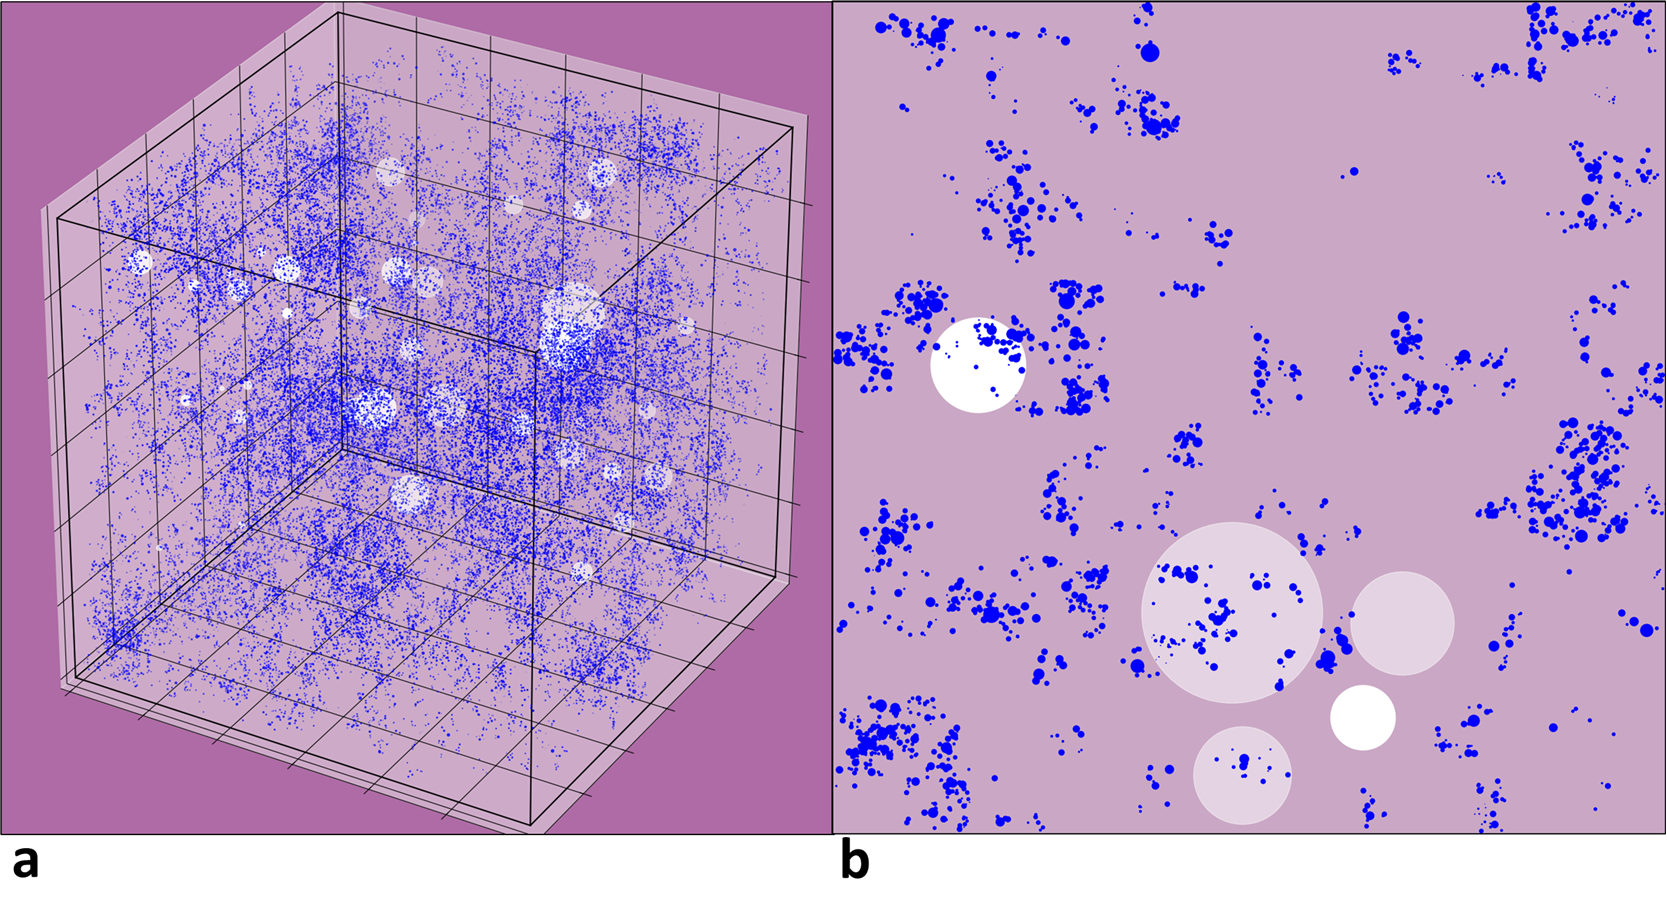
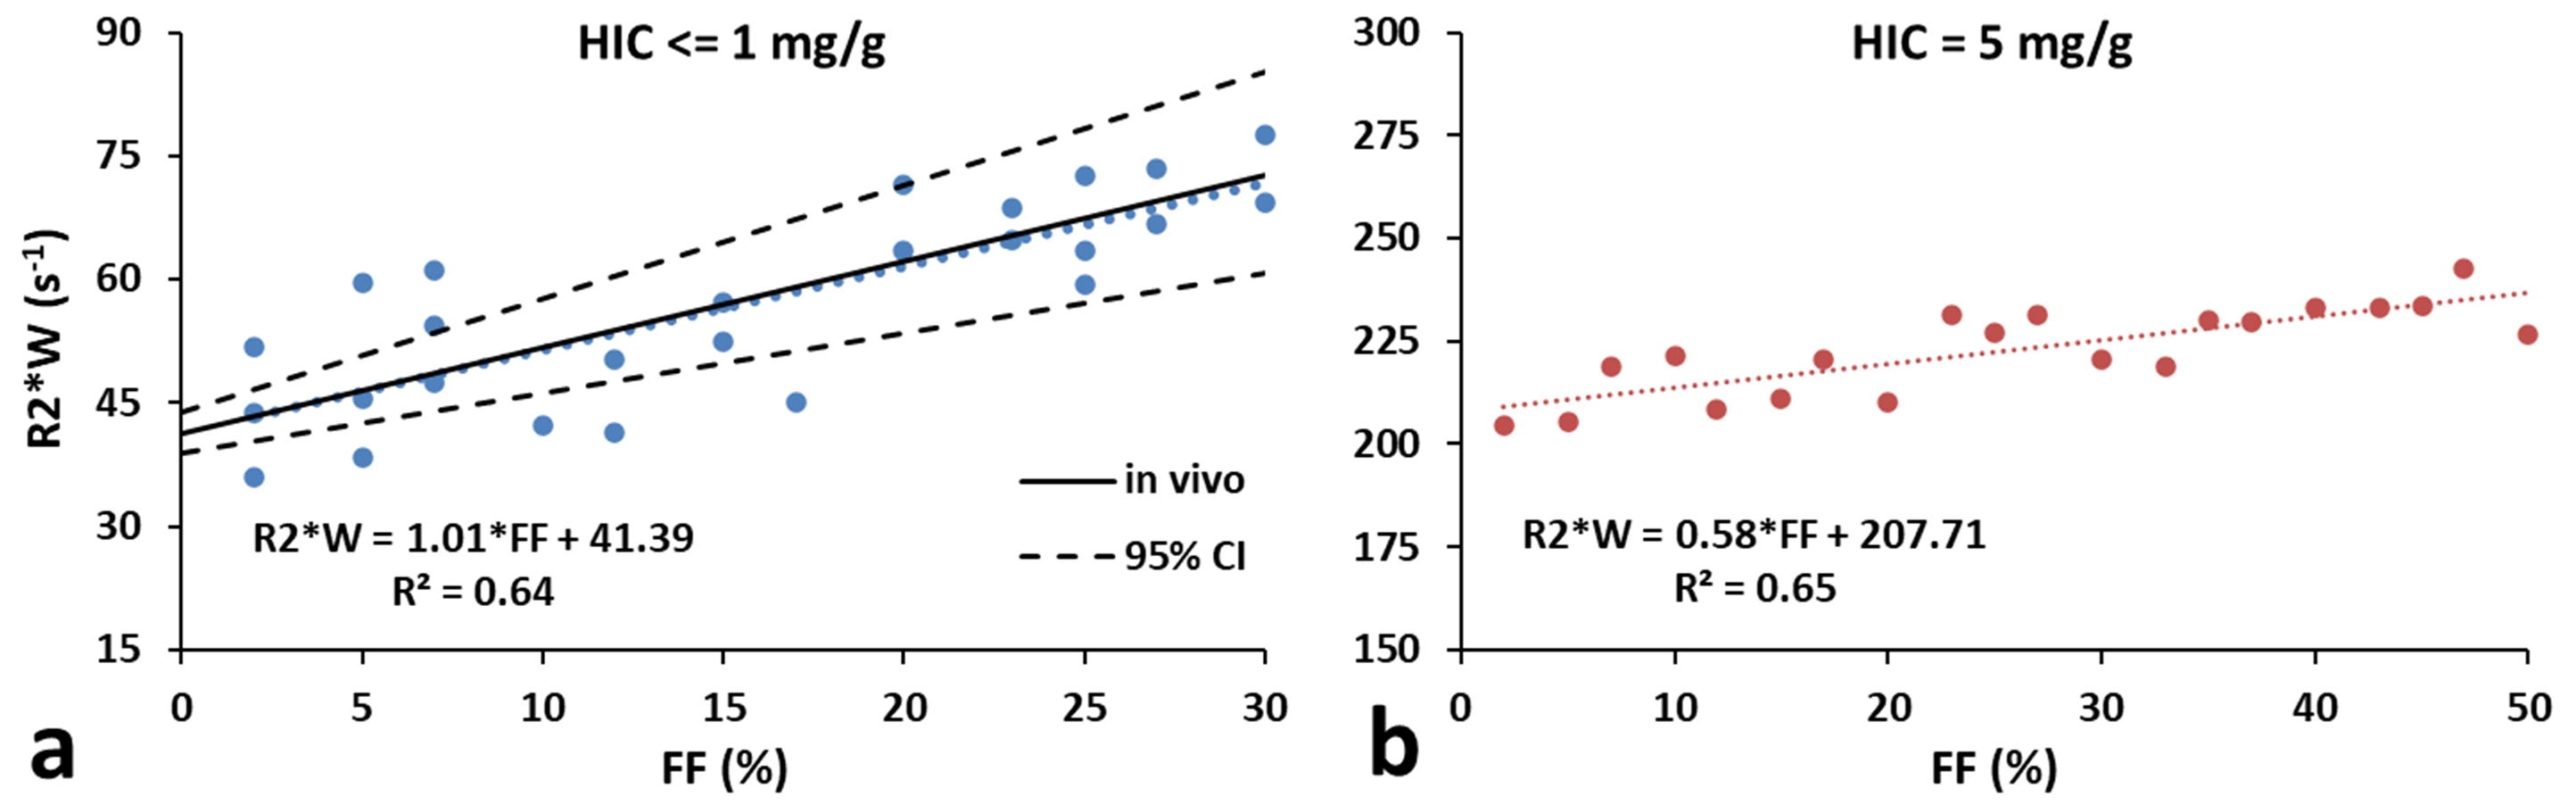
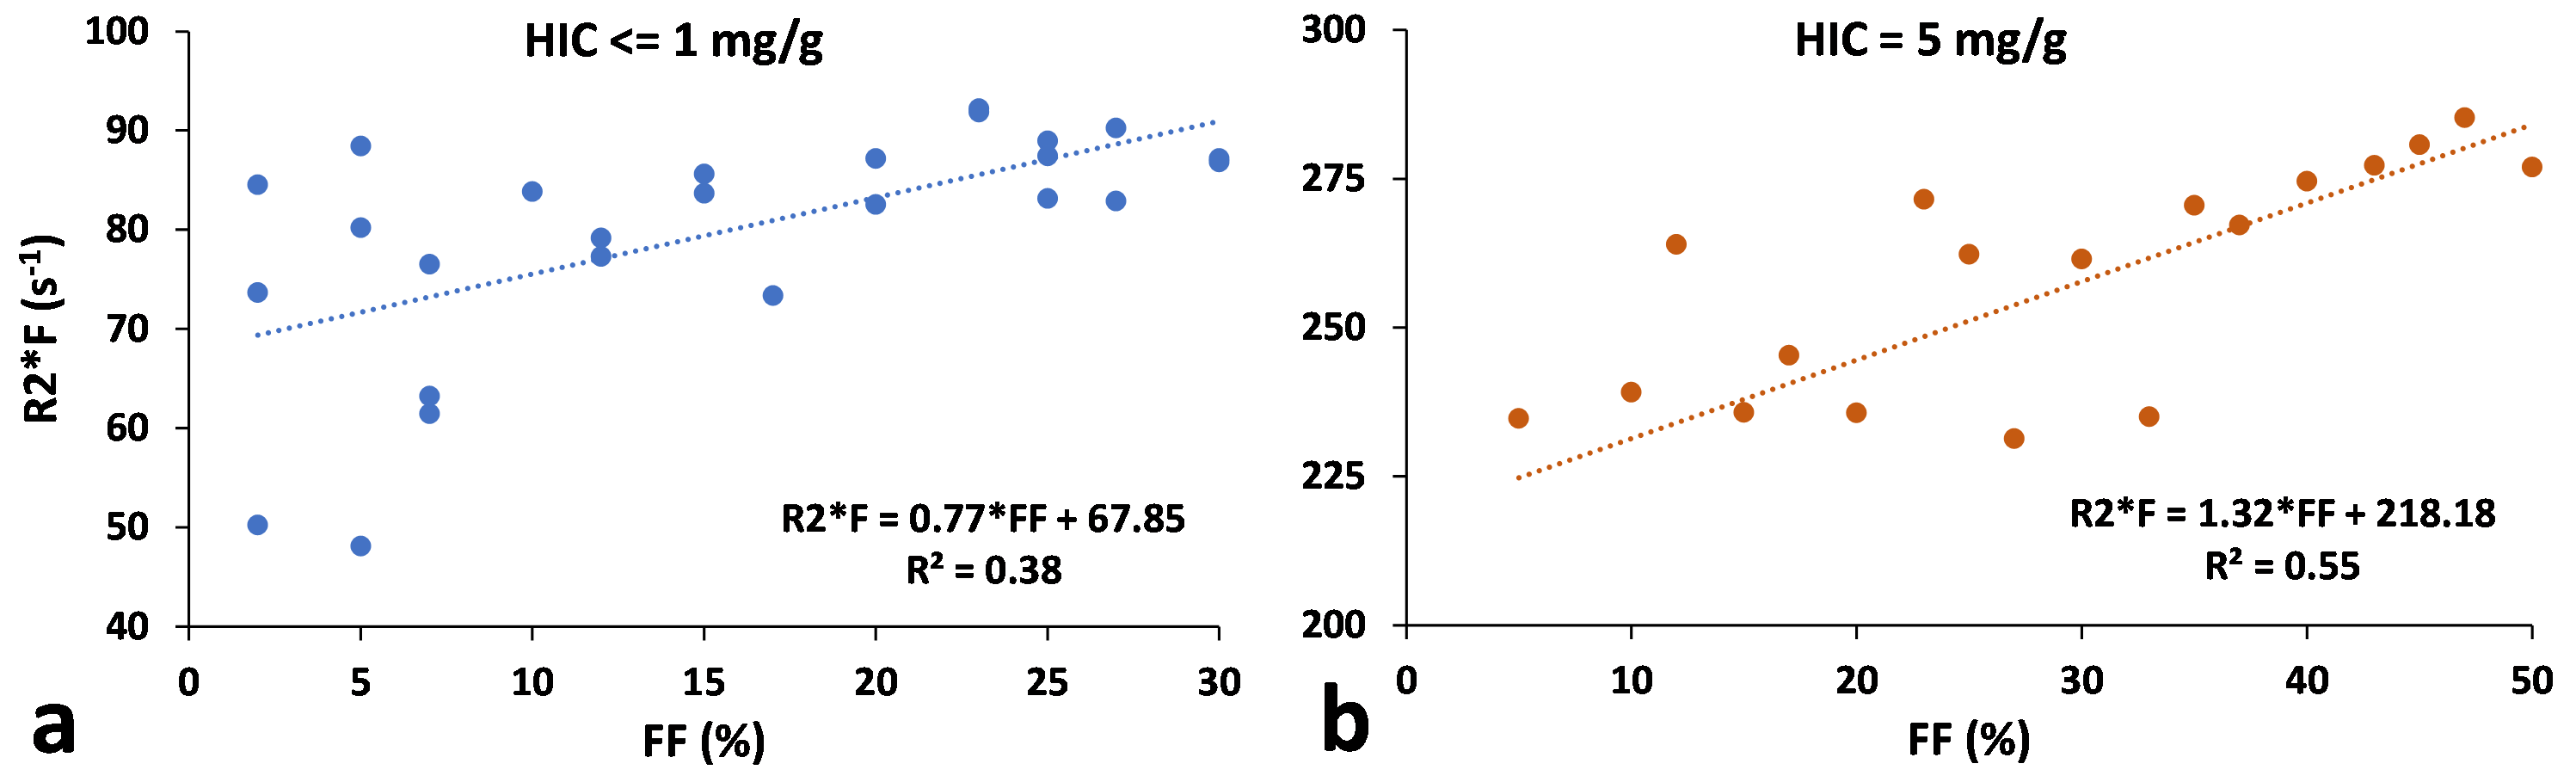
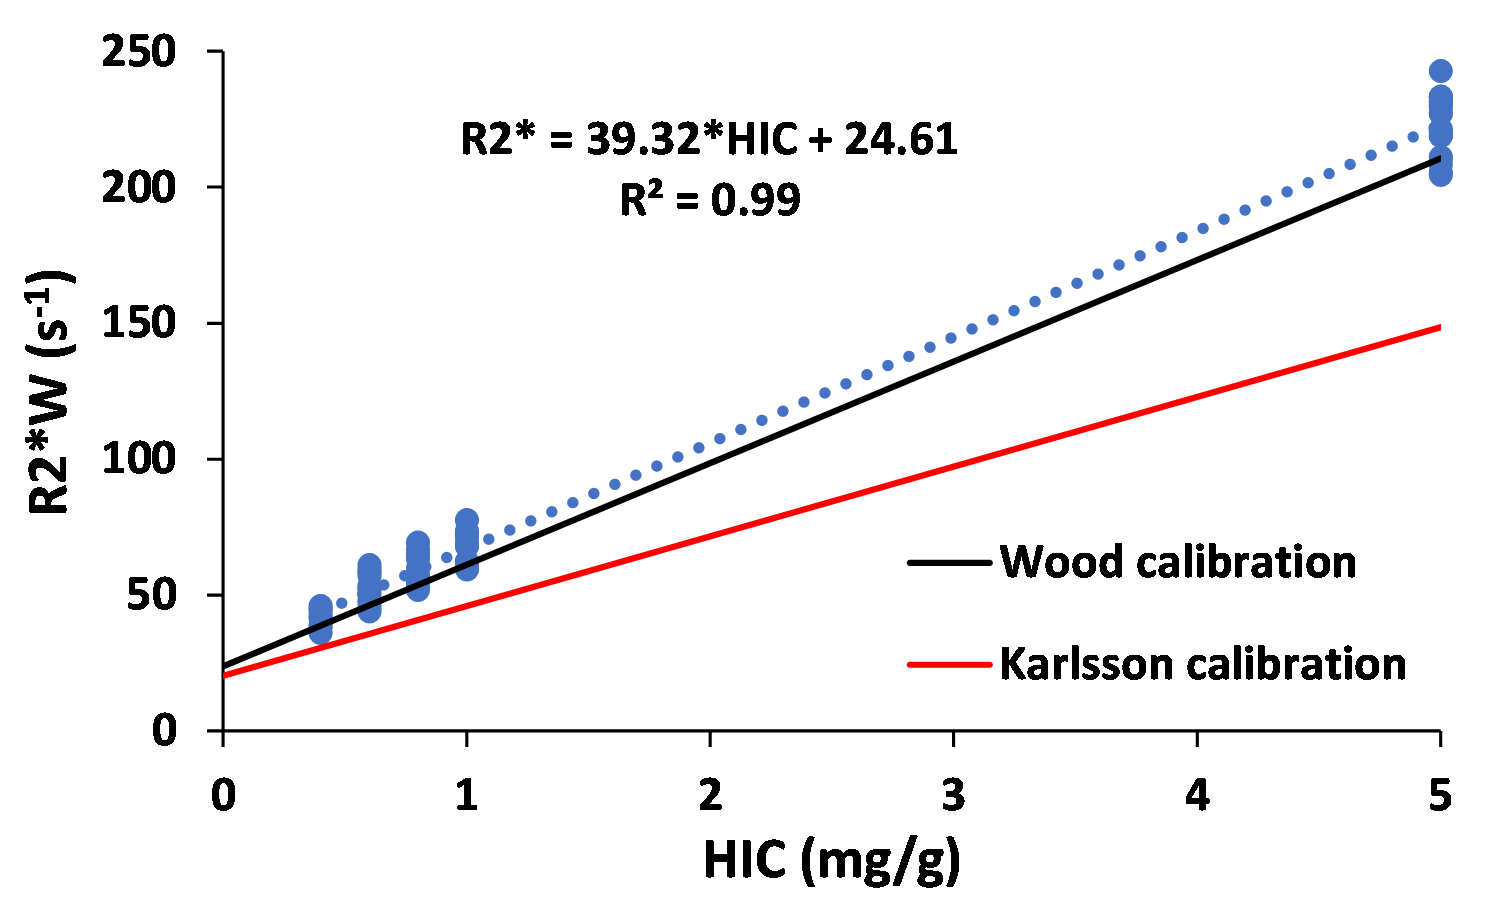
Figure 1 shows (a) 3D and (b) its corresponding 2D slice of a representative virtual liver model with FF of 10% and HIC of 5mg/g which mimics steatosis and iron overload with in-vivo sizes and organization of iron spheres and FDs. R2* predicted by FWT was 60s-1 and 240s-1 for HIC<=1mg/g and HIC=5mg/g respectively for all FFs simulated. However, R2*W predicted by ARMA changed with FF for the simulated HICs. Hence, rest of the R2* results are based on R2*W predicted by ARMA. As shown in Figure 2(a), predicted R2*W values showed positive correlation with FFs, with slopes similar to the Karlsson calibration for HIC < 1.2mg/g6. Figure 2(b) shows decrease in the slope of R2*W-FF relationship at HIC of 5mg/g suggesting that at higher HIC most of the signal is dominated by iron. R2*F predicted by the ARMA model shows weak-moderate correlation with FF (R2 < 0.6) as demonstrated in Figure 3. Figure 4 compares the estimated R2*W-HIC relationship with the Wood7 and Karlsson calibration6. The estimated relationship was closer to the Wood calibration. The predicted relationship between R2*, FF and HIC for this study is:$$R_2^*=37.43*HIC+0.60*FF+20.13$$
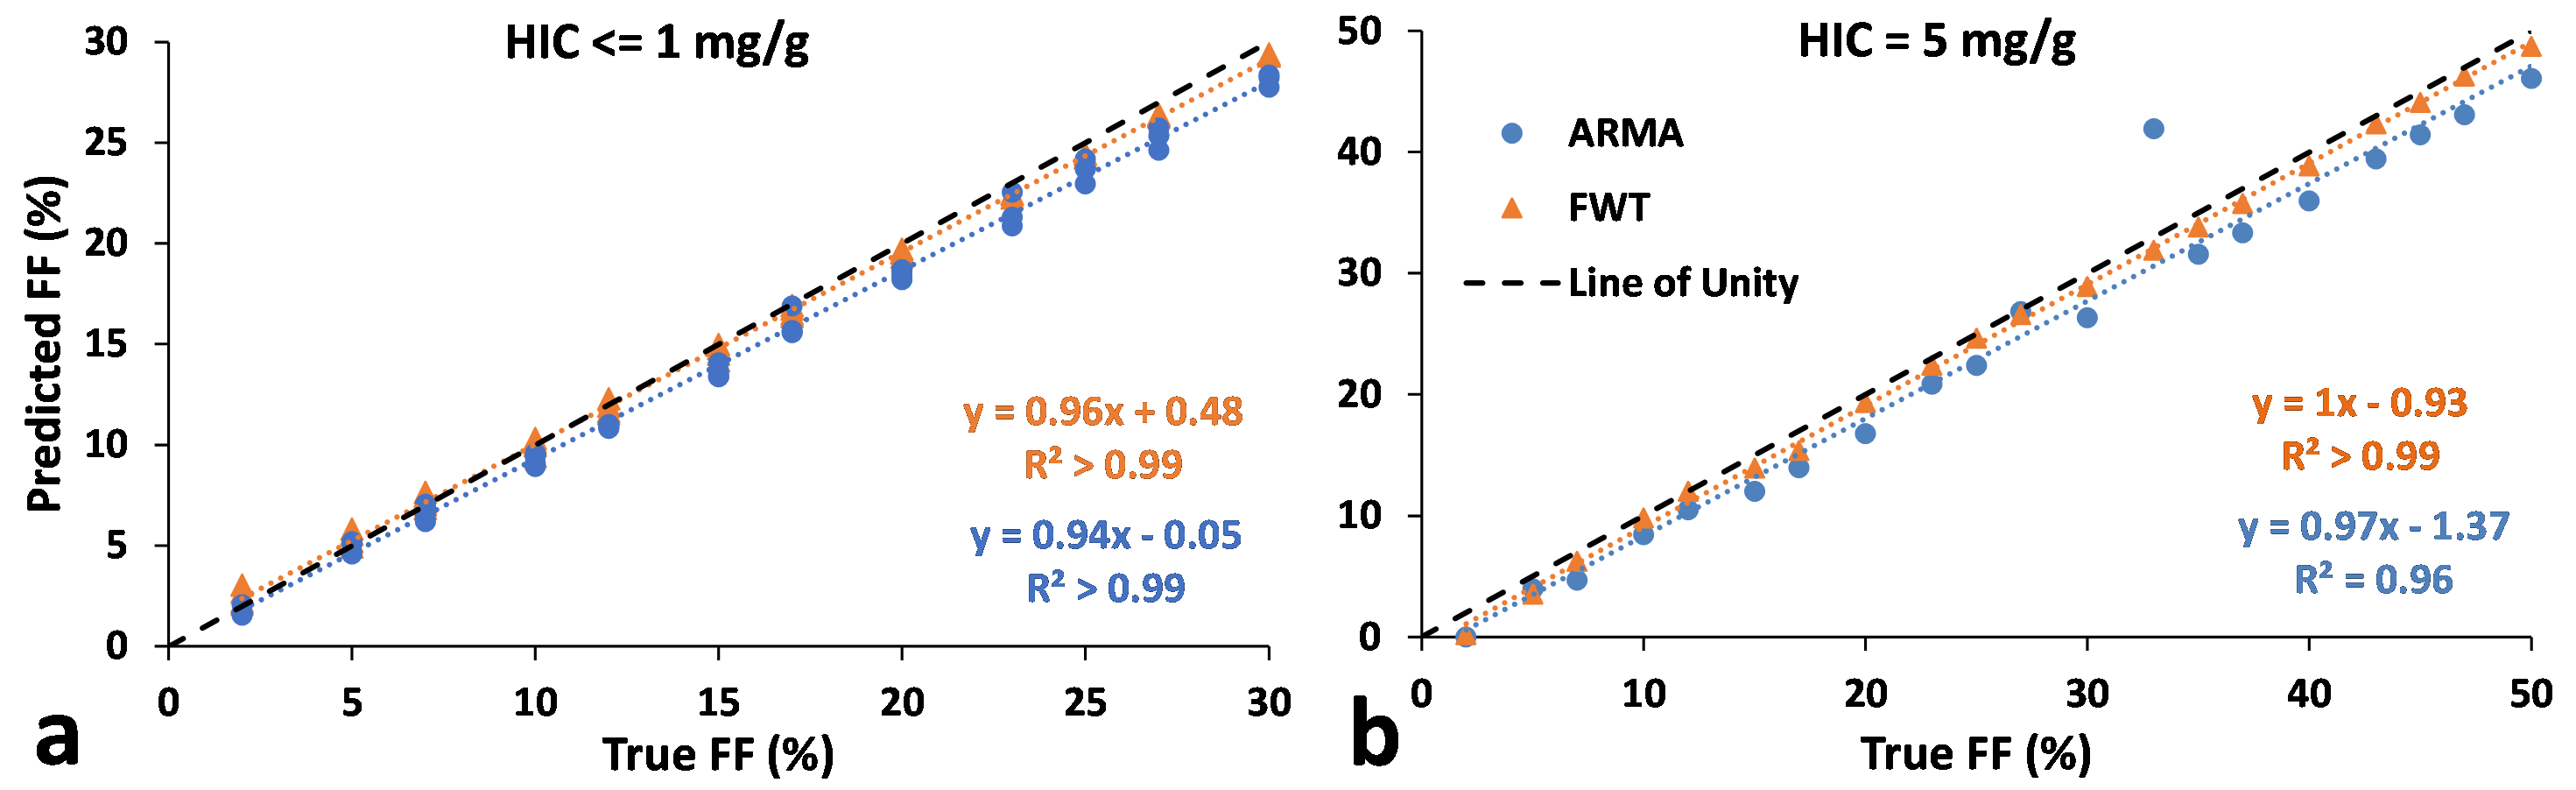
The predicted FF values were in excellent agreement with true FFs, with slopes ~1 for both ARMA and FWT (Figure 5).
Hence, our simulations performed by creating iron overload and steatosis models and synthesizing MRI signal demonstrate that FWT single R2* has less sensitivity to the presence of FDs and its R2* estimation is dominated by iron particles whereas ARMA dual R2* estimation shows a positive correlation with FF. Even though the R2* predicted by FWT did not change with FF, it was able to predict FF with high accuracy which might be because fat accumulation in liver causes only a slight increase in liver R2*8. For higher HICs, iron signal will be much greater than the fat signal which can cause FWT to predict FF incorrectly. Moreover, this work demonstrates the feasibility of performing Monte-Carlo modeling to study the association between R2*, FF and HIC and determine the optimal R2* fat-water model for in-vivo studies.
Conclusion
This study shows that under the condition of steatosis and iron overload, the R2* predicted by single R2* model is dominated by iron signal whereas dual R2* can predict R2* values based on FF, which are close to the published in-vivo calibrations. Future work will perform a systematic investigation to study the association between R2*, HIC and FF for a wide range of HICs and FFs.Acknowledgements
We acknowledge the support of National Institute of Health (NIH), #1R21EB031298.References
1. Hamilton G, Yokoo T, Bydder M, et al. In vivo characterization of the liver fat 1H MR spectrum. NMR Biomed. 2011;24(7):784-790.
2. Tipirneni-Sajja A, Krafft AJ, Loeffler RB, et al. Autoregressive moving average modeling for hepatic iron quantification in the presence of fat. J Magn Reson Imaging. 2019;50(5):1620-1632.
3. Horng DE, Hernando D, Reeder SB. Quantitation of liver fat in the presence of iron overload. J Magn Reson Imaging. 2017;45(2):428-439.
4. Ghugre NR, & Wood JC. Relaxivity‐iron calibration in hepatic iron overload: probing underlying biophysical mechanisms using a Monte Carlo model. Magn Reson Med. 2011;65(3): 837-847.
5. Shrestha U, van der Merwe M, Kumar N, et al. Morphological characterization of hepatic steatosis and Monte Carlo modeling of MRI signal for accurate quantification of fat fraction and relaxivity. NMR Biomed. 2021;34(6):e4489.
6. Karlsson M, Ekstedt M, Dahlström N, et al. Liver R2* is affected by both iron and fat: A dual biopsy‐validated study of chronic liver disease. J Magn Reson Imaging. 2019;50(1):325-33
7. Wood JC, Enriquez C, Ghugre N, et al. MRI R2 and R2* mapping accurately estimates hepatic iron concentration in transfusion-dependent thalassemia and sickle cell disease patients. Blood. 2005;106(4):1460-5.
8. Mamidipalli A, Hamilton G, Manning P, et al. Cross-sectional correlation between hepatic R2* and proton density fat fraction (PDFF) in children with hepatic steatosis. J Magn Reson Imaging. 2017;47:418–424.
Figures