4065
Simultaneous acquisition of water-fat concentrations and velocity images using a Phase-contrast T2*-IDEAL method1Biomedical Imaging Center, Pontificia Universidad Católica de Chile, Santiago de Chile, Chile, 2Department of Electrical Engineering, School of Engineering, Pontificia Universidad Católica de Chile, Santiago de Chile, Chile, 3ANID – Millennium Science Initiative Program – Millennium Nucleus for Cardiovascular Magnetic Resonance, Santiago de Chile, Chile, 4Department of Radiology, School of Medicine, Pontificia Universidad Católica de Chile, Santiago de Chile, Chile
Synopsis
Phase-contrast in areas with a significant fat signal is subject to chemical shift artifacts where the fat signal interferes with the neighboring water signal. The purpose of this work is to present a novel method that combines phase-contrast with T2*-IDEAL water-fat separation to obtain water-fat concentrations and velocity images from a single acquisition. We validate our method using a numerical phantom with different combinations of water-fat concentrations, velocity, and noise, and MRI of a 2D axial section of the neck acquired in volunteers. PDFF comparisons showed a significant agreement between phase-contrast T2*-IDEAL and standard methods.
Introduction
Phase-contrast (PC) can provide quantitative flow and anatomic information1,2. In areas with a significant fat signal, the use of PC can be challenging. Chemical shift artifacts can cause the fat signal to interfere with the neighboring water signal, reducing the accuracy of velocity measurements3.Chemical shift imaging techniques are widely used for water-fat separation and fat suppression1–8. These techniques acquire images at multiple TEs to separate chemical species through a model fitting process. Although Dixon model1,4,5 is the simplest method for separating images of water and fat, in cases of non-idealities or because of T2* signal decay, it tends to fail. T2*-IDEAL8 allows for a more accurate water and fat quantification, with very flexible TEs choice.
Water-fat separation techniques can also be used in conjunction with PC velocimetry7. Recently, Johnson et al9, propose a joint formulation to solve the water-fat, and PC problem using a combination of chemical shift imaging with PC velocimetry with nonlinear least-squares estimation of velocity, fat, and water signals. An issue of this approach is that it uses a single peak model for the chemical shift of fat and it did not consider the T2* decay.
In this work we present a novel method that combines PC with the water-fat separation method T2*-IDEAL8 separation to obtain water-fat concentrations and velocity images from a single acquisition. Since both effects can be encoded by the MR signal phase, we can achieve that by combining bipolar gradients with multi-echo readouts. We proposed a three chemical species model (water with positive and negative bipolar gradients and fat) that allows for accurately recovering water and fat concentrations, and the velocity information.
Methods
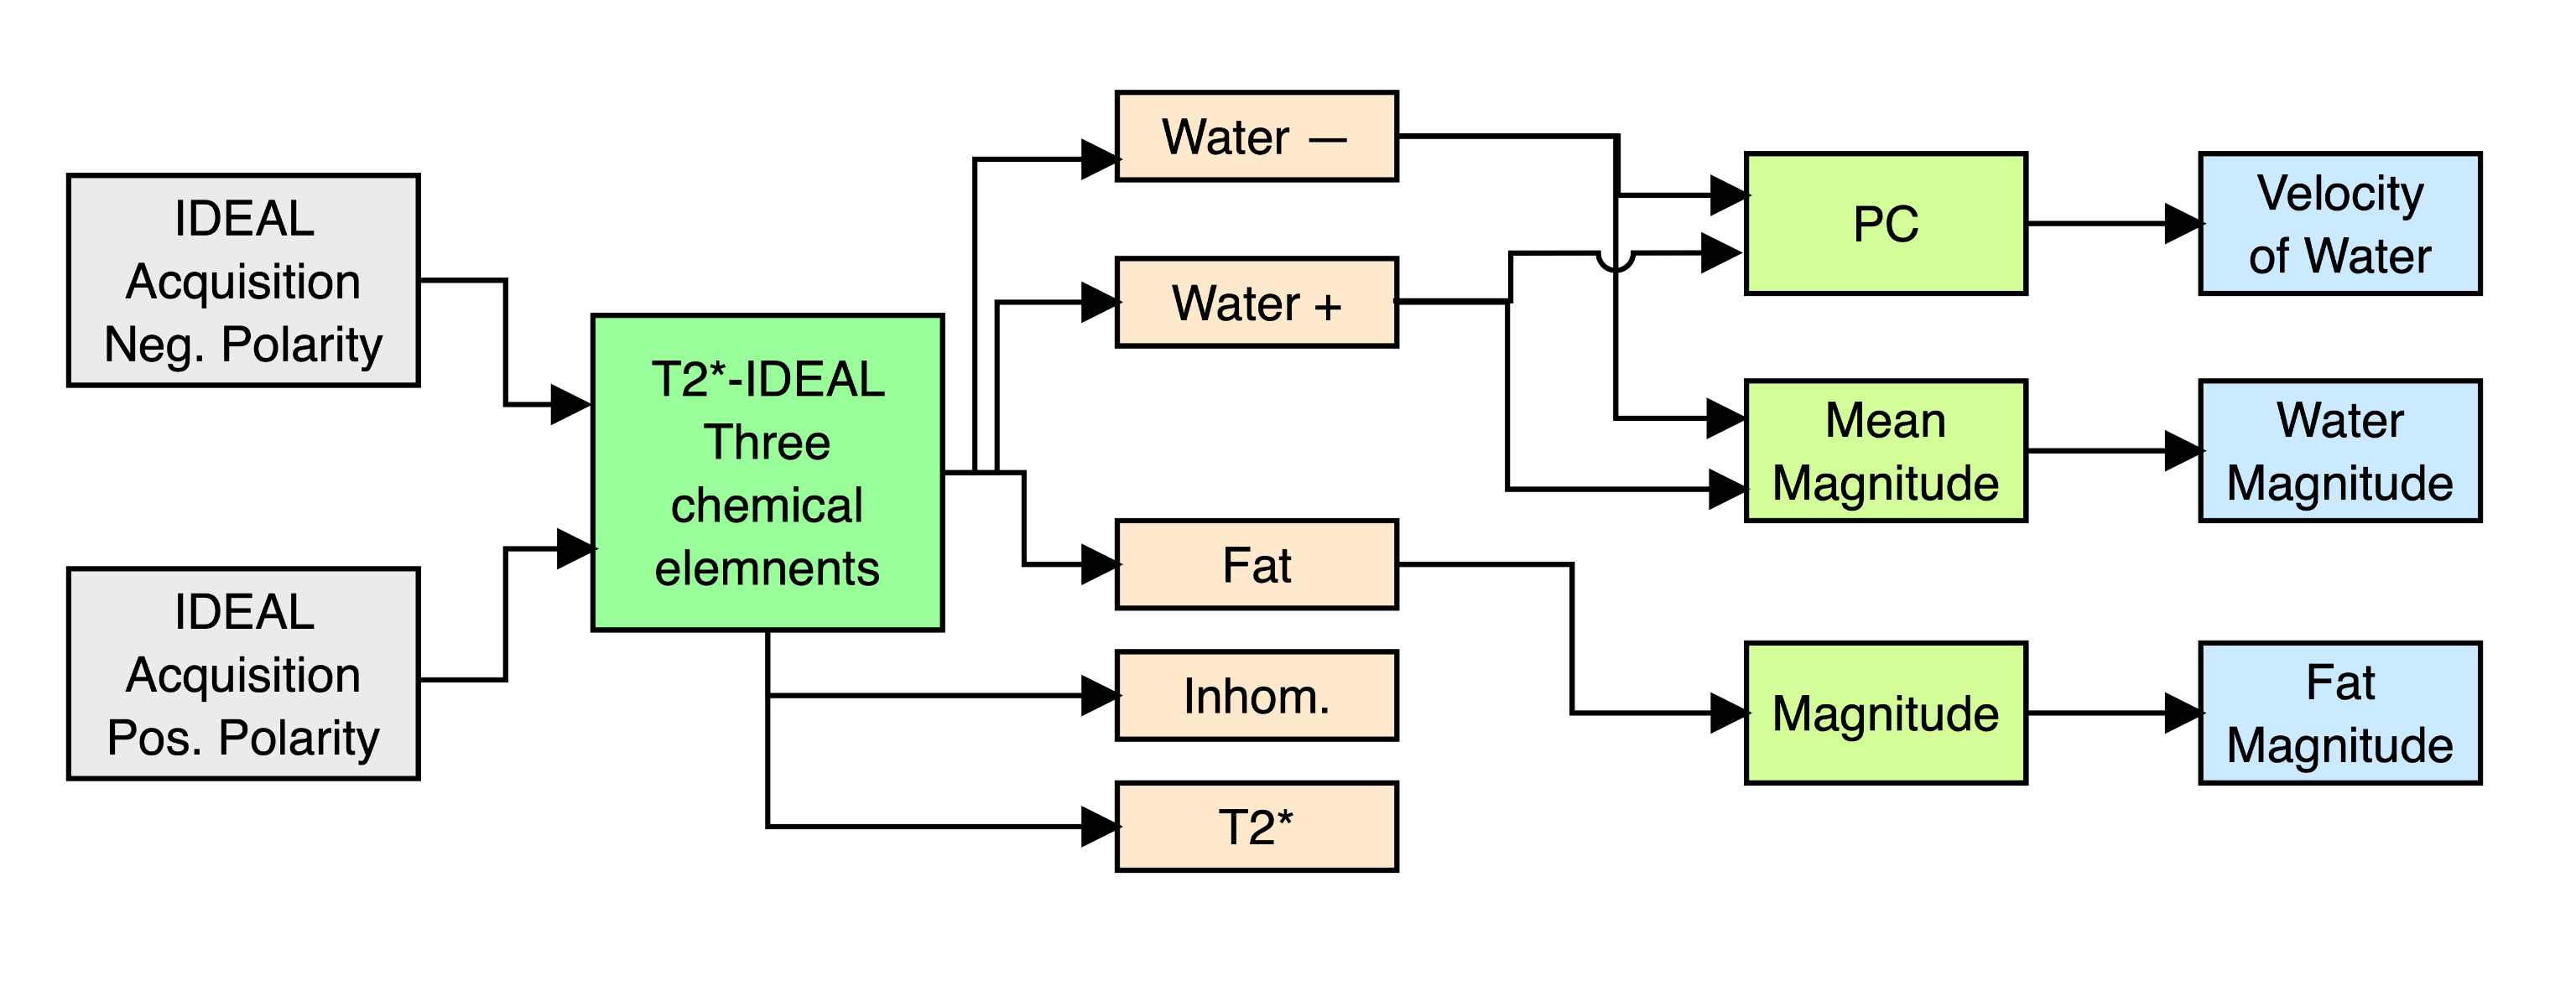
The hypothesis of our proposed PC T2*-IDEAL method, are that the MRI signal only had information of two elements, water and fat, and the resulting concentrations were complex images composed of magnitude and phase. We assumed that only the water concentration had velocity information, and it was encoded in the phase of the signal.The PC T2*-IDEAL method, summarized in Figure 1, requires obtaining two IDEAL acquisitions with bipolar pulses of opposite polarity before the multi-echo sequence. Then, using as input the two PC IDEAL acquisitions, we perform the T2*-IDEAL method considering three chemical elements, where we model the water concentrations in the IDEAL acquisitions as two different chemical elements, and fat concentrations as the third chemical element. This model scheme will allow us to obtain two water concentrations acquired with bipolar pulses of opposite polarity.
We estimated the fat concentration as the magnitude of the fat complex image and the water concentration as the average of magnitudes of both water complex images obtained to increase the SNR. Finally, we performed PC using the water complex images obtained from applying the T2*-IDEAL method with three chemical elements.
Experiments
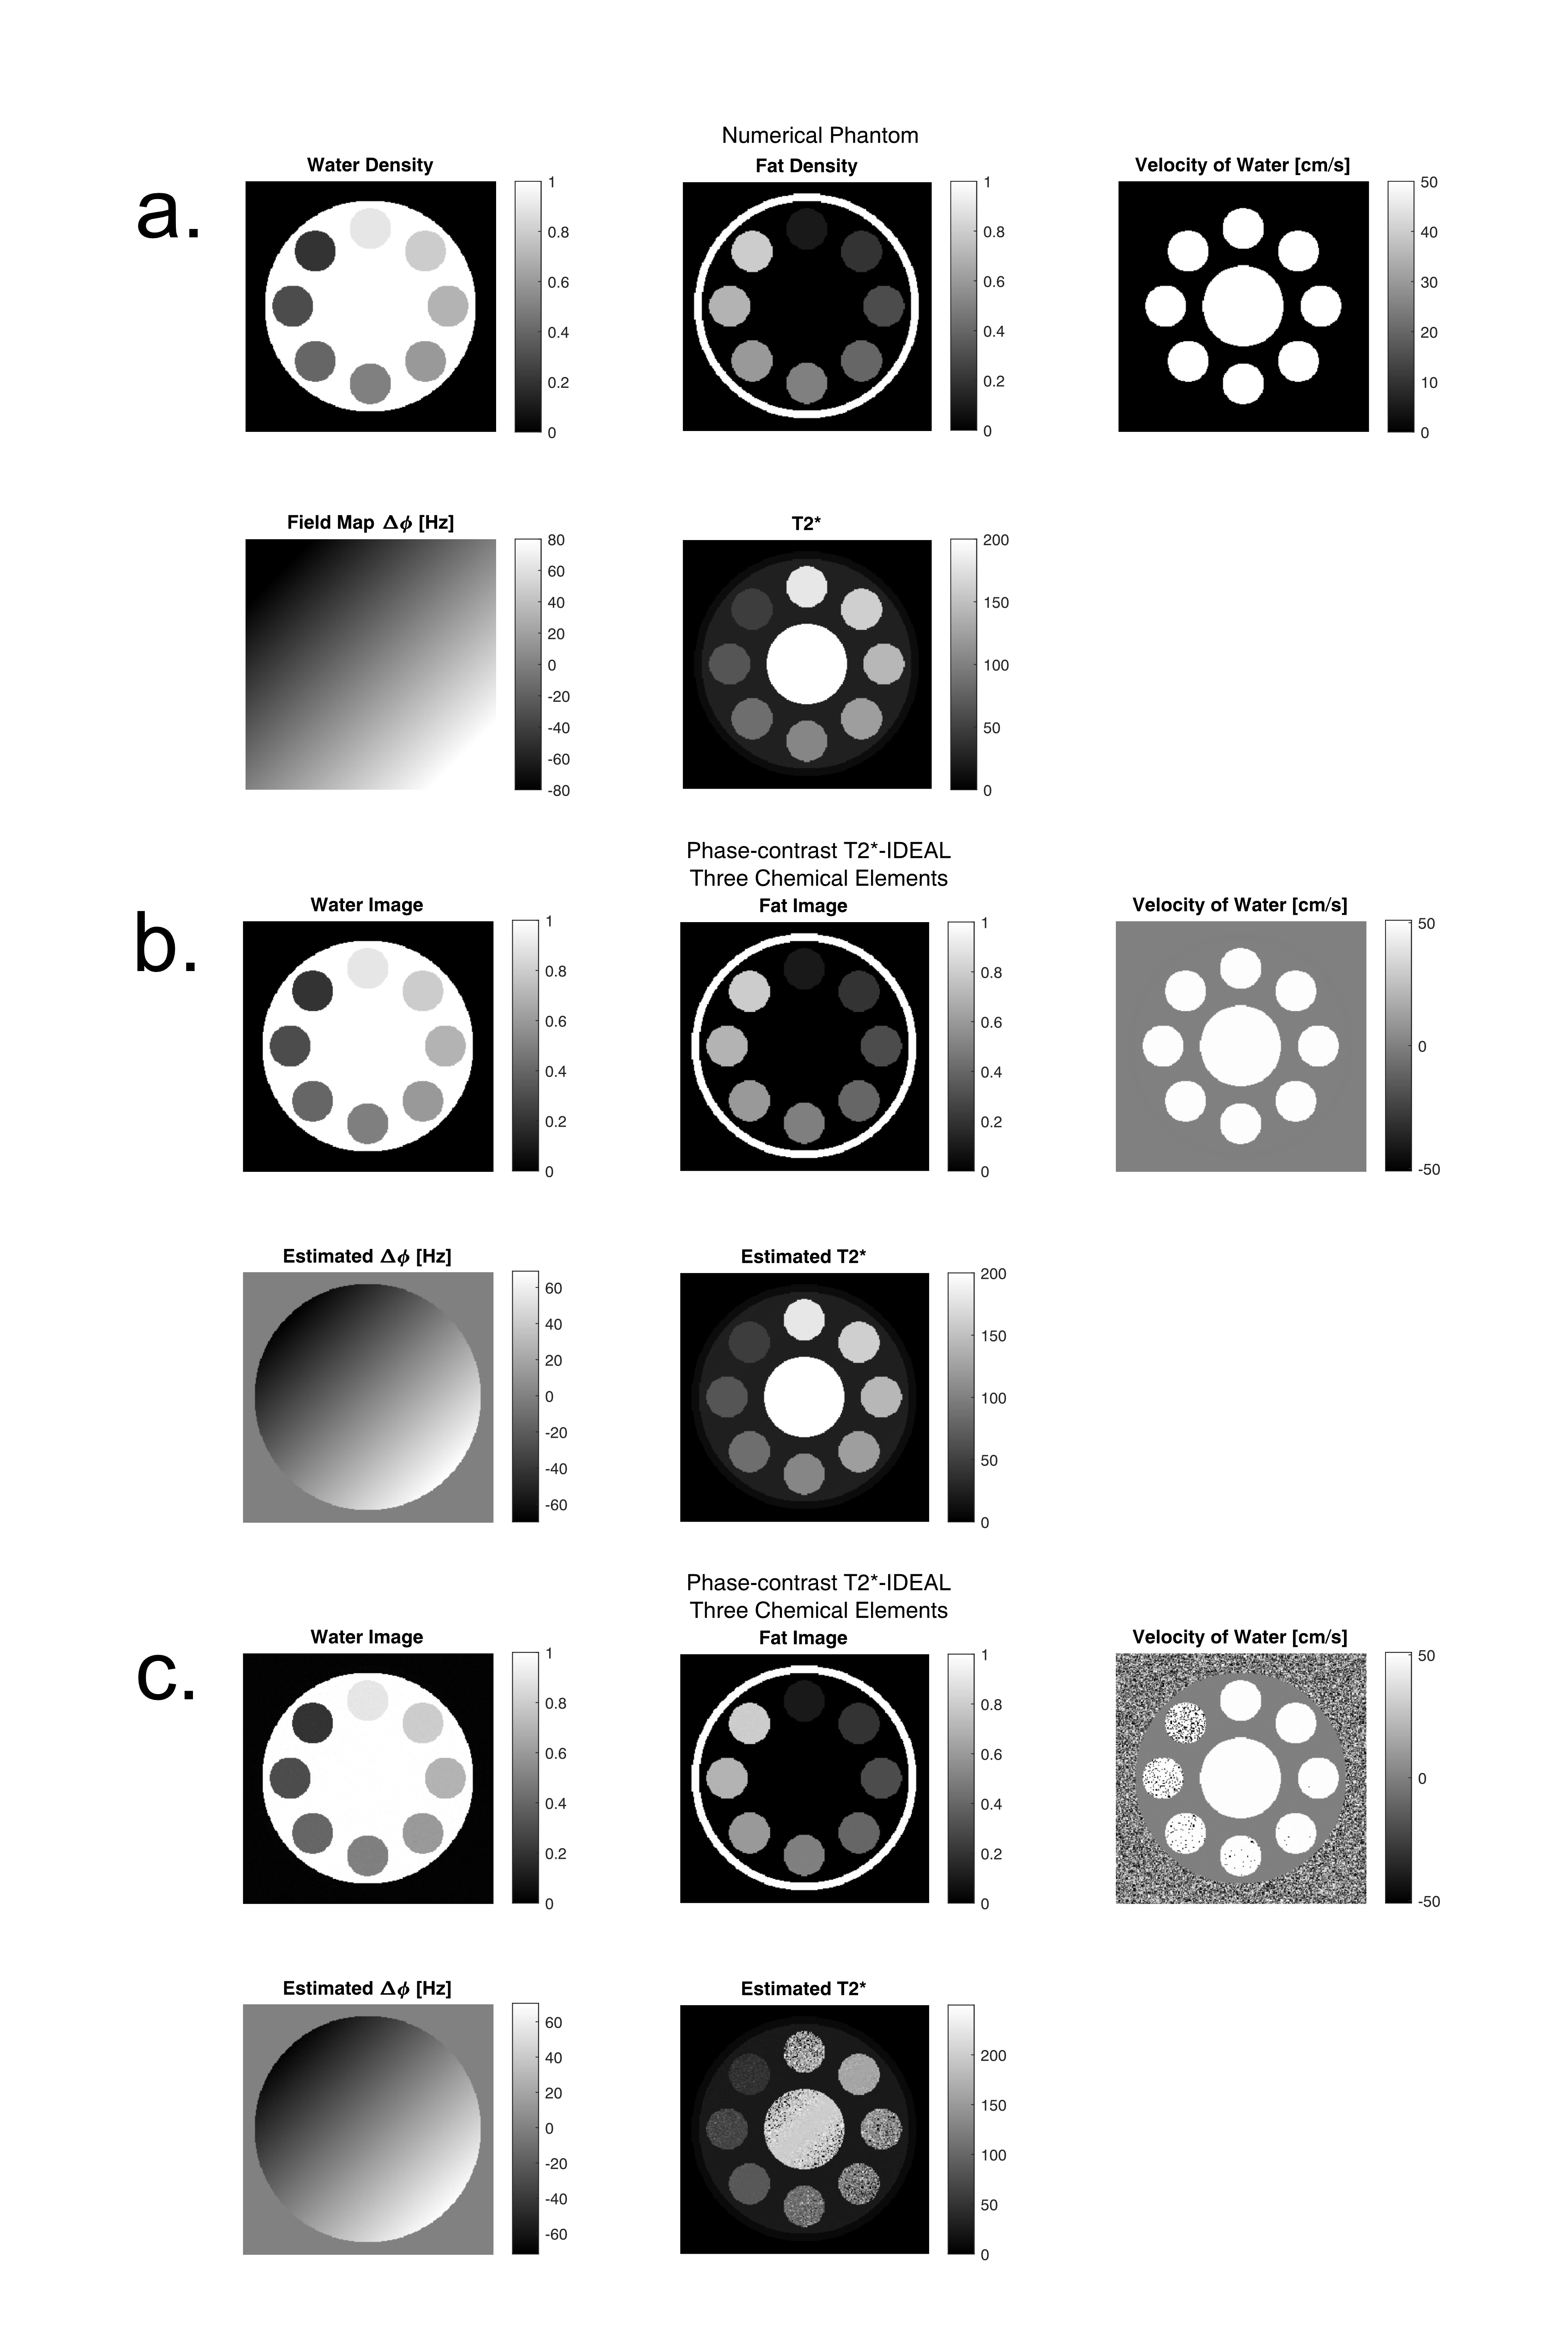
To perform PC using the water concentrations, we demonstrated empirically that the T2*-IDEAL water-fat separation method preserves the phase information of each chemical element. Using a numerical phantom of tubes with different concentrations between 0 and 100% of water and fat, a uniform water velocity of 50 cm/s, a linear field inhomogeneities (varying from -70 to 70 Hz), T2* decay, and gaussian noise. We tested the PC T2*-IDEAL with different SNR.
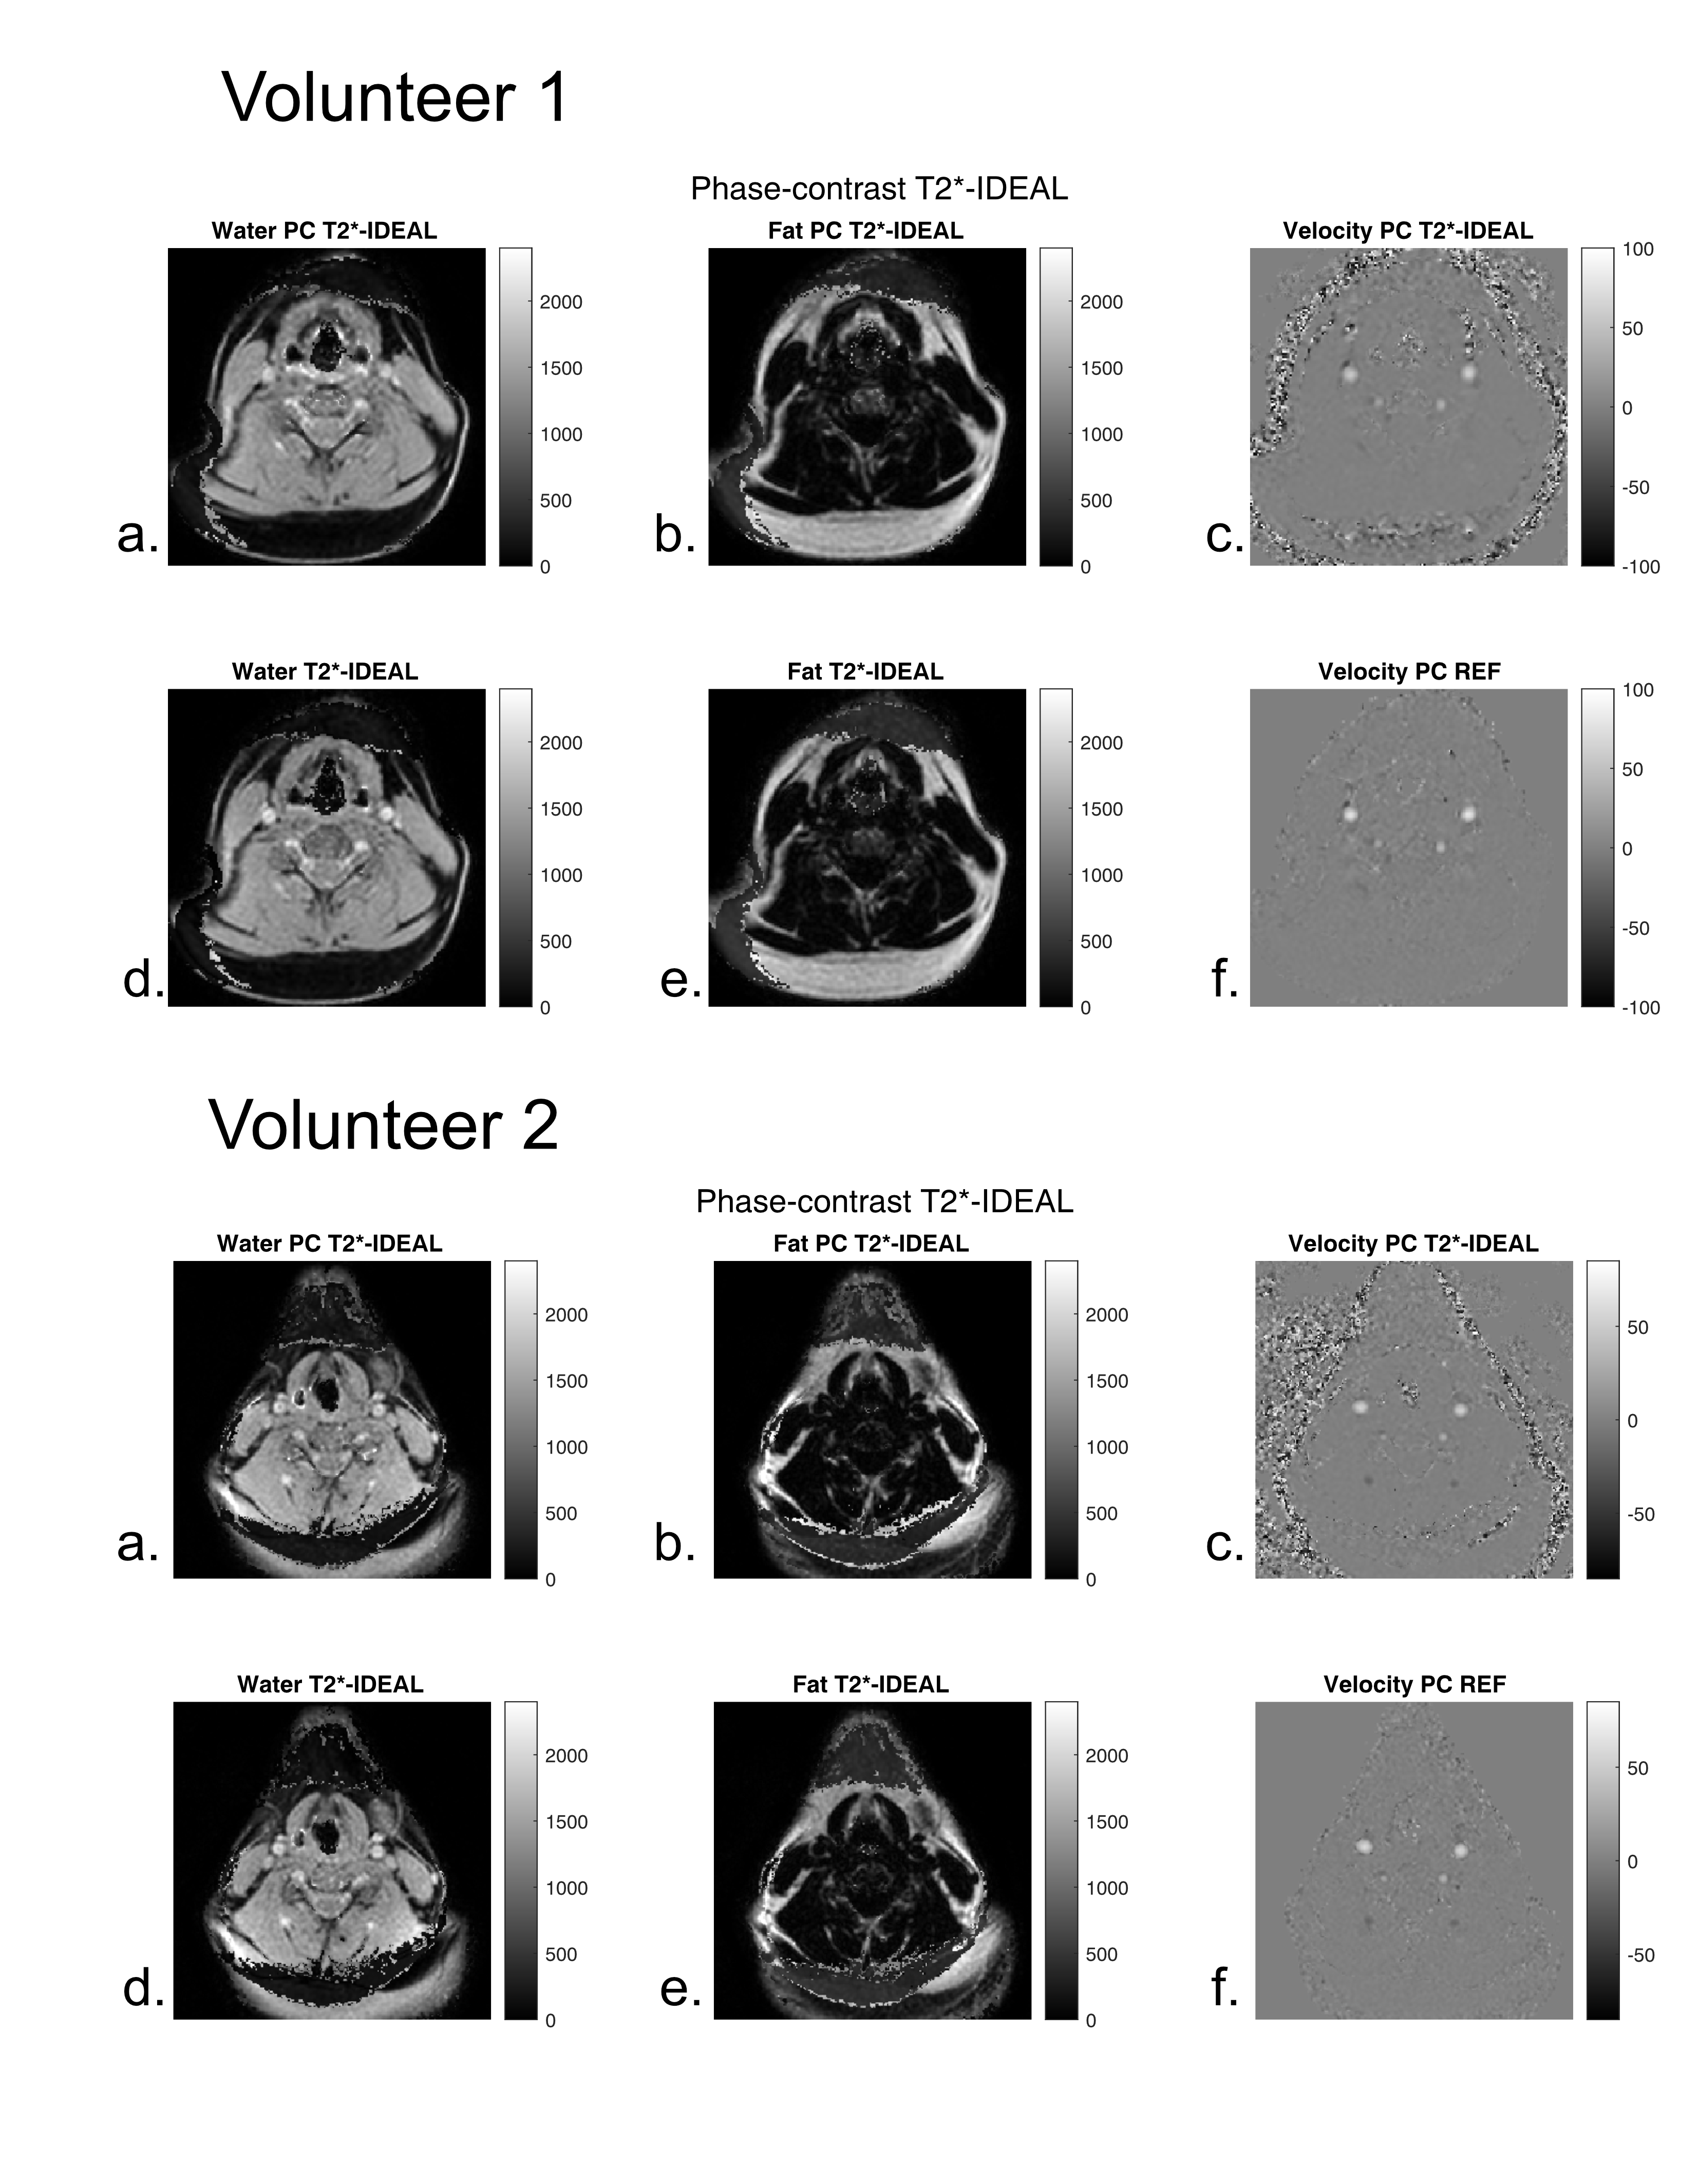
We acquired MRI from two healthy volunteers on a 1.5T Achieva system (Philips, Best, The Netherlands) in a 2D axial section of the neck to obtain water-fat concentrations and measure the blood velocity in the carotid arteries through 20 cardiac phases. We performed acquisitions of PC-IDEAL (TEs shortest) and standard IDEAL (TEs shortest) and PC acquisitions to compare our method with standard acquisitions.
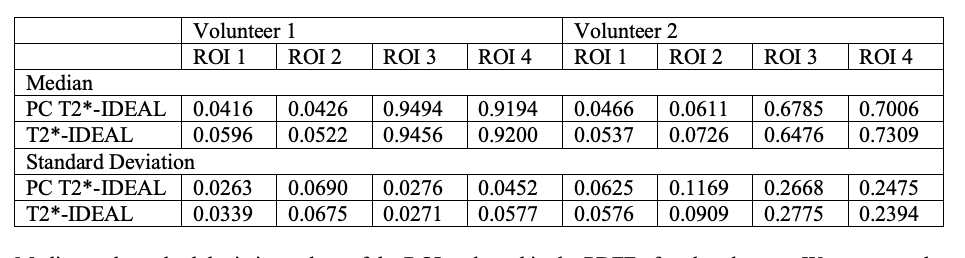
For quantitative comparisons between PC T2*-IDEAL and standard methods, we computed the PDFF for each cardiac phase acquired and calculated the median and the standard deviation from four different ROIs for each volunteer.
Results
Numerical phantom experiments (Figure 2) showed accurate results in water-fat separation and velocity estimation even in presence of gaussian noise.In volunteers, water, fat, and velocity images acquired with the PC T2*-IDEAL showed equivalent results to those obtained using standard separate methods (Figure 3).
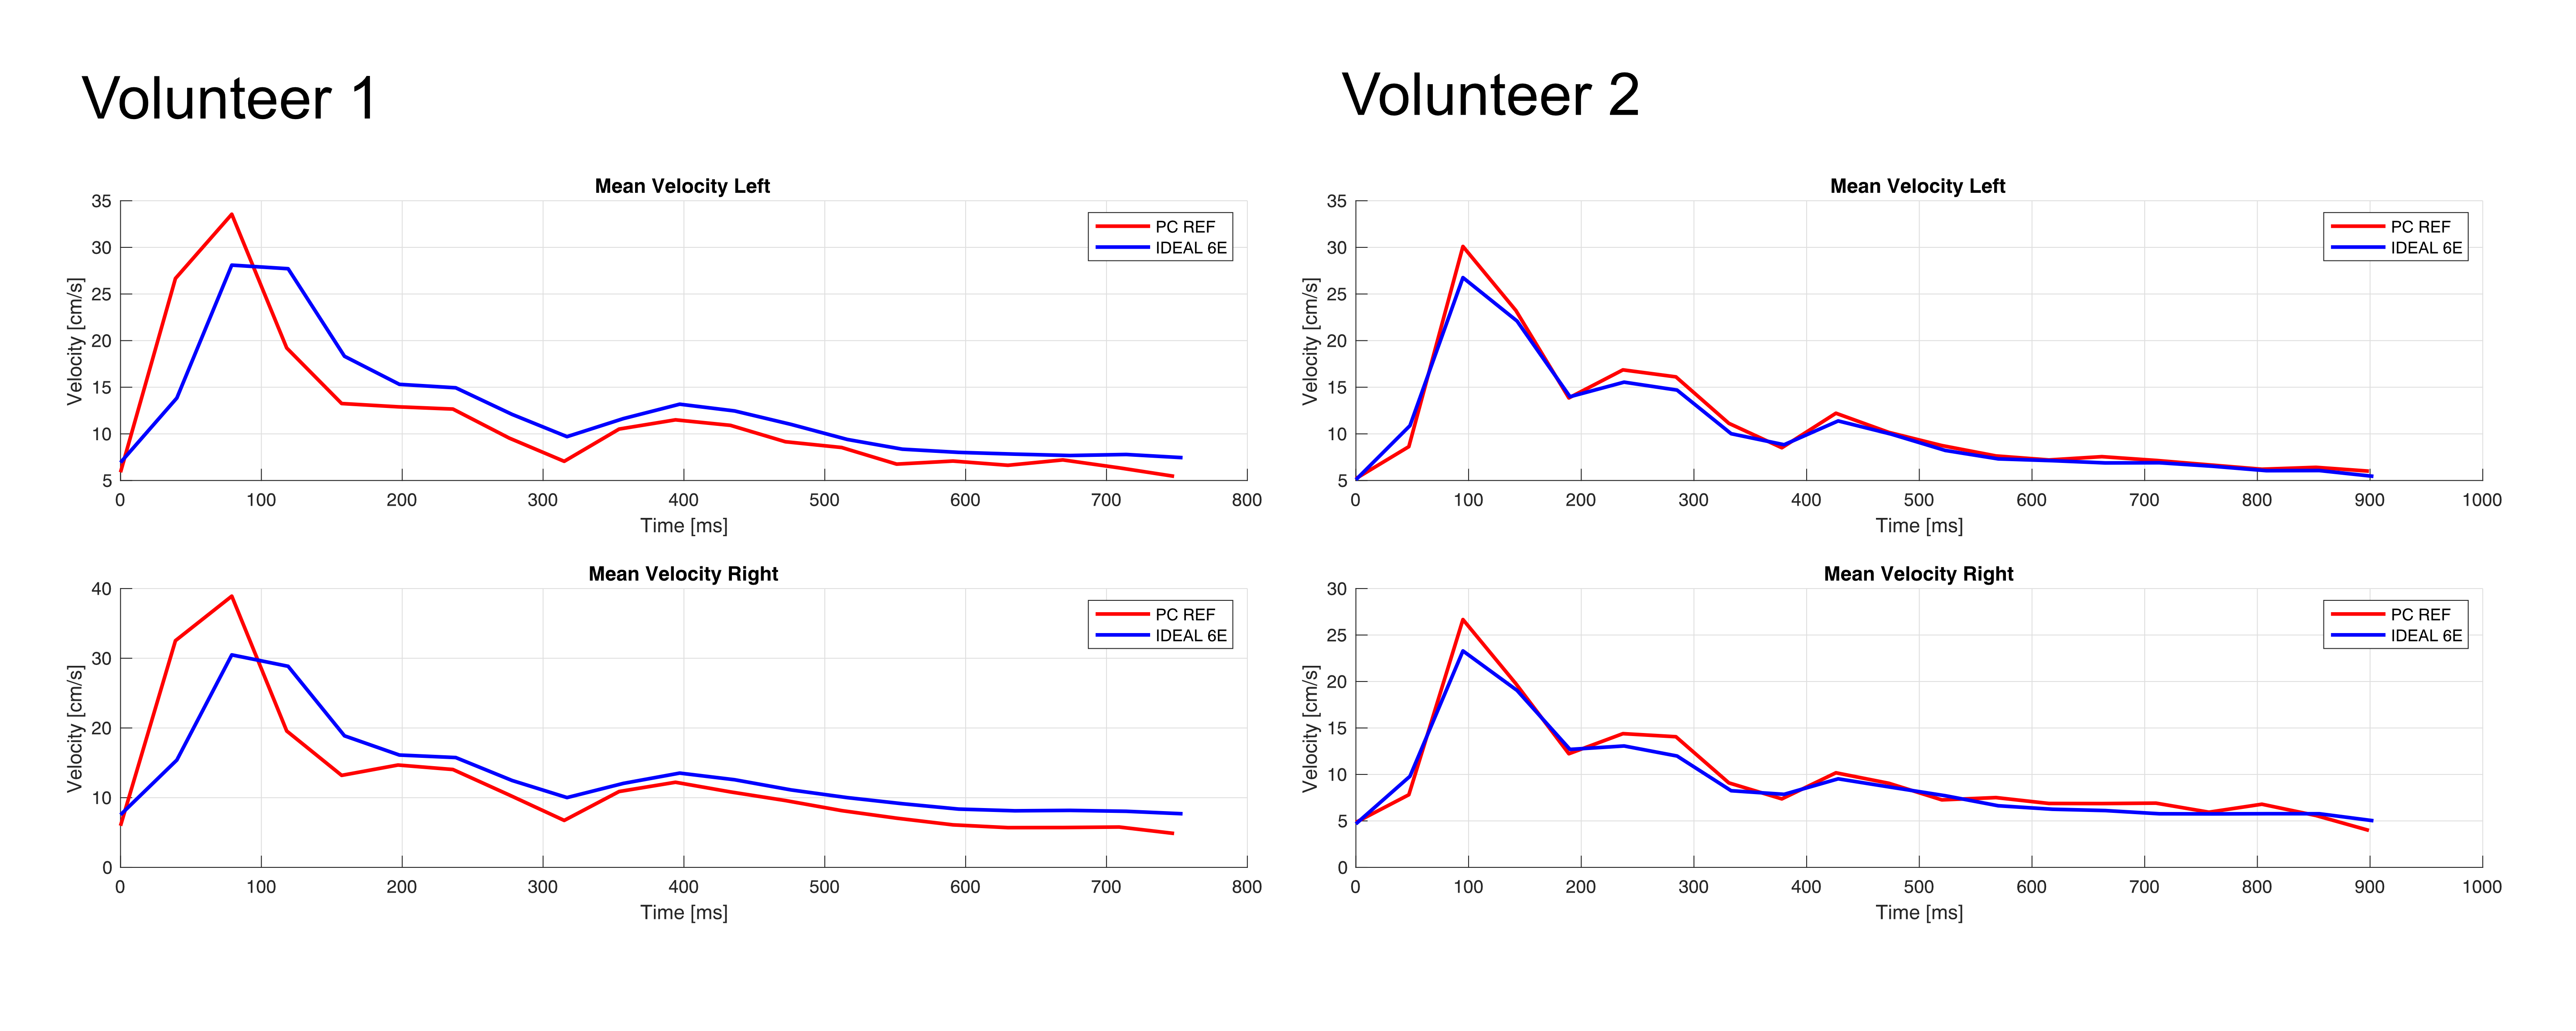
Quantitative comparison of median PDFF between PC T2*-IDEAL and standard methods (Figure 4) showed an NRMSE of 0.0116±0.1816 and 0.0335±0.0675, for each volunteer. Mean velocity profiles obtained with PC T2*-IDEAL and standard methods are also very similar (Figure 5).
Conclusion
In this work we developed a new method that combines PC and T2*-IDEAL water-fat separation that allows us to combine PC with a multi-echo IDEAL acquisition to compute water-fat densities and velocity images using a single acquisition.Since we performed PC using only the water concentrations, this method can be used as a fat suppression method in velocity images10. This has relevance in clinical applications for anatomical areas with significant fat signal.
Acknowledgements
This work has been funded by ANID-PIA-ACT192064 and ANID – Millennium Science Initiative Program – NCN17_129. Also, FONDECYT # 1181057. Arrieta C. was partially funded by CONICYT FONDECYT Postdoctorado 2019 #3190763, CONICYT PCI REDES 180090, and ANID-FONDECYT de Iniciación en Investigación 2020 #11200481.References
1. Glover GH, Schneider E. Three-point dixon technique for true water/fat decomposition with B0 inhomogeneity correction. Magnetic Resonance in Medicine. 1991;18(2):371-383. doi:https://doi.org/10.1002/mrm.1910180211
2. Brown RW, Cheng YCN, Haacke EM, Thompson MR, Venkatesan R. MR Angiography and Flow Quantification. In: Magnetic Resonance Imaging. John Wiley & Sons, Ltd; 2014:701-737. doi:https://doi.org/10.1002/9781118633953.ch24
3. Eggers H, Börnert P. Chemical shift encoding-based water–fat separation methods. Journal of Magnetic Resonance Imaging. 2014;40(2):251-268. doi:https://doi.org/10.1002/jmri.24568
4. Ma J. Dixon techniques for water and fat imaging. Journal of Magnetic Resonance Imaging. 2008;28(3):543-558. doi:https://doi.org/10.1002/jmri.21492
5. Wang Y, Li D, Haacke EM, Brown JJ. A three-point dixon method for water and fat separation using 2D and 3D gradient-echo techniques. Journal of Magnetic Resonance Imaging. 1998;8(3):703-710. doi:https://doi.org/10.1002/jmri.1880080329
6. Reeder SB, Wen Z, Yu H, Pineda AR, Gold GE, Markl M, Pelc NJ. Multicoil Dixon chemical species separation with an iterative least-squares estimation method. Magnetic Resonance in Medicine. 2004;51(1):35-45. doi:https://doi.org/10.1002/mrm.10675
7. Reeder SB, Pineda AR, Wen Z, Shimakawa A, Yu H, Brittain JH, Gold GE, Beaulieu CH, Pelc NJ. Iterative decomposition of water and fat with echo asymmetry and least-squares estimation (IDEAL): Application with fast spin-echo imaging. Magnetic Resonance in Medicine. 2005;54(3):636-644. doi:https://doi.org/10.1002/mrm.20624
8. Yu H, McKenzie CA, Shimakawa A, Vu AT, Brau ACS, Beatty PJ, Pineda AR, Brittain JH, Reeder SB. Multiecho reconstruction for simultaneous water-fat decomposition and T2* estimation. Journal of Magnetic Resonance Imaging. 2007;26(4):1153-1161. doi:https://doi.org/10.1002/jmri.21090
9. Johnson KM, Wieben O, Samsonov AA. Phase-contrast velocimetry with simultaneous fat/water separation. Magnetic Resonance in Medicine. 2010;63(6):1564-1574. doi:https://doi.org/10.1002/mrm.22355
10. Middione MJ, Ennis DB. Chemical shift-induced phase errors in phase-contrast MRI. Magnetic Resonance in Medicine. 2013;69(2):391-401. doi:https://doi.org/10.1002/mrm.24262
Figures