4063
Improved Phase-cycling Preparations in Quantitative T1rho Mapping1Department of Radiology, Albert Einstein College of Medicine, Bronx, NY, United States, 2Department of Medical Physics, Memorial Sloan Kettering Cancer Center, New York, NY, United States
Synopsis
Phase-cycling (PC) has been proposed as an effective method to minimize the impact of B0 and B1 field inhomogeneities in quantitative T1rho mapping, which needs both positive and negative longitudinal magnetization T1rho preparations. We propose here a simple magnetization inversion with an adiabatic inversion RF pulse before an established T1ρ preparation module to achieve an opposite PC. This approach has been shown to be much less sensitive to B0/B1 field imperfections compared with a traditional approach of reversing the phase of the last 90° RF pulse.
Introduction
Quantitative T1rho (T1ρ) mapping MRI has been shown to be sensitive to pH, macromolecule density, and metabolic dynamics in tissues such as the cartilage, muscle, and brain1. One of the technical challenges in quantitative T1ρ mapping is its high sensitivity to B0 and B1 field inhomogeneities. Phase-cycling (PC) has been proposed as an effective method to minimize the impact of B0 and B1 field inhomogeneities, and to eliminate the signal contaminations due to T1 relaxation along a GRE readout train.2-4 In a PC sequence, both positive (Mz+) and negative (Mz-) magnetization-prepared signals are acquired and complex data subtracted before T1ρ-decay curve fitting. To achieve the opposite PC preparation, the phase of the last 90° hard pulse can be inversed in phase, which readily leads to high sensitivity to B1 field inhomogeneities. Alternatively, two different T1ρ preparation for Mz+ and Mz- can be applied,4 which complicates the sequence design and potentially introduces extra quantitative deviations. In this work, we propose magnetization inversion with an adiabatic inversion RF pulse before a T1ρ preparation module to achieve both a simple sequence design and insensitivity to B0/B1 imperfections.Methods
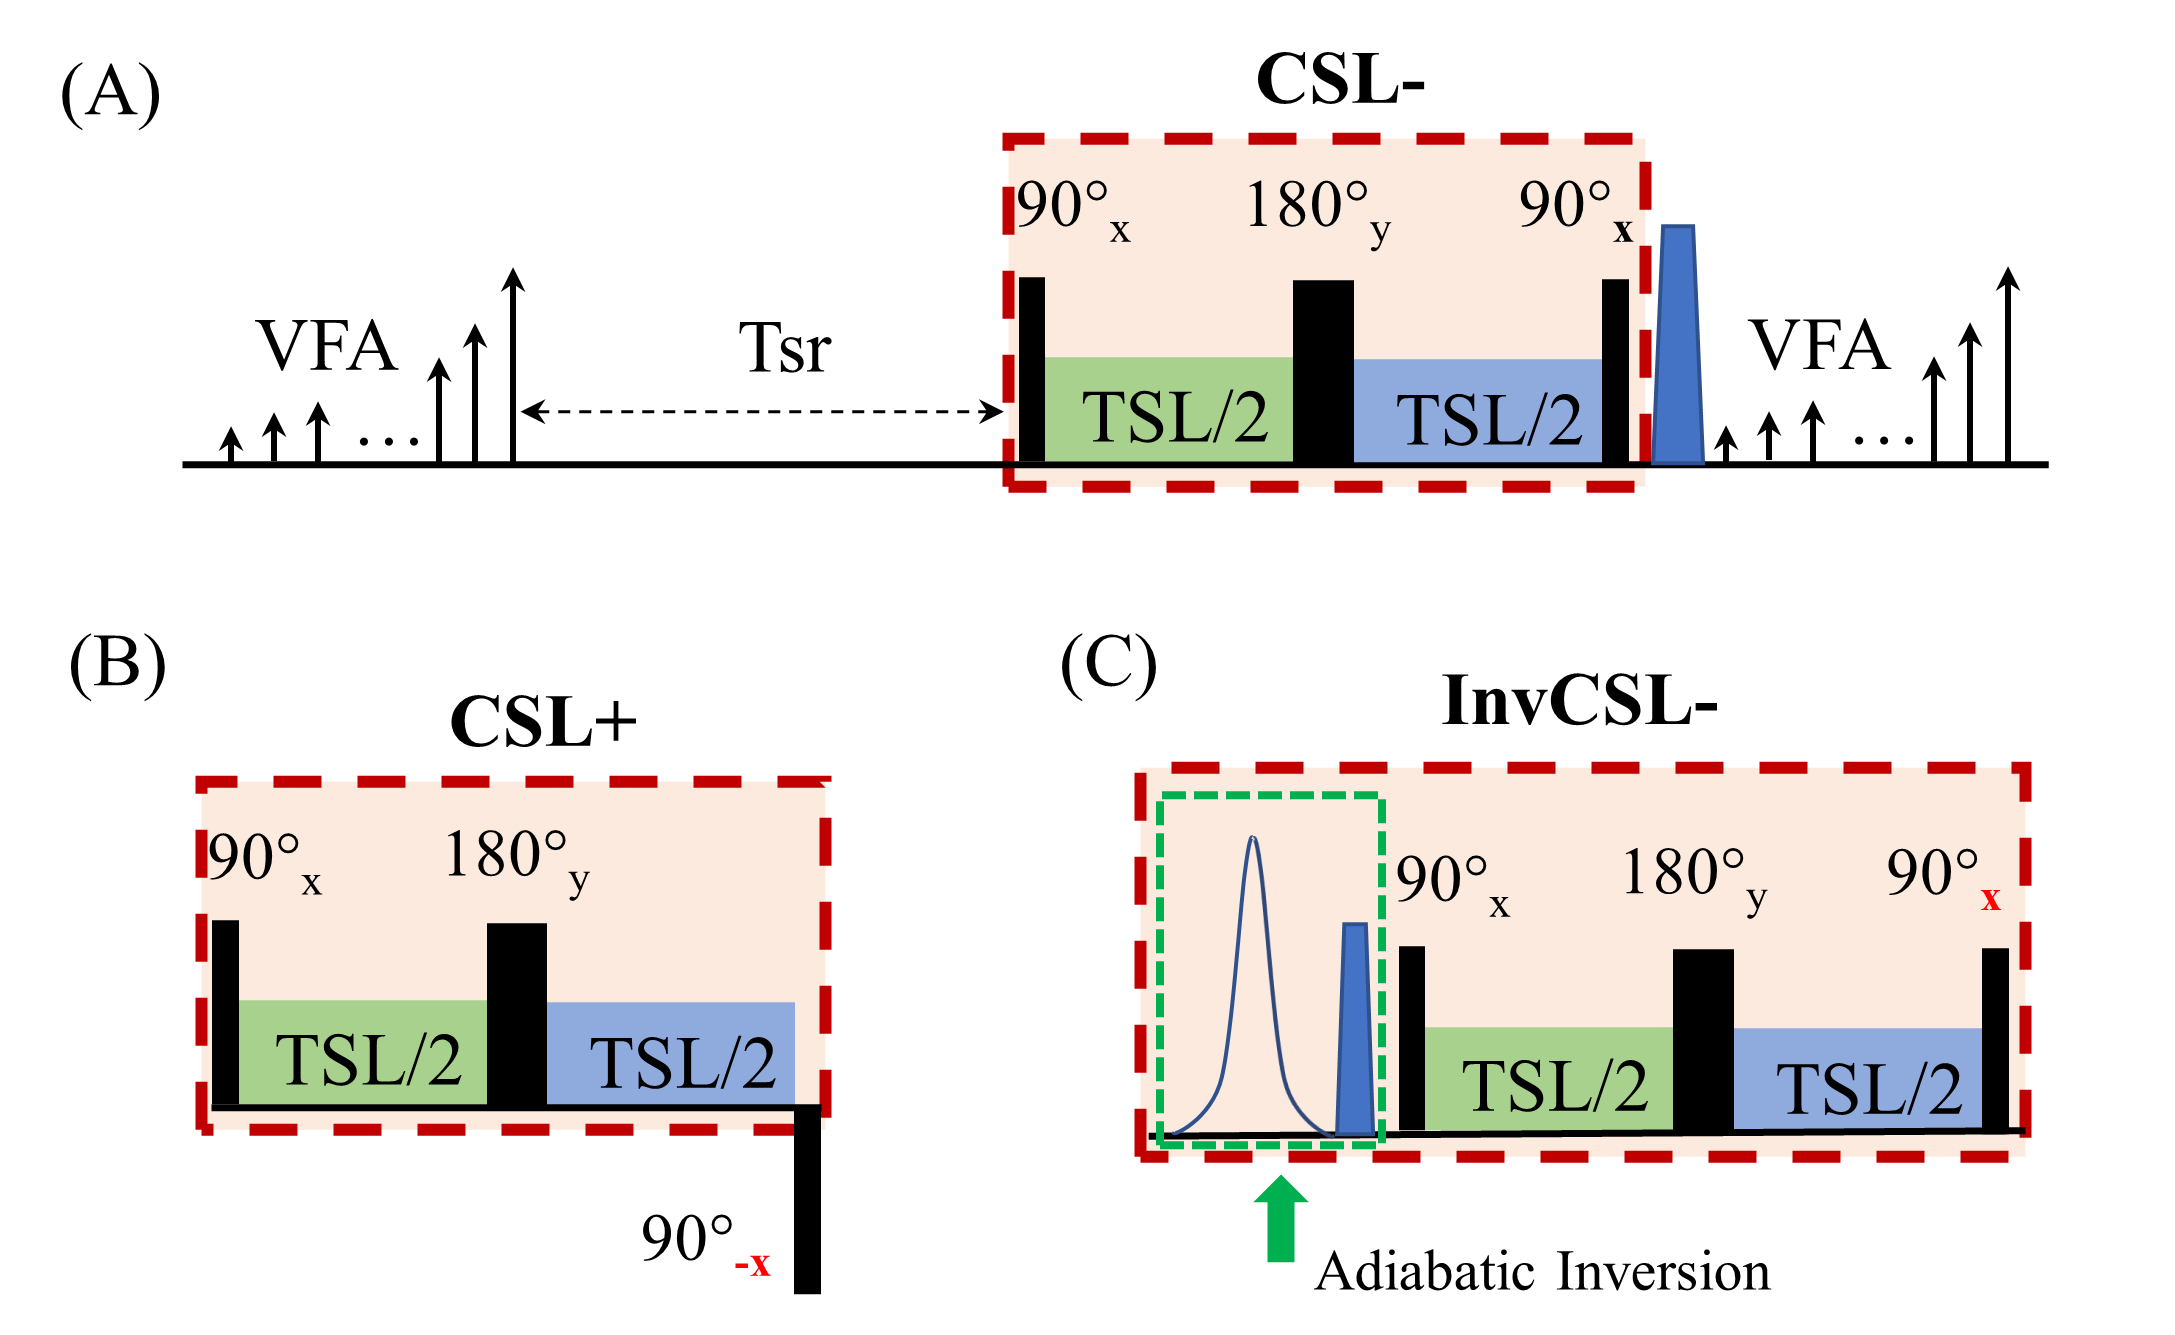
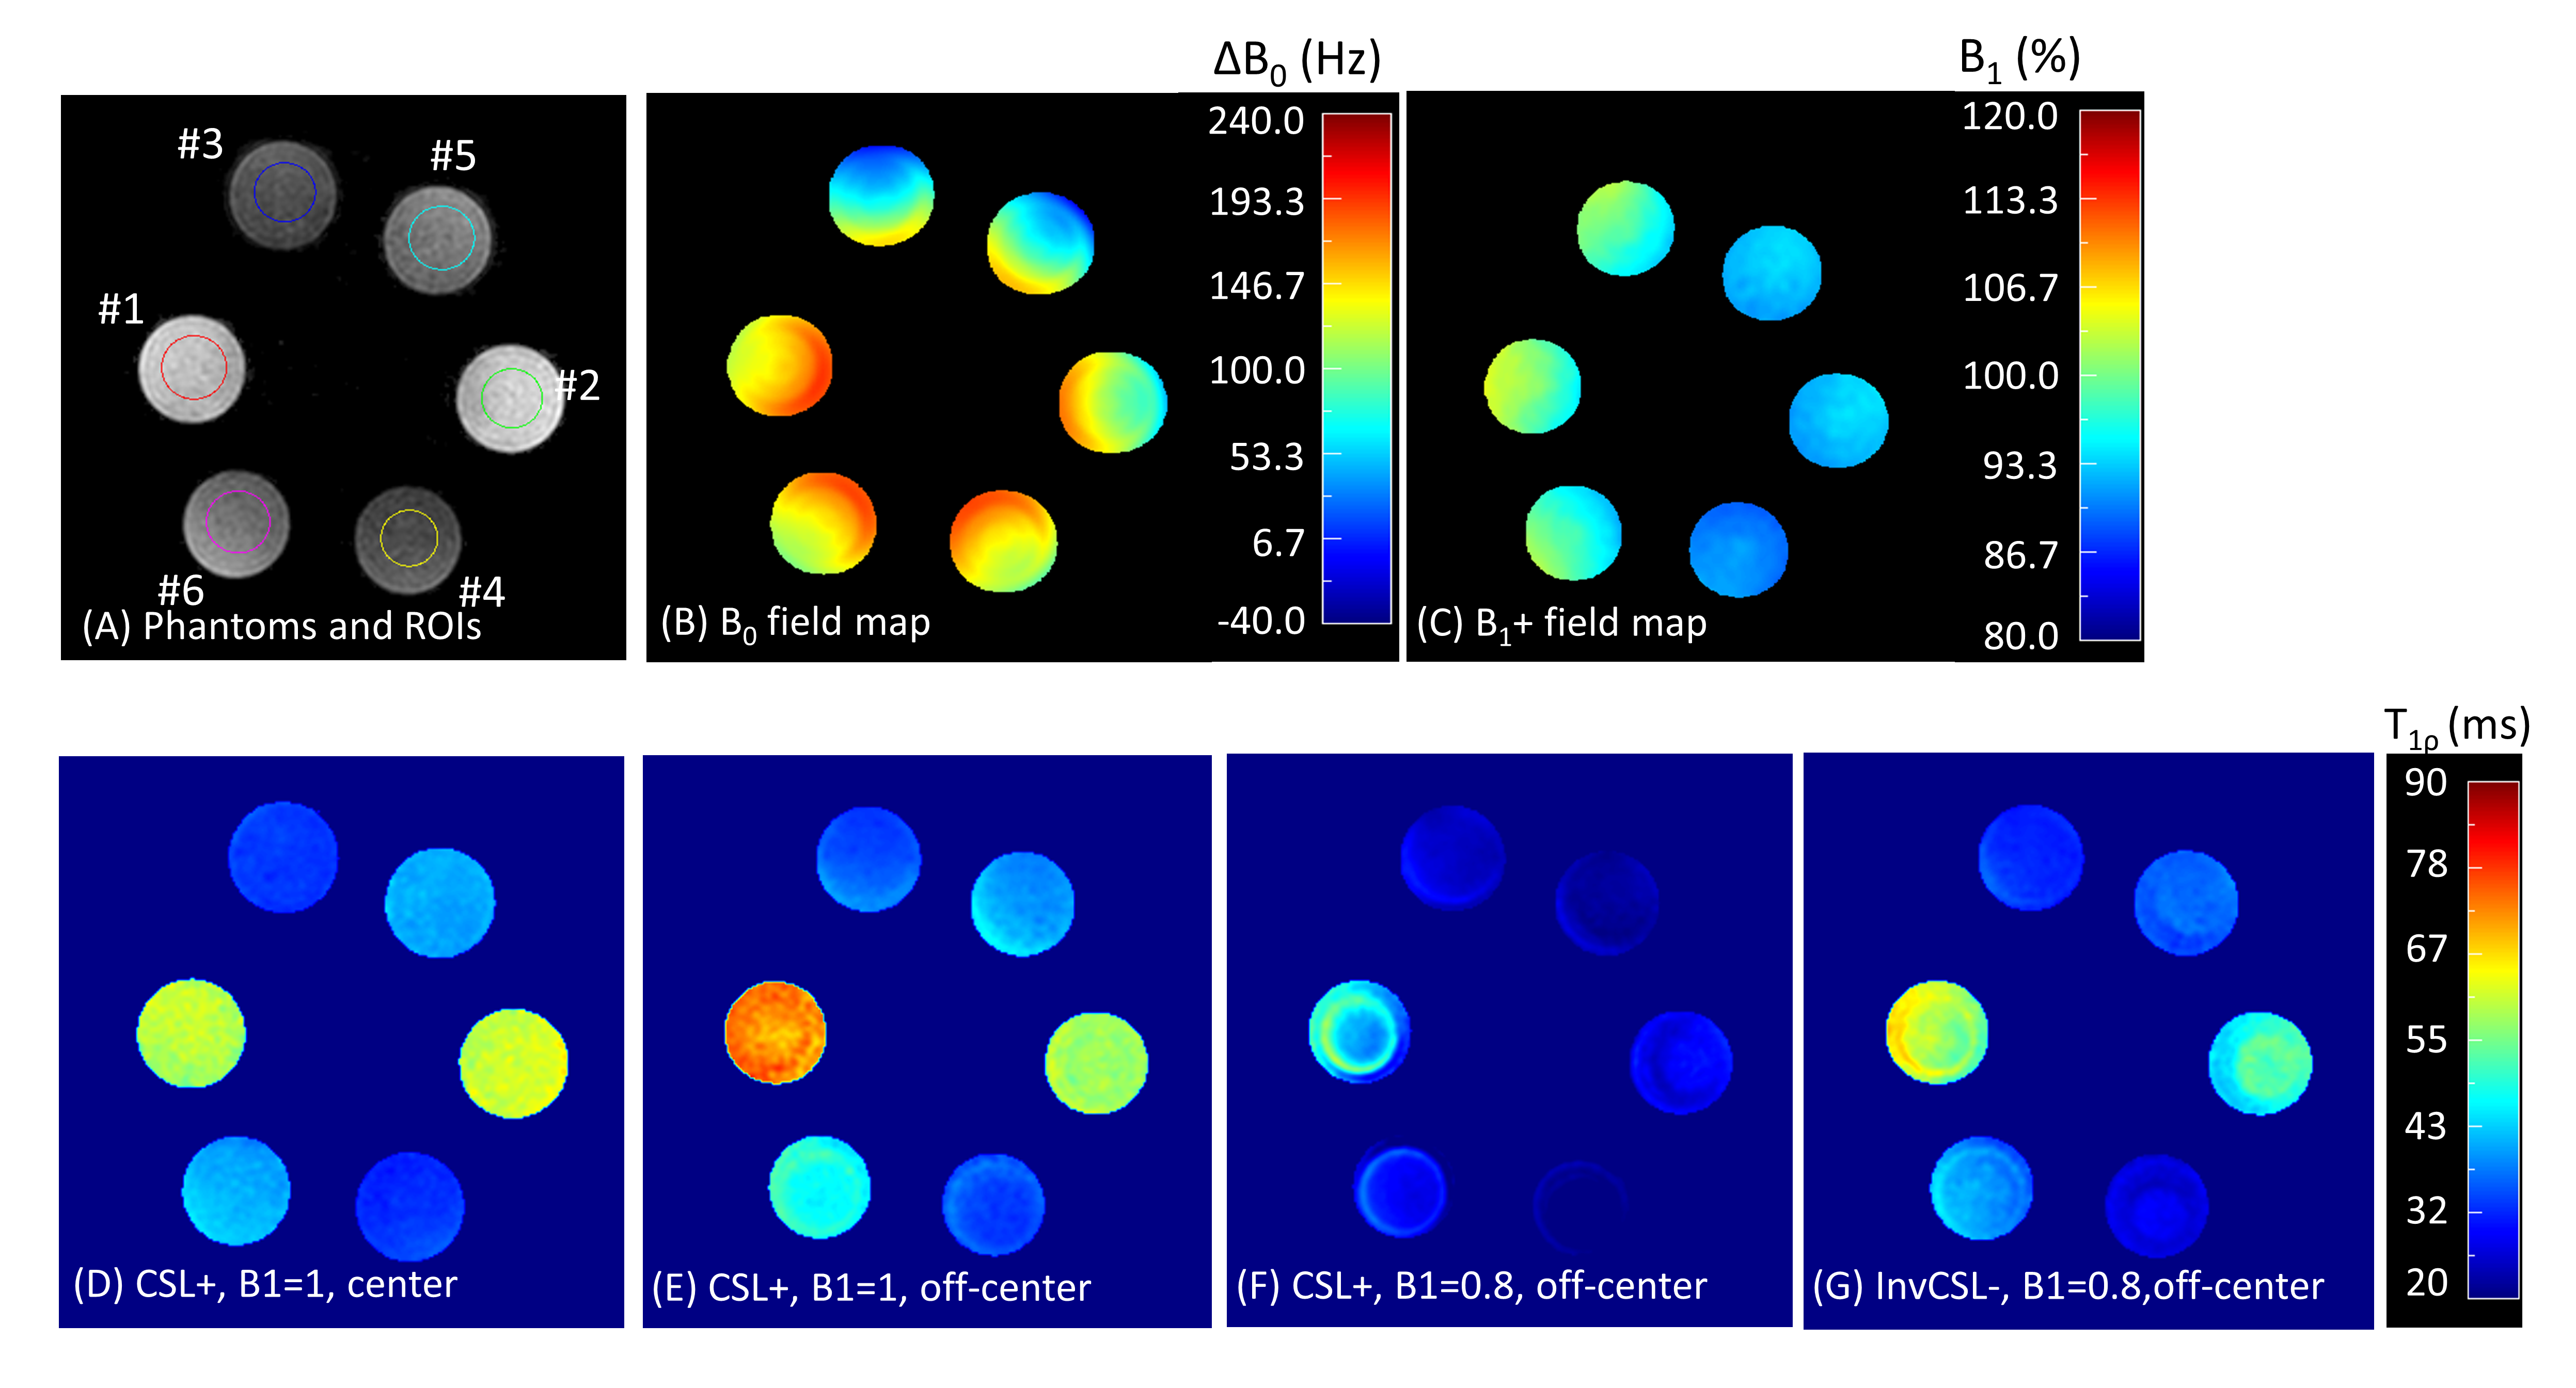
A 3D MAPSS sequence based on segmented GRE readouts was utilized in this study (Figure 1A). The reference T1ρ preparation, herein referred to as the composite spin-echo (CSL) preparation,5 had a 90°x-TSL/2-180°y-TSL/2-90°x RF pulse train (termed “CSL-” preparation herein, where “-” means magnetization prepared to -Mz), which has been shown to be robust to both B0- and B1-imperfections (Figure 1A). Two different T1ρ preparations leading to +Mz based on CSL- were tested. The first had 90°x-TSL/2-180°y-TSL/2-90°-x as shown in Figure 1B (termed CSL+), with the last 90° RF pulse having an opposite phase compared to that of the CSL- preparation. In the second method (InvCSL-), an adiabatic inversion RF pulse (9.21ms, BW=1.38kHz) followed by a gradient spoiler was inserted before the CSL- module (Figure 2C). All imaging was performed on a 3T Philips Ingenia scanner with a 1ch-TX/16ch-Rx knee coil on a phantom consisted of three pairs of lab tubes with agarose concentrations of 2, 3, and 4 % (Figure 2A.). These three T1ρ preparations were evaluated in a 3D MAPSS sequence with spinlock frequency of 300Hz and five times of spinlock (TSL) of 0, 17, 34, 51, and 68ms. Other scan parameters were: FOV=140/140/120mm, voxel size=1x1x4mm3, TR/TE=5.4/2.6ms, TFE factor=16 with centric profile ordering, and compressed SENSE factor=3. To evaluate the sensitivity to B1 imperfections in each T1ρ preparation, each sequence was repeated with 90° and 180° hard RF pulses manually misadjusted to 0.9 and 0.8 times of the nominal B1 amplitude. Six 3D ROIs from six tubes were generated after eroding seven boundary voxels in all three directions. The same 3D ROIs were applied to all the 3D T1ρ maps from different B1 scales to measure their T1ρ mean and standard deviation (SD). Additionally, a reference T1ρ was measured for each T1ρ preparation method from the central phantom slice of each tube with negligible B0 and B1 imperfections to calculate the mean percent error for each preparation approach.Results
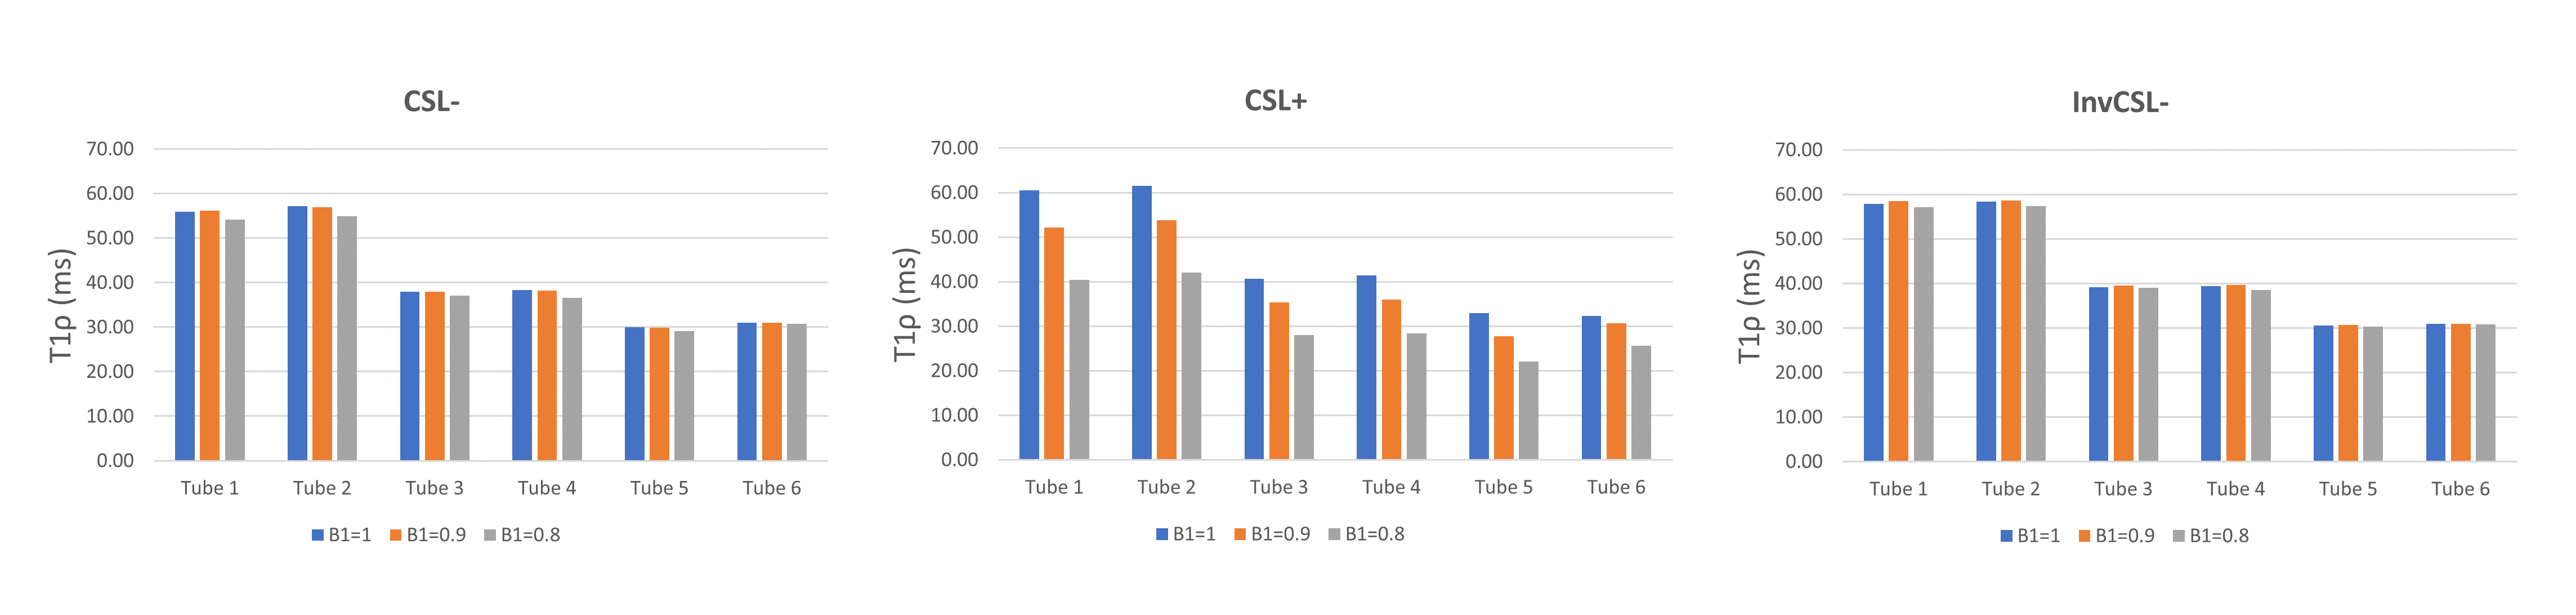
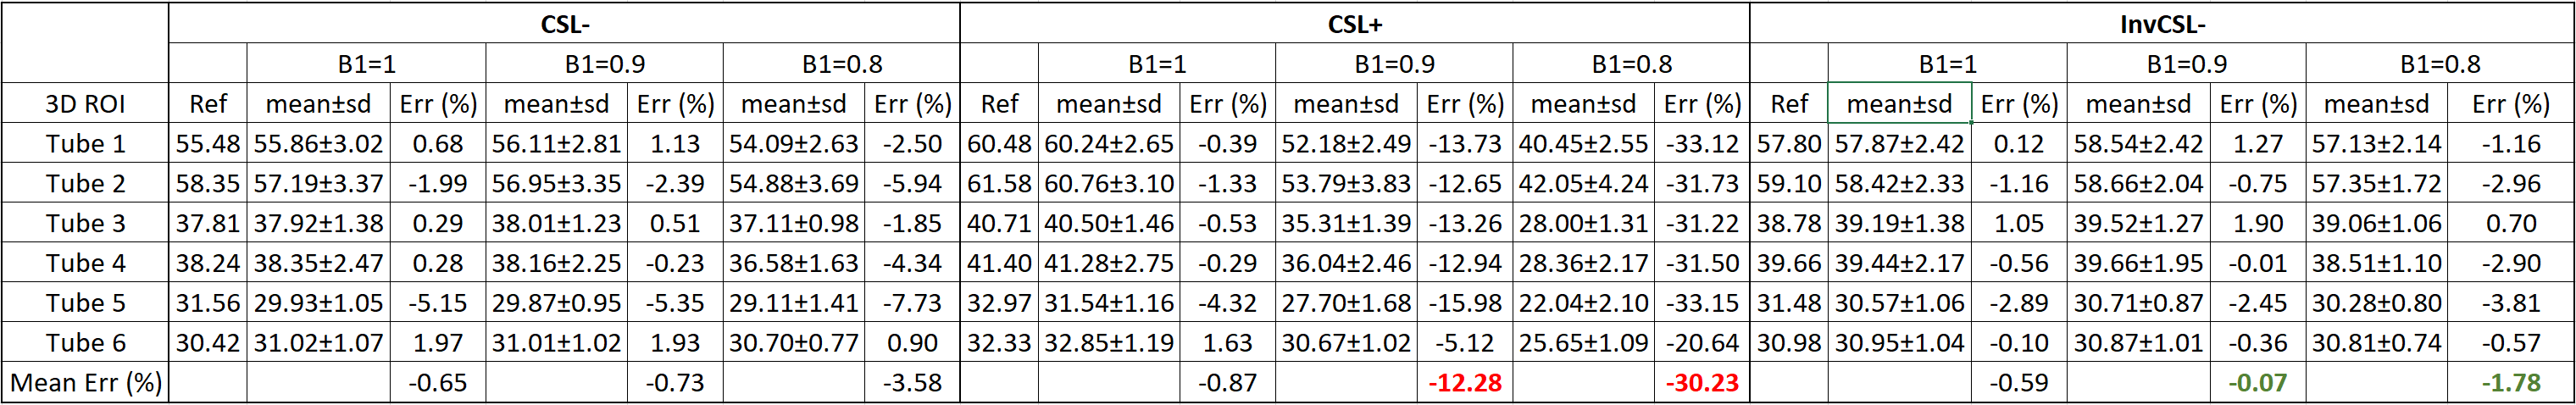
Without manually adjusting B1 scale to 0.8 and 0.9, all three T1ρ preparations resulted in uniform T1ρ maps on the center-slice for each tube, as shown in Figure 2D. On the off-center slices, both the CSL- and InvCSL- had similar results as in Figure 2D, but CSL+ had increased T1ρ deviations from the center slices (Figure 2E). When B1 was misadjusted, T1ρ maps from both CSL- and InvCSL- preparations had minimal changes compared with maps from B1=1 (Figure 2G), while CSL+ preparation induced much larger deviations as shown in Figure 2F. Comparison of the impact of B1 misadjustment on all three preparations are shown in the column graphs in Figure 3. Both CSL- and InvCSL- preparations had consistent T1ρ results at different B1 scales, while average T1ρ results from CSL+ preparation changed drastically with increasing B1 misadjustment. All quantitative results including the T1ρ reference values from the center 2D ROIs and mean±stdev from the 3D ROIs are summarized in Table 1.Discussion
PC has been shown to be an effective method to reduce T1ρ measurement uncertainty due to B0/B1 field inhomogeneities. An unpaired PC strategy has also been proposed recently to avoid doubled scan duration needed for PC.4 Nevertheless, two T1ρ preparation modules leading to both Mz+ and Mz- are still both needed. The final quantitative quality relies on the quality of both T1ρ preparations. In this work, we present a simple adiabatic inversion before the T1ρ preparation module to achieve opposite PC for a hard-pulse T1ρ preparation. It is shown in this phantom study that InvCSL- had similar performance to B0/B1 field inhomogeneities as the original CSL- preparation, much improved compared with the traditional CSL+ preparation. Although not shown here, this approach has also been tested on adiabatic T1ρ to be much less sensitive to B0/B1 field imperfections compared with an earlier presented approach.6Conclusion
Adiabatic inversion before a T1ρ preparation achieves much improved insensitivity to B0/B1 inhomogeneities compared with a traditional approach of reversing the phase of the last 90° pulse.Acknowledgements
No acknowledgement found.References
1. Borthakur A, Sochor M, Davatzikos C, et al. T1rho MRI of Alzheimer's disease. Neuroimage. 2008;41(4):1199-1205.
2. Li X, Han ET, Busse RF, et al. In vivo T(1rho) mapping in cartilage using 3D magnetization-prepared angle-modulated partitioned k-space spoiled gradient echo snapshots (3D MAPSS). Magn Reson Med. 2008;59(2):298-307.
3. Chen W, Takahashi A, Han E. Quantitative T(1)(rho) imaging using phase cycling for B0 and B1 field inhomogeneity compensation. Magn Reson Imaging. 2011;29(5):608-619.
4. Peng Q, Wu C, Kim J, et al. Efficient Phase Cycling Strategy for High Resolution 3D GRE Quantitative MRI Mapping. NMR in Biomedicine. 2021;Under Review.
5. Witschey WR, 2nd, Borthakur A, Elliott MA, et al. Artifacts in T1 rho-weighted imaging: compensation for B(1) and B(0) field imperfections. J Magn Reson. 2007;186(1):75-85.
6. Wu C, Peng Q. 3D MAPSS T1ρ Mapping with Adiabatic Spin-Locking RF Pulses for Knee and Brain at 3T. Proc Intl Soc Mag Reson Med 29. 2021.
Figures