4056
Accelerated Radial Echo Planar Spectroscopic Imaging in Healthy Prostate with a Reduced Field-of-View1Radiological Sciences, University of California, Los Angeles, Los Angeles, CA, United States
Synopsis
Radial echo planar spectroscopic imaging (REPSI) is applied in healthy prostate and compared to Cartesian EPSI acquisitions. Due to the small spatial extent of the anatomy-of-interest, REPSI is well-suited for acceleration in a reduced-field-of-view context. In this proof-of-concept study, we acquired both prospectively and retrospectively undersampled REPSI and Cartesian EPSI datasets in prostate phantom and in vivo, at multiple acceleration factors, and we compared both quantitative and qualitative results.
Introduction
Monitoring of prostate tumor grade and progression is important for both the diagnosis and treatment of prostate cancer. Multi-parametric MRI and biopsy are widely used for detection and grading of prostate cancer although both techniques can be limited by small tumor size and sampling error bias1-2, respectively. Magnetic resonance spectroscopy (MRS) can complement these modalities by providing further chemical characterization of prostate tumors. In contrast to single-voxel techniques, spectroscopic imaging (MRSI) measures a greater spatial coverage within a single scan, yet requires long acquisitions times which can be clinically impractical3. Faster alternatives based on echo planar (EPSI) trajectories have been proposed to decrease the scan time by an order of magnitude4. More recently, radial EPSI has been proposed as an alternative which can tolerate higher degrees of under-sampling compared to Cartesian EPSI5. Additionally, radial acquisitions in prostate are well-suited for reduced field-of-view (FoV) imaging6, since the anatomy-of-interest is constrained to a relatively small region. In such cases, reduced FoV spectroscopic imaging can further decrease the scan time by enabling greater acceleration factors. In this proof-of-concept study, we accelerate REPSI in the prostate by reducing the number of acquired spokes and applying compressed sensing (CS) with total variation (TV) regularization, resulting in reduced FoV’s and shortened scan times that are within clinically-feasible durations. Prospectively under-sampled radial data sets from in vivo prostate and in a phantom were acquired, as well as data using the more conventional Cartesian EPSI for comparison.Methods
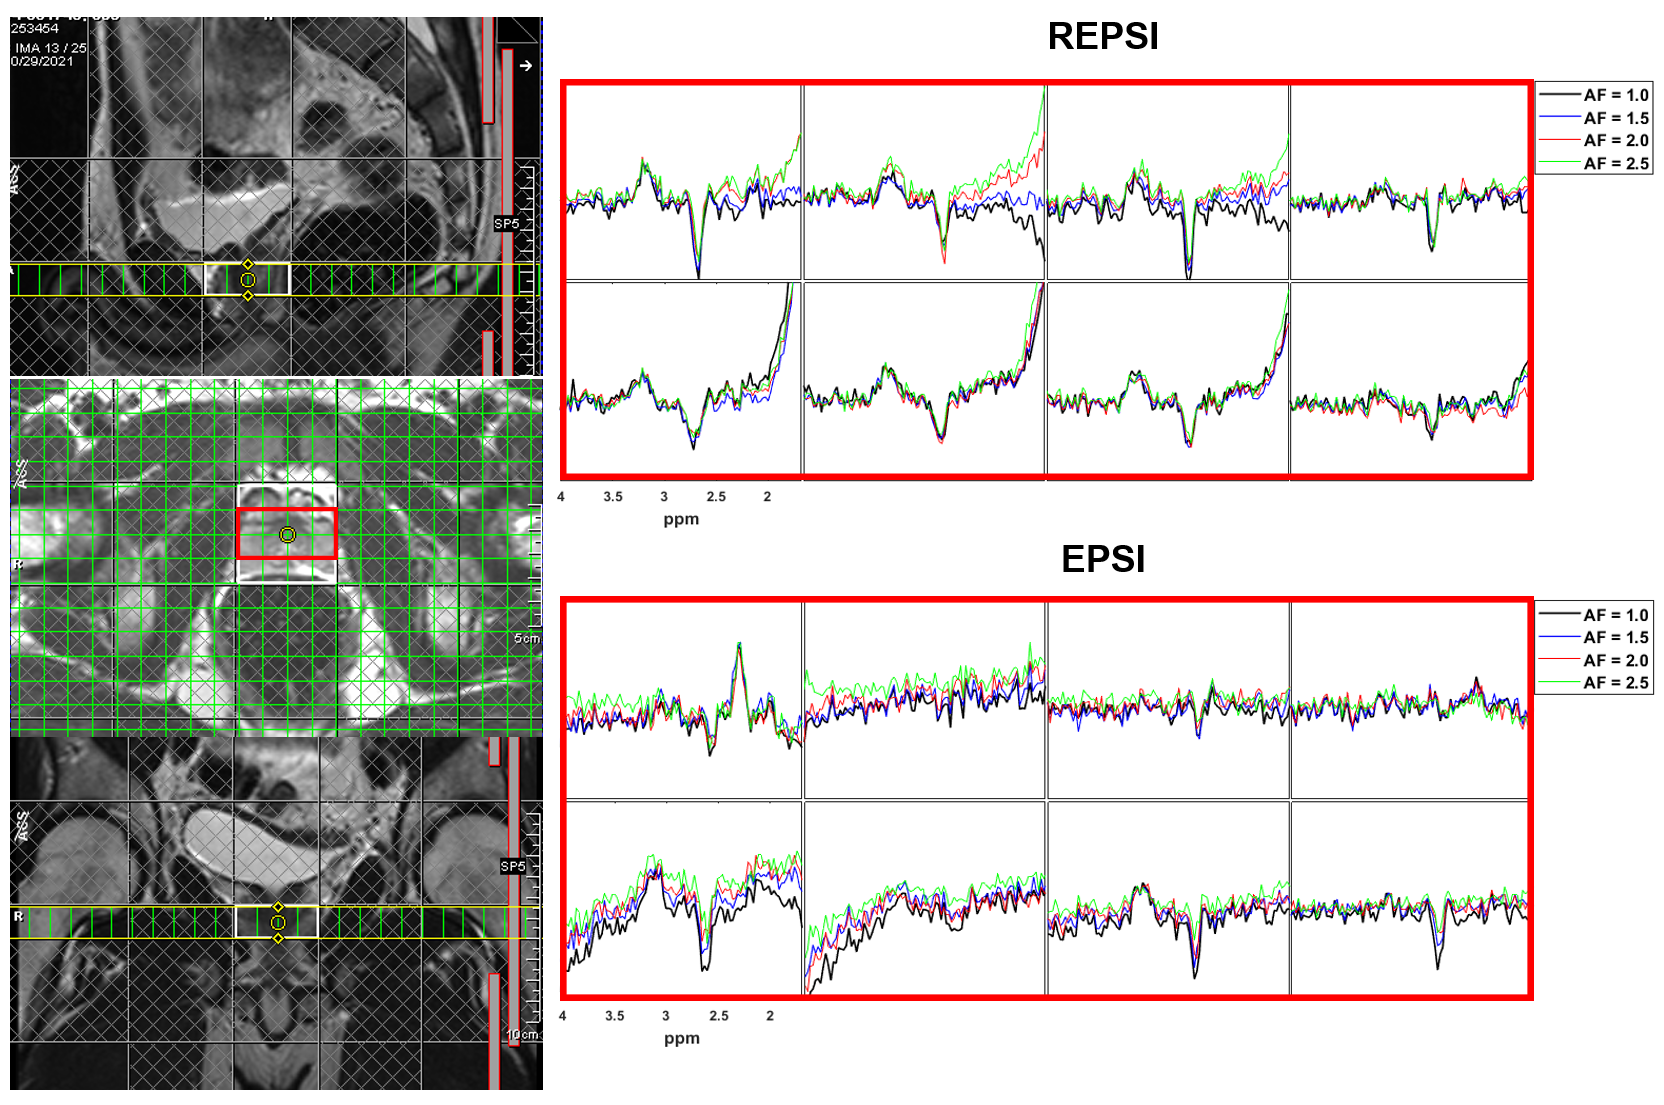
In both the in vivo and prostate phantom experiments, a radial echo planar spectroscopic imaging (REPSI) sequence with semi-LASER volume excitation was used to acquire a 40 × 40 × 15 mm3 volume-of-interest (VoI) within a 320 × 320 mm2 field-of-view, using a 32 × 32 matrix size (1.5 mL voxel volume), a flyback gradient echo train7 (1562.5 Hz spectral width and 512 time points), TE = 100 ms, TR = 1.5 s and 8 averages. No lipid suppression modules were included in the sequence, however, the lipids were removed from the reference water signal in post-processing using HLSVD8 for eddy current phase correction.Fully-sampled Cartesian EPSI and REPSI datasets acquired in three healthy male volunteers were retrospectively undersampled with acceleration factors (AF) of 1.5 (21 ky-lines/spokes), 2 (16 ky-lines/spokes), and 2.5 (13 ky-lines/spokes). An external body coil with a maximum of 30 coils was used for the in vivo acquisitions. At AF = 1.0, time equivalent datasets with 32 ky-lines or spokes were acquired. One prospectively undersampled REPSI dataset was acquired in a fourth volunteer with AF’s of 1.5, 2, and 2.5. Fully-sampled and prospectively undersampled Cartesian EPSI and REPSI datasets (AF’s of 1.5, 2, 2.5) were acquired in a prostate phantom containing choline (Cho), citrate (Cit), creatine (Cr), myo-inositol (mI), and spermine (Spm) at physiological concentrations. All undersampled data was reconstructed with a CS-TV algorithm5. Scan times for AF's of 1, 1.5, 2, and 2.5 were 7 min 30 sec, 5 min, 3 min 45 sec, and 3 min, respectively.
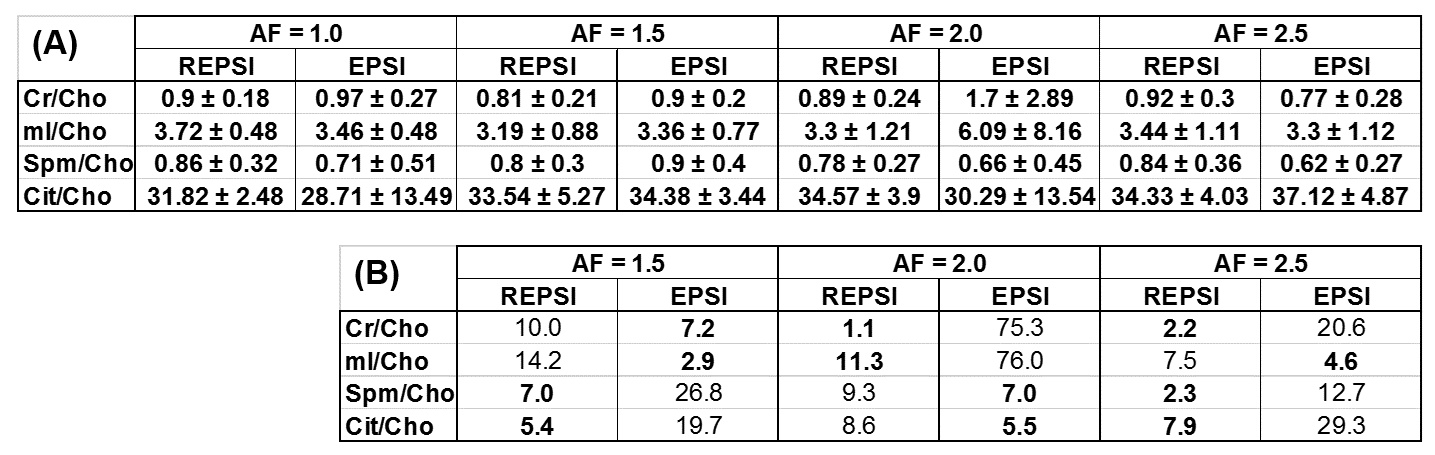
The prostate phantom reconstructions were quantified in LCModel9 using simulated basis sets generated in VESPA10. Ratios with respect to Cho were computed in the prostate phantom and compared as a function of AF, and the percent difference with respect to the fully-sampled Cho ratio was also determined. Citrate maps and multi-voxel spectra were reconstructed in the retrospectively and prospectively undersampled in vivo data sets and were compared qualitatively.
Results & Discussion
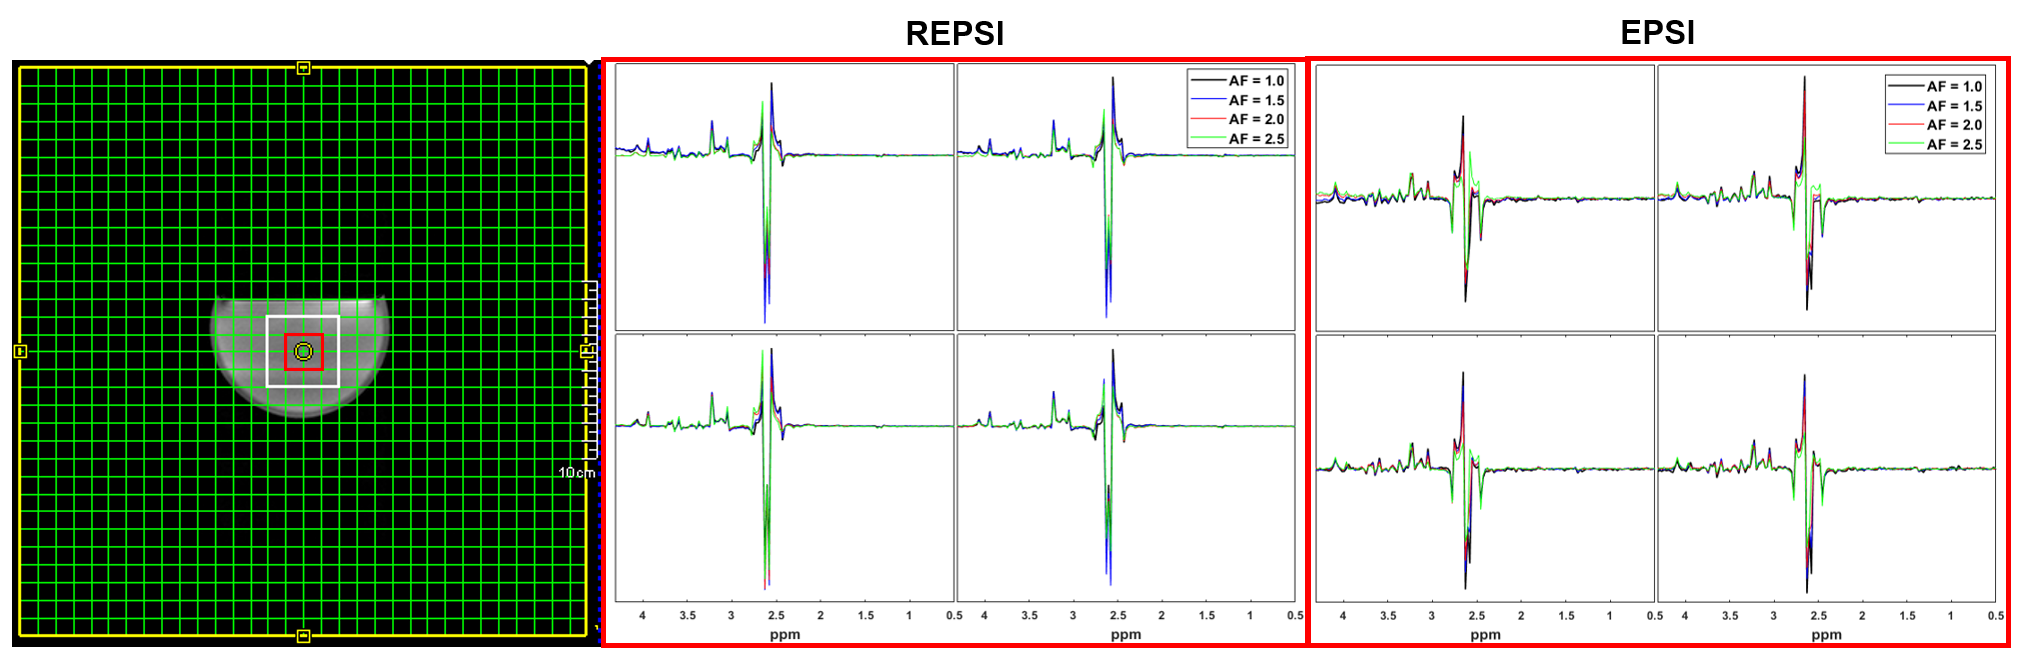
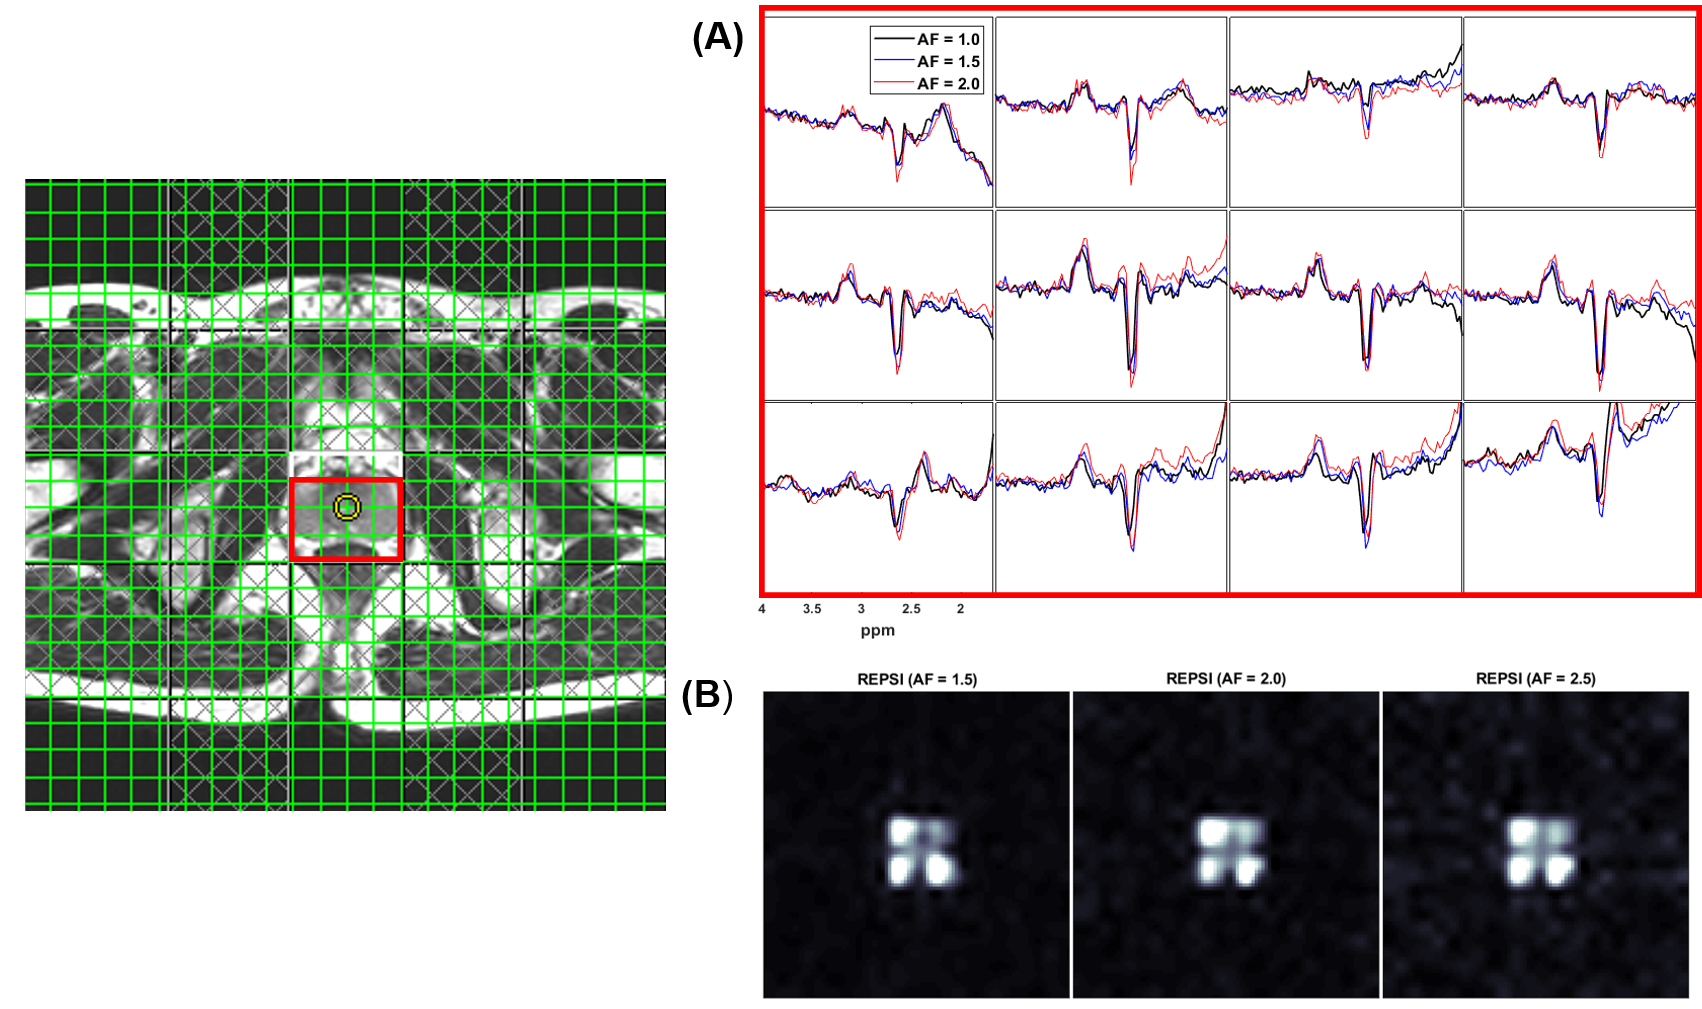
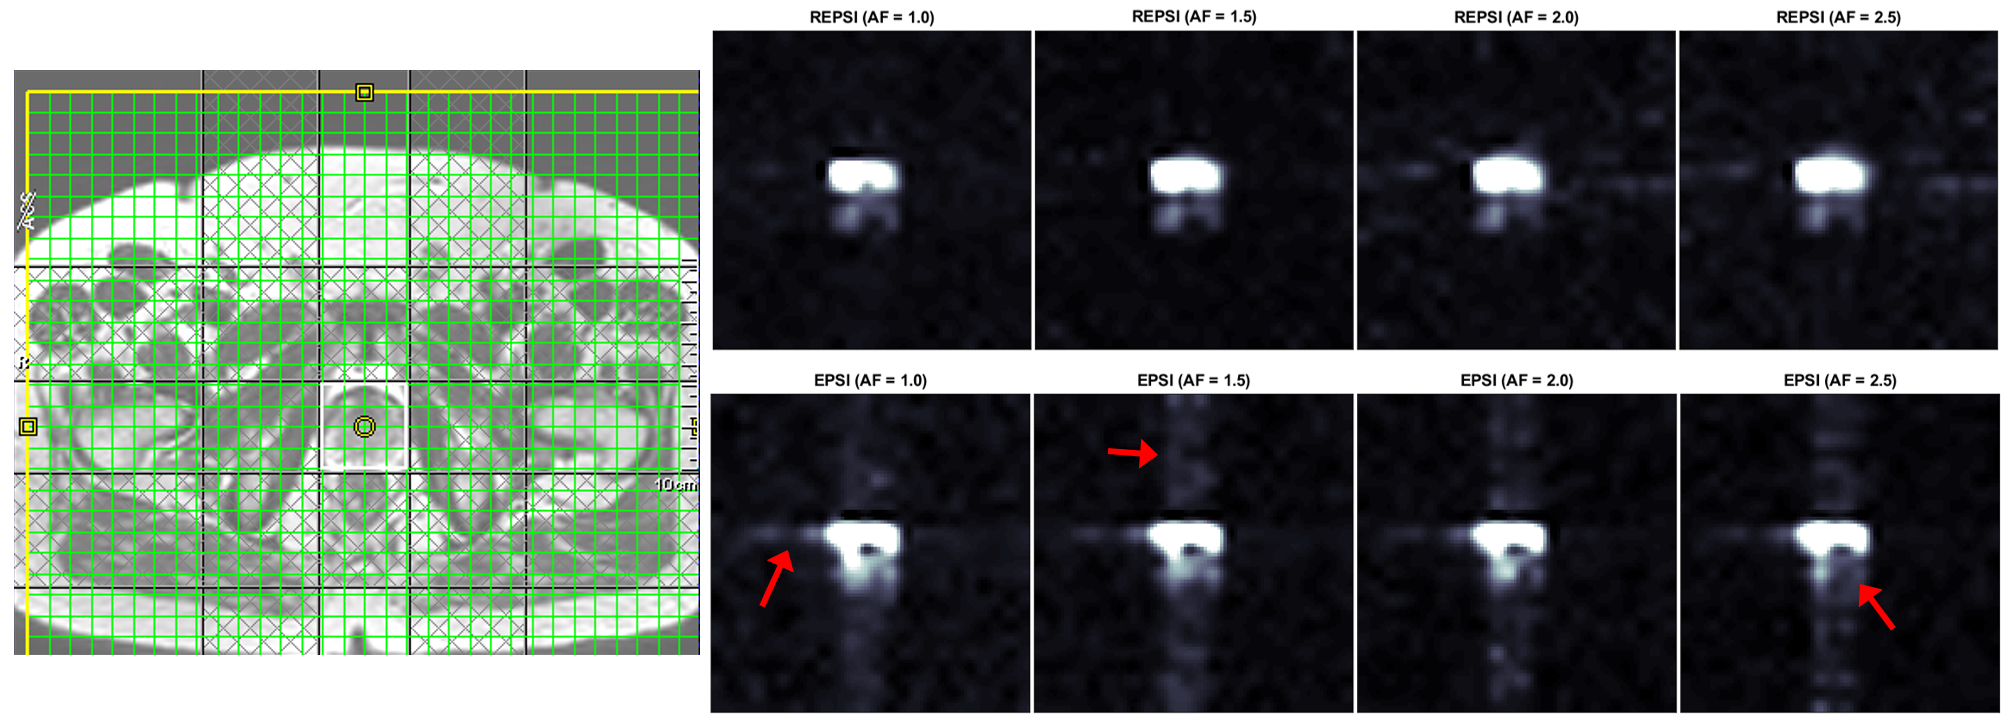
Figure 1 shows that the Cho ratios from prospectively undresampled REPSI acquistions are more consistent with those from the fully-sampled scans, compared to Cartesian EPSI. In a few cases, the percent errors are higher for REPSI but overall this error does not exceed 14%, whereas the percent error from Cartesian EPSI are as high as 76%. Overestimation and underestimation of the Cho ratios (e.g, Cr/Cho ~ 2.0 and Cit/Cho ~ 17) is possibly due to T1 saturation and T2 losses in the phantom.Figure 2 shows good REPSI and EPSI reconstructions from prospectively undersampled data, however the peak intensity decreases less in the REPSI case when AF = 2.0 & 2.5. The in vivo spectra and citrate maps in Figure 4 and Figure 5 also show greater stability in the reconstructions from retrospectively undersampled REPSI, with more benign undersampling artifacts in REPSI. The Cartesian EPSI maps degrade faster as the AF increases, particularly along the phase-encoding dimension, and can be more susceptible artifacts from subject motion. In Figure 3, the spectra and the citrate map in the VoI show good consistency with the fully-sampled results. Even at AF = 2.5, the REPSI citrate maps in Figure 4 and maintains the basic structures in the fully-sampled map, whereas the EPSI map at AF = 2.5 suffers an obvious signal loss in the lower right region.
Conclusion
REPSI can tolerate more acceleration and therefore may be better suited for faster acquisitions in the prostate, in which the anatomy is small compared to the nominal FoV. In the examples shown in the study, the scan time of 2D REPSI can be decreased from 7.5 minutes to 3-3.5 minutes without much loss in spectral quality, demonstrating the potential of reduced FoV MRSI for clinical prostate scans.Acknowledgements
No acknowledgement found.References
1. Basharat M, et al. TE = 32 ms vs TE = 100 ms in Echo-Time 1H Magnetic Resonance Spectroscopy in Prostate: Tumor Metabolite Depiction and Absolute Concentrations in Tumors and Adjacent Tissues. JMRI 2015; 42(4):1086-1093.
2. Basharat M, et al. Evaluation of short-TE 1H MRSI for quantification of metabolites in the prostate. NMR in Biomedicine 2014; 27(4): 459-467.
3. Tayari N, et al. In vivo MR spectroscopic imaging of the prostate, from application to interpretation. Analytical Biochemistry 2017; 529: 158-170.
4. Posse S, Tedeschi G, Risinger R, OggR, Bihan DL. High Speed 1H Spectroscopic Imaging in human brain by echo-planar spatial-spectral encoding. MRM 1995; 33:34-40.
5. Saucedo A, Thomas MA. Accelerated radial echo planar spectroscopic imaging using golden angle view-ordering and compressed sensing reconstruction with total variation regularization. MRM 2021; 86:46-61.
6. Scheffler K, Hennig J. Reduced Circular field-of-view imaging. MRM 1998; 40:474-480.
7. Chen AP, et al. High-speed 3T MR Spectroscopic imaging of prostate with flyback echo-planar encoding. JMRI 2007; 25(6): 1288-1292.
8. Cabanes E, et al. Optimization of residual water removal by HLSVD on stimulated short echo time proton MR spectra of the human brain. JMR 2001; 150(2): 116-125.
9. Provencher SW. Estimation of metabolite concentrations from localized in vivo proton NMR spectra. MRM 1993; 30: 672-679.
10. Soher BJ, et al. VeSPA: integrated applications for RF pulse design, spectral simulation and MRS data analysis. In: Proceedings of the 19th Annual Meeting of the ISMRM, Montreal, Cananda, 2011 - Abstract #1410.
Figures