4055
Effective removal of aliasing artifacts in accelerated echo-planar imaging (EPI) based functional MRI (fMRI)1Biomedical Engineering Department, The University of Arizona, Tucson, AZ, United States, 2Medical Imaging Department, The University of Arizona, Tucson, AZ, United States
Synopsis
An integrated post-processing algorithm has been developed for effectively removing various types of aliasing artifact due to consecutive echo asymmetry, in-plane k-space under-sampling, through-plane acceleration with multi-band (MB) imaging and motion-induced phase variations in EPI based fMRI data. This algorithm uses a novel two-dimensional (2D) coil-signature-based phase-cycled correction method for 2D Nyquist artifact removal without calibration scans, and is capable of simultaneously removing: (1) aliasing artifacts due to in-plane and through-plane acceleration in single-shot and multi-shot EPI; (2) motion-induced phase errors in multi-shot EPI. Experimental results illustrate the effectiveness of the developed method, and its successful application to fMRI studies.
Introduction
EPI is a fast-imaging technique, which reduces acquisition time and minimizes motion artifacts. However, a unique EPI Nyquist artifact caused by the reversal of readout gradient polarities between echoes1, creates a ghost image shifted by half the field of view (FOV), causing difficulties in clinical diagnosis or errors in research analysis.Traditional one-dimensional (1D) corrections2, contain significant residual artifacts, particularly for oblique-plane EPI3 or with cross-term eddy current4. Instead, 2D correction is more effective, using a 2D phase inconsistency map obtained either directly from separately acquired calibration scans5 (requiring additional scan time) or inherently using techniques like phase-cycled reconstruction6. However, current phase-cycled reconstruction requires a relatively large FOV to measure background artifacts6, which may not be feasible for scans under a small FOV and images accelerated with MB or SENSitivity Encoding (SENSE).
To address these limitations, we investigate an inherent 2D coil-signature-based phase-cycled correction technique for 2D Nyquist removal without calibration scans. We further develop an integrated aliasing artifact correction algorithm, which simultaneously removes: (1) 2D Nyquist artifacts, (2) in-plane aliasing artifacts due to k-space under-sampling, (3) through-plane aliasing artifacts due to MB-EPI, and additionally (4) motion-induced shot-to-shot phase inconsistencies in multi-shot EPI.
Methods
Coil-signature-based 2D Phase Cycled ReconstructionIf a 2D Nyquist phase map is known, the Nyquist artifact-free image with N shots can be reconstructed with Eq.1, where $$$S_{j}(x,y)$$$ represents Nyquist artifact-free complex image intensity at coil $$$j$$$. $$$I_{k_{n},j}(x,y)$$$ represents images at coil $$$j$$$ reconstructed using ky lines with the same readout direction and under the same segment.
$$I_{k_{n},j}(x,y)=\frac{1}{2N}\sum_{l=1}^{2N}e^{\frac{i(n-1)(l-1)}{2}}e^{i\theta(x,y+\frac{l}{2N}FOV)\chi_{\theta}}S_{j}(x,y+\frac{l}{2N}FOV) \;\;\; n = 1,2,...,2N \;\;\;\;\; \;\;\;\;\;[Eq.1]$$
where $$$\chi_{\theta}$$$ is an indicator function, which exists if images $$$I_ {k_{n},j}(x,y)$$$ were reconstructed with the same readout direction:
$$\chi_{\theta}=\begin{cases}0 & n \leq N \\ 1 & n > N\end{cases}$$
To determine a 2D Nyquist phase map, we would generate possible phase values using Eq.2 and perform correction in both the frequency-encoding ($$$C_{0}$$$ was cycled between $$$-\pi$$$ and $$$\pi$$$) and the phase-encoding direction ($$$C_{1}$$$ was cycled between $$$-\pi$$$ and $$$\pi$$$ ) using Eq.1. For each cycled phase value, a coil sensitivity profile generated from corresponding corrected complex images was compared with the Nyquist artifact-free coil sensitivity profile.
$$\theta(x,y) = C_{0}(x,y) + C_{1}\times{y} \;\;\;\;\; \;\;\;\;\;[Eq.2]$$
Motion-induced phase error between shots can be corrected using multiplexed sensitivity-encoding (MUSE) reconstruction7. With a 2D Nyquist phase map, we solved for the mth-shot unaliased parent image $$$p_{shot-m}(x,y)$$$ with the unaliased coil sensitivity profile $$$K_{j}$$$ using Eq.3 and calculated the motion-induced phase error $$$\psi_{m}(x,y)$$$ using Eq.4.
$$I_{k_{n},j}(x,y)=\frac{1}{2N}\sum_{l=1}^{2N}e^{\frac{i(n-1)(l-1)}{2}}e^{i\theta(x,y+\frac{l}{2N}FOV)\chi_{\theta}}K_{j}(x,y+\frac{l}{2N}FOV)p_{shot-m}(x,y+\frac{l}{2N}FOV) \;\;\; n = 1,2,...,2N \;\;\;\;\; \;\;\;\;\;[Eq.3]$$
$$e^{i\psi_{m}(x,y)}=\frac{p_{shot-m}(x,y)}{p_{shot-1}(x,y)} \;\;\;\;\; \;\;\;\;\;[Eq.4]$$
Then $$$\psi_{m}(x,y)$$$ was associated with the corresponding mth-shot image to remove motion artifacts in Eq.5,
$$I_{k_{n},j}(x,y)=\frac{1}{2N}\sum_{l=1}^{2N}e^{\frac{i(n-1)(l-1)}{2}}e^{i\theta(x,y+\frac{l}{2N}FOV)\chi_{\theta}}e^{i\psi_{m}(x,y+\frac{l}{2N}FOV)}K_{j}(x,y+\frac{l}{2N}FOV)p_{shot-m}(x,y+\frac{l}{2N}FOV) \;\;\; n = 1,2,...,2N \;\;\;\;\; \;\;\;\;\;[Eq.5]$$
where $$$m=\begin{cases}n & n \leq N \\n-N & n > N\end{cases}$$$
Application: functional connectivity
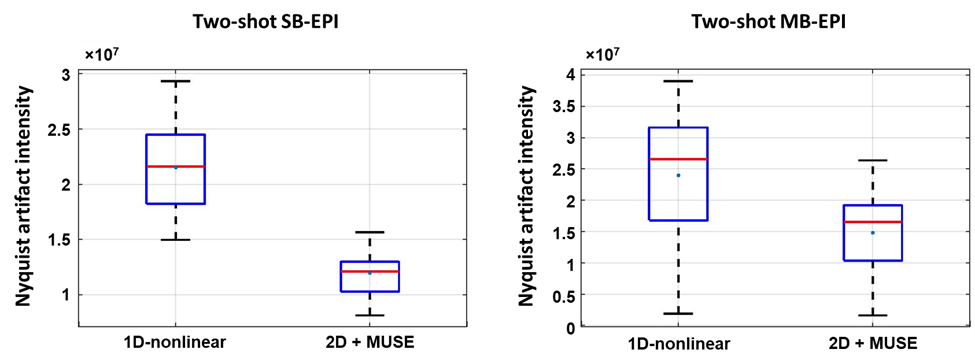
Human brain single-band EPI (SB-EPI) and MB-EPI data (accelerator factor of 2) of two segments were obtained from 30 healthy volunteers (with mean age of 57.5±8.9) at 3T GE scanner. The acquired raw data underwent Nyquist artifact correction using conventional 1D-nonlinear phase correction and our proposed 2D coil-signature-based phase-cycled correction with MUSE. Residual artifacts were evaluated using background ghost level, ghost to signal ratio (GSR) and standard deviation map.
Functional connectivity maps were computed to evaluate activation in areas affected by residual aliasing artifact. Corrected images were preprocessed using FSL8, fMRIPREP9 and CONN functional connectivity toolbox10. In our studies, we used Seed-Based Connectivity, selecting medial prefrontal cortex (MPFC) in default mode network, to measure and inspect functionally connected voxels.
Results and Discussion
Figure 1(A1, A2) shows corrected SB-EPI using two reconstruction methods, respectively. Corresponding standard deviation map is shown in Figure 1 (A3, A4), respectively. Figure 1(B1, B2) shows corrected MB-EPI using two reconstruction methods, respectively. Corresponding standard deviation map is shown in Figure 1 (B3, B4), respectively. With 1D correction, residual artifact (yellow arrows) remains significant.Figure 2 shows that less residual artifact remains using our method. The GSR is 0.12 and 0.07 for SB-EPI corrected with 1D correction and our method, respectively. For MB-EPI, the GSR is 0.11 and 0.07 with 1D correction and our method, respectively.
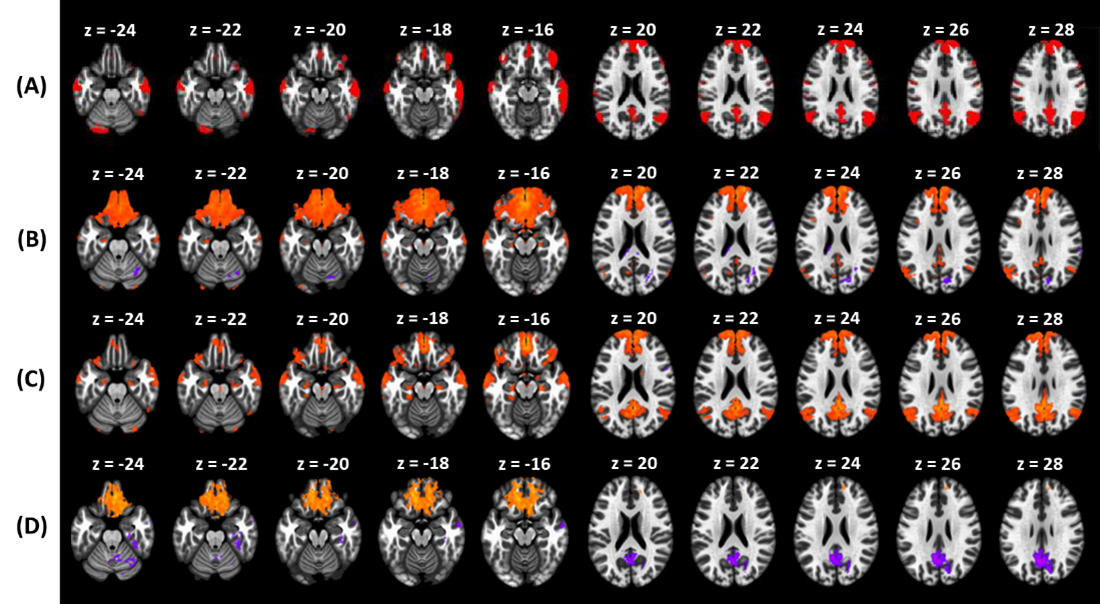
Figure 3 and Figure 4 shows connectivity map for SB-EPI and MB-EPI, respectively. Compared to Figure 3(A), we can observe in Figure 3(B) false-positive activation in subcallosal cortex and frontal medial cortex (from z = -24 to z = -16), and false-negative activation in precuneous cortex (from z = 20 to z = 28), indicating that residual aliasing artifacts after 1D correction causes error in distinguishing true activations. Figure 4, from top to bottom, shows group ICA maps from the Human Connectome Project, connectivity map for MB-EPI corrected with 1D correction, with our method, and F-statistics difference map (1D-nonlinear > 2D MUSE). In Figure 4(B), we can observe false-positive activation in subcallosal cortex and frontal medial cortex (from z = -24 to z = -16).
Conclusions
We have developed an aliasing-artifact correction algorithm, integrated with a novel inherent 2D coil-signature-based phase cycled correction technique, and proved that it can successfully reduce aliasing artifacts due to echo inconsistencies, in-plane and through-plane accelerations, and motion-induced shot-to-shot phase inconsistencies. Out experimental results in fMRI studies have illustrated a large improvement in Nyquist ghost levels and more accurate functional activation maps.Acknowledgements
No acknowledgement found.References
1. Schmitt, F., Stehling, M., Turner, R. and Mansfield, P. (2013). Echo-Planar Imaging. Berlin: Springer Berlin.
2. Bruder, H., Fischer, H., Reinfelder, H., & Schmitt, F. (1992). Image reconstruction for echo planar imaging with nonequidistantk-space sampling. Magnetic Resonance in Medicine, 23(2), 311-323.
3. Reeder, S., Atalar, E., Faranesh, A. and McVeigh, E. (1999). Referenceless interleaved echo-planar imaging. Magnetic Resonance in Medicine, 41(1), pp.87-94.
4. Grieve, S., Blamire, A. and Styles, P. (2002). Elimination of Nyquist ghosting caused by read-out to phase-encode gradient cross-terms in EPI. Magnetic Resonance in Medicine, 47(2), pp.337-343.
5. Xu, D., King, K., Zur, Y. and Hinks, R. (2010). Robust 2D phase correction for echo planar imaging under a tight field-of-view. Magnetic Resonance in Medicine, 64(6), pp.1800-1813.
6. Chen, N., Avram, A. and Song, A. (2011). Two-dimensional phase cycled reconstruction for inherent correction of echo-planar imaging nyquist artifacts. Magnetic Resonance in Medicine, 66(4), pp.1057-1066.
7. Chen, N. K., Guidon, A., Chang, H. C., & Song, A. W. (2013). A robust multi-shot scan strategy for high-resolution diffusion weighted MRI enabled by multiplexed sensitivity-encoding (MUSE). NeuroImage, 72, 41–47.
8. Jenkinson, M., Beckmann, C. F., Behrens, T. E., Woolrich, M. W., & Smith, S. M. (2012). Fsl. Neuroimage, 62(2), 782-790.)
9. Esteban, O., Markiewicz, C. J., Blair, R. W., Moodie, C. A., Isik, A. I., Erramuzpe, A., ... & Gorgolewski, K. J. (2019). fMRIPrep: a robust preprocessing pipeline for functional MRI. Nature methods, 16(1), 111-116
10. Whitfield-Gabrieli, S., & Nieto-Castanon, A. (2012). Conn: a functional connectivity toolbox for correlated and anticorrelated brain networks. Brain connectivity, 2(3), 125-141.
Figures