4049
ASL with Partial Separability to Incorporate SVD Denoising into the Reconstruction Algorithm1Bioengineering, University of Illinois Urbana-Champaign, Urbana, IL, United States
Synopsis
ASL methods result in low SNR. SVD denoising can be used to increase the temporal SNR of ASL data by throwing out the low energy singular values. The SVD can be done after a standard reconstruction, or as we show here during the reconstruction if partial separability is used. The incorporation of the SVD into the reconstruction algorithm allows for a higher tSNR within the gray matter. It also paves the path for future work in which subsampling the data results in higher temporal and spatial resolution ASL.
Introduction
ASL has a low temporal SNR (tSNR), limiting its potential for high spatial and temporal resolution imaging. From a singular value decomposition (SVD) of perfusion data, it becomes apparent that the low rank components corresponding to the large singular values contain the perfusion information, and the high rank components corresponding to the lower energy singular values consist mainly of noise. Denoising utilizing SVD can be accomplished in several ways, first, retrospectively by taking the standard ASL reconstruction and removing the lower energy singular values. Second, using the partial separability (PS) model, the SVD can be built into the reconstruction algorithm. This allows for more complicated sampling patterns including subsampling of the data1.The PS model acquisition works by sampling a temporal navigator signal interleaved with an imaging data acquisition. The right singular vectors (RSVs) of the navigator, a signal with a high temporal resolution and low spatial resolution, is used as the estimate of the temporal signals in the data. To estimate the spatial maps for those components, the conjugate gradient algorithm is used to fit the SVD reconstruction to the high spatial resolution data collected, as has been done with BOLD fMRI2 and speech imaging3,4.Methods
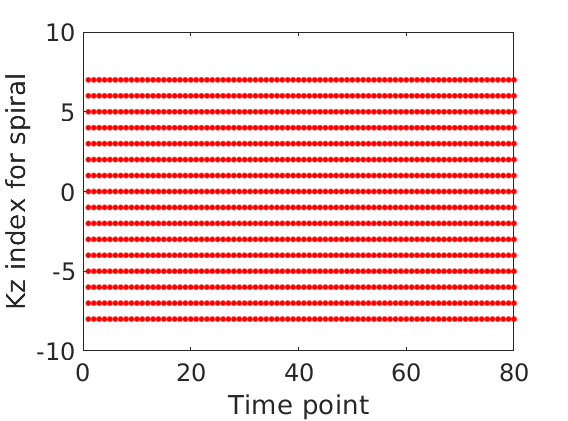
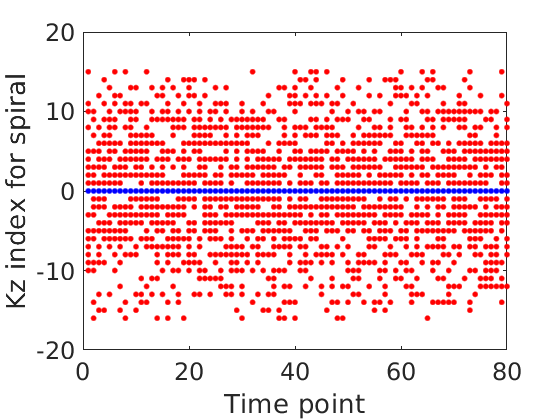
A 3D stack of spirals was used for a FAIR PASL 3D acquisition of imaging data combined with a short 3D spiral for the temporal navigator. The nonuniform fast Fourier transform algorithm was used to accommodate the non-uniform sampling in the frequency domain in the reconstruction5. The data consisted of 16 spirals, each spiral corresponding to a point in the Kz axis as shown in Figure 1, fully sampling k-space. The voxel sizes were 3.8x3.8x6mm, the image dimensions were 64x64x16, and the TR was 5 seconds. 40 tag-control pairs were taken. The first pair did not include background suppression for calibration purposes, and the last 39 did include background suppression. Data were reconstructed in two ways: 1. Standard reconstruction with conjugate gradient method applied to the k-space data of each volume. 2. PS model reconstruction for the entire time series at once. The singular value decomposition of the navigator data was taken, and a conjugate gradient algorithm was used to fit the spatial basis to the data using the temporal basis from the navigator according to the PS model equation:$$c_l(k)=arg\min_{c_l(k)}||s(k,t)-\sum_{l=1}^Lc_l(k)\rho_l(t)||^2$$
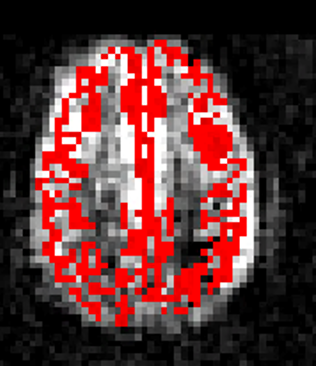
where $$$L$$$ is the rank of the reconstruction, $$$t$$$ is the time point (tag/control), $$$c_l(k)$$$ is the estimated spatial basis (principal components including singular values), $$$s(k,t)$$$ is the acquired data, and $$$\rho_l(t)$$$ is the estimated temporal basis (RSVs of the navigator data). For the PS reconstruction, 9 iterations were taken with a rank of 10 to reconstruct all time points together. For the standard reconstruction, 10 iterations of the conjugate gradient algorithm were used to reconstruct each time point volume. The perfusion images were acquired by pairwise subtraction of the last 39 of the tag-control pairs and were thresholded at zero signal. The tSNR measurements were found by pixel-wise averaging of the perfusion signal across time divided by the standard deviation of the perfusion signal across time. The gray matter tSNR measurements were computed by first manually brain extracting with the sensitivity maps as the template, then using the gray matter partial volume as found with FSL6 thresholded at 0.5 to segment gray matter voxels in the tSNR maps which were used for the calculation. An example of a segmented slice is shown in Figure 2.
Results
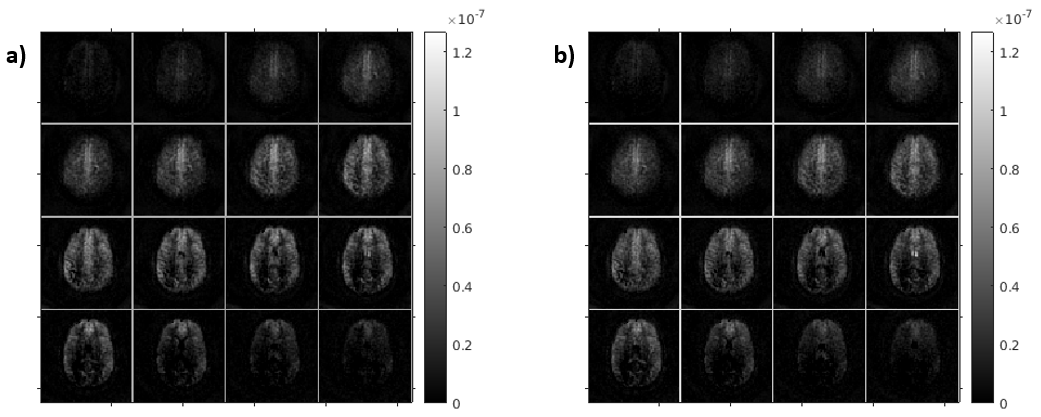
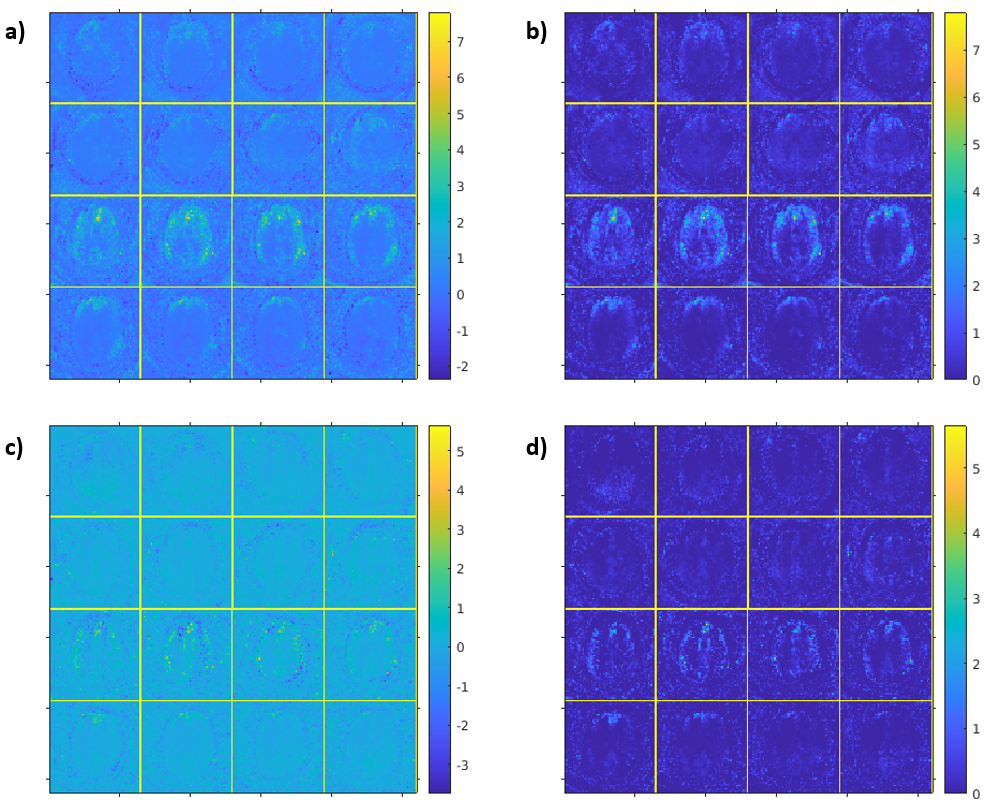
The perfusion images resulting from the reconstruction are shown in Figure 3 for both the PS reconstruction and the standard reconstruction, with the standard reconstruction being based on an ASL consensus paper7.The temporal signal to noise ratio (tSNR) was compared for the PS reconstruction and the standard reconstruction (Figure 4a,b), and between the PS reconstruction and the standard reconstruction with post processing SVD denoising (Figure 4c,d). The gray matter tSNR measurements were 1.56 with standard deviation 1.34, 0.89 with standard deviation 0.62, and 1.34 with standard deviation 1.24 for the PS reconstruction, standard reconstruction, and standard reconstruction with SVD denoising, respectively.Discussion
From the tSNR comparisons, the use of the SVD to remove noise improves the tSNR of the standard reconstruction when applied after reconstructing the image. Further, when incorporated into the PS model, the low rank reconstruction can provide further improvements in tSNR in the gray matter. The tSNR may be slightly higher in the PS reconstruction because the model restriction improves the conditioning of the reconstruction problem for the PS model over individual reconstructions of each image in the standard approach. Future work will include subsampling the data, allowing for an increased temporal and spatial resolution. An example of a subsampling data acquisition is shown in Figure 5.Conclusion
The PS model allows for the SVD denoising to be built into the reconstruction algorithm. This improves the tSNR of the ASL data even over retrospectively applied SVD after a standard reconstruction. Future work should show that this allows for subsampling of the data, and increased temporal and spatial resolution.Acknowledgements
This work was supported by the Miniature Brain Machinery Fellowship, training grant number NSF 1735252References
1. Liang ZP. Spatiotemporal imaging with partially separable functions. International Symposium on Biomedical Imaging 2007. p. 988-91.
2. Ngo GC, Holtrop JL, Fu M, Lam F, Sutton BP. High temporal resolution functional MRI with partial separability model. Conf Proc IEEE Eng Med Biol Soc. 2015; 2015:7482-5.
3. Fu M, Zhao B, Carignan C, Shosted RK, Perry JL, Kuehn DP, Liang ZP, Sutton BP. High-Resolution Dynamic Speech Imaging with Joint Low-Rank and Sparsity Constraints. Magn Reason Med. 2015.
4. Fu M, Barlaz MS, Holtrop JL, Perry JL, Kuehn DP, Shosted RK, Liang ZP, Sutton BP. High-Resolution Dynamic Speech Imaging with Joint Low-Rank and Sparsity Constraints. Magn Reason Med. 2015.
5. Fessler JA, Sutton BP. Nonuniform Fast Fourier Transforms Using Min-Max Interpolation. IEEE Trans. Signal Process. 2003
6. Zhang, Y. and Brady, M. and Smith, S. Segmentation of brain MR images through a hidden Markov random field model and the expectation-maximization algorithm. IEEE Trans Med Imag, 20(1):45-57, 2001.
7. Alsop DC et al. Recommended implementation of arterial spin label perfusion MRI clinical applications: A consensus of the ISMRM perfusion study group and the European consortium for ASL in dementia. Magn Reason Med. 2015
Figures