4048
Deep Learning for under-sampled non-cartesian ASL MRI reconstruction1Computer Science, State University of New York at Binghamton, Binghamton, NY, United States, 2Zhejiang University, Hangzhou, China, 3Beth Israel Deaconess Medical Center and Harvard Medical School, Boston, MA, United States
Synopsis
Compressed sensing allowed speeding up MRI image acquisition by several folds but with increased reconstruction time. Deep-learning was introduced for fast reconstruction with comparable or improved reconstruction quality. However, its applications on non-cartesian grids are scarce, mostly based on simulated resampling from original Cartesian grids. Here, we evaluated the performance of two deep-learning networks for reconstructing images acquired with k-space spiral trajectories in real MRI scanning. We demonstrated that deep learning networks can successfully reconstruct high-resolution images from under-sampled spiral trajectories with half of data in k-space and their performance is robust to spiral trajectories different from training.
Introduction
The theory of compressed sensing 1 allowed time reduction in MRI image acquisition by several folds but increased time for image reconstruction. Deep learning (DL) has recently been introduced 2,3 to allow for fast reconstruction with comparable or improved image quality compared to traditional iterative reconstructions. However, these DL reconstructions are mainly concentrated on Cartesian k-space trajectories. Recent deep learning-based non-cartesian MRI data reconstruction methods are based on simulated non-cartesian resampling from an original Cartesian grid in k-space 4,5. The simulated non-cartesian sampling may not mimic the non-cartesian MRI data from the real MRI scanning because it does not take into account the noise distribution, gradient inaccuracies, or B0-field inhomogeneities. Here, we evaluated the performance of two deep learning networks on reconstructing the image acquired with one spiral trajectory in k-space, which is an under-sampled k-space (using half of the acquisition time) because 2-interleave spiral trajectories in k-space satisfy the Nyquist sampling rate.Method
The 3D dynamic Arterial Spin Labeling (dASL) images were acquired on a 3 Tesla GE MR750 scanner using 32-channel receive-only phased array coil at 50 time points from 21 healthy subjects for a different project 6. At each time point, ASL images were acquired with two spiral interleaves (uniform density spirals, 2048 points on each spiral, bandwidth of 125 kHz), which were reconstructed using non-uniform FFT (NUFFT) 7 to serve as ground-truth images. ASL images were also reconstructed separately from the first (1st single-spiral image) and second spiral interleave (2nd single-spiral image) using NUFFT to serve as under-sampled images.We built a U-shaped convolutional neural network (CNN) (U-Net, Fig. 1) with skip connections between the encoding and decoding layers to learn the process of generating two-spiral target images from one-spiral input images. The images from the first spiral trajectory and those from two spiral trajectories were used in the training as the input and target of the U-Net. Furthermore, a conditional generative network (cGAN) was used to enhance the learning. The same U-Net as in Fig. 1 was used as the generator (Fig. 2, Left) and one more CNN was used as the discriminator with binary output to distinguish the fake and real input pairs (Fig. 2, Right). The input and target images for the generator were the same as those used in the U-Net. The input images for the discriminator are the ground-truth and output images from the generator. Three different loss functions (L1-loss, L2-loss, and SSIM-loss) were used in the U-Net separately, while SSIM-loss was used in the cGAN. Five-fold cross validation (17 subjects for training and 4 subjects for testing at each time) was used to evaluate the performance of the reconstructed images. The images from 2nd single-spirals were used in the testing only. The performance of each deep-learning method was evaluated by calculating a peak signal-to-noise ratio (PSNR), mean squared error (MSE) and Structural Similarity Index (SSIM) of reconstructed test images by comparing with their corresponding ground-truth images.
Results & Discussion
For U-Net, the learned images from 1st single-spiral test image (Fig. 3a) with the ground-truth two-spiral image (Fig. 3b), are shown from different loss functions: L1-loss (Fig. 3c), L2-loss (Fig. 3d) and SSIM-loss (Fig. 3e). The results demonstrate that the U-Net can reconstruct high-resolution images from half-time under-sampled low-resolution images successfully, and the background noises in the ground-truth image are minimized in the process. The learned images from a 2nd spiral test image are shown in the second row of Fig. 3(f-j). The U-Net, which was trained on 1st single-spiral images, can reach similar performance on the unseen 2nd single-spiral images. The PSNR, MSE and SSIM calculated from learned high-resolution images from 1st single-spiral test images and 2nd single-spiral test images are shown in the Table 1. For the comparison, the PSNR, MSE and SSIM of the low-resolution single-spiral test images are also shown in Table 1. The metrics indicate that the U-Net with SSIM-loss performs slightly better than the L1-loss and L2-loss[MOU1] but does not reach statistical significance. The learned images from cGAN is shown in Fig. 5. cGAN can improve the image quality of the low-resolution image but it also preserves both brain and background noises. [MOU1]Here, we need some figure to support the superior performance of SSIM loss by an image (e.g., the local SSIM map as we discussed) because I cannot see clear difference from the images that you have showed.Conclusion
Deep-learning models, both U-Net and cGAN are promising in reconstructing high-resolution images from under-sampled spiral images. This study serves as a starting point of deep learning-based reconstructions on non-cartesian trajectories. Further studies will focus on directly applying the deep learning networks to reconstruct images from the k-space with non-cartesian grids and larger under-sampling factors and how the reconstruction method affects group comparison results.Acknowledgements
No acknowledgement found.References
1. Lustig M, Donoho D, Pauly JM. Sparse MRI: The application of compressed sensing for rapid MR imaging. Magn Reson Med. 2007;58(6):1182-95. Epub 2007/10/31. doi: 10.1002/mrm.21391. PubMed PMID: 17969013.2. Schlemper J, Caballero J, Hajnal JV, Price AN, Rueckert D. A Deep Cascade of Convolutional Neural Networks for Dynamic MR Image Reconstruction. IEEE Trans Med Imaging. 2018;37(2):491-503. Epub 2017/10/17. doi: 10.1109/TMI.2017.2760978. PubMed PMID: 29035212.
3. Zhu B, Liu JZ, Cauley SF, Rosen BR, Rosen MS. Image reconstruction by domain-transform manifold learning. Nature. 2018;555(7697):487-92. Epub 2018/03/23. doi: 10.1038/nature25988. PubMed PMID: 29565357.
4. Ramzi Z, Ciuciu P, Starck J-L. Density compensated unrolled networks for non-Cartesian MRI reconstruction. 18th IEEE International Symposium on Biomedical Imaging (ISBI). 2021.
5. Han Y, Ye JC. Non-Cartesian k-space Deep Learning for Accelerated MRI. The 27th ISMRM Proceeding. 2019.
6. Zhang Z, Luh WM, Duan W, Zhou TD, Zhao L, Weinschenk G, Anderson AK, Dai W. The Longitudinal Effect of Meditation on Resting-State Functional Connectivity Using Dynamic Arterial Spin Labeling: A Feasibility Study. Brain Sci. 2021;11(10). Epub 2021/10/24. doi: 10.3390/brainsci11101263. PubMed PMID: 34679328; PMCID: PMC8533789.
7. Fessler JA. Nonuniform Fast Fourier Transforms Using Min-Max Interpolation. IEEE Trans Signal Processing. 2003;51(2):560-74.
Figures
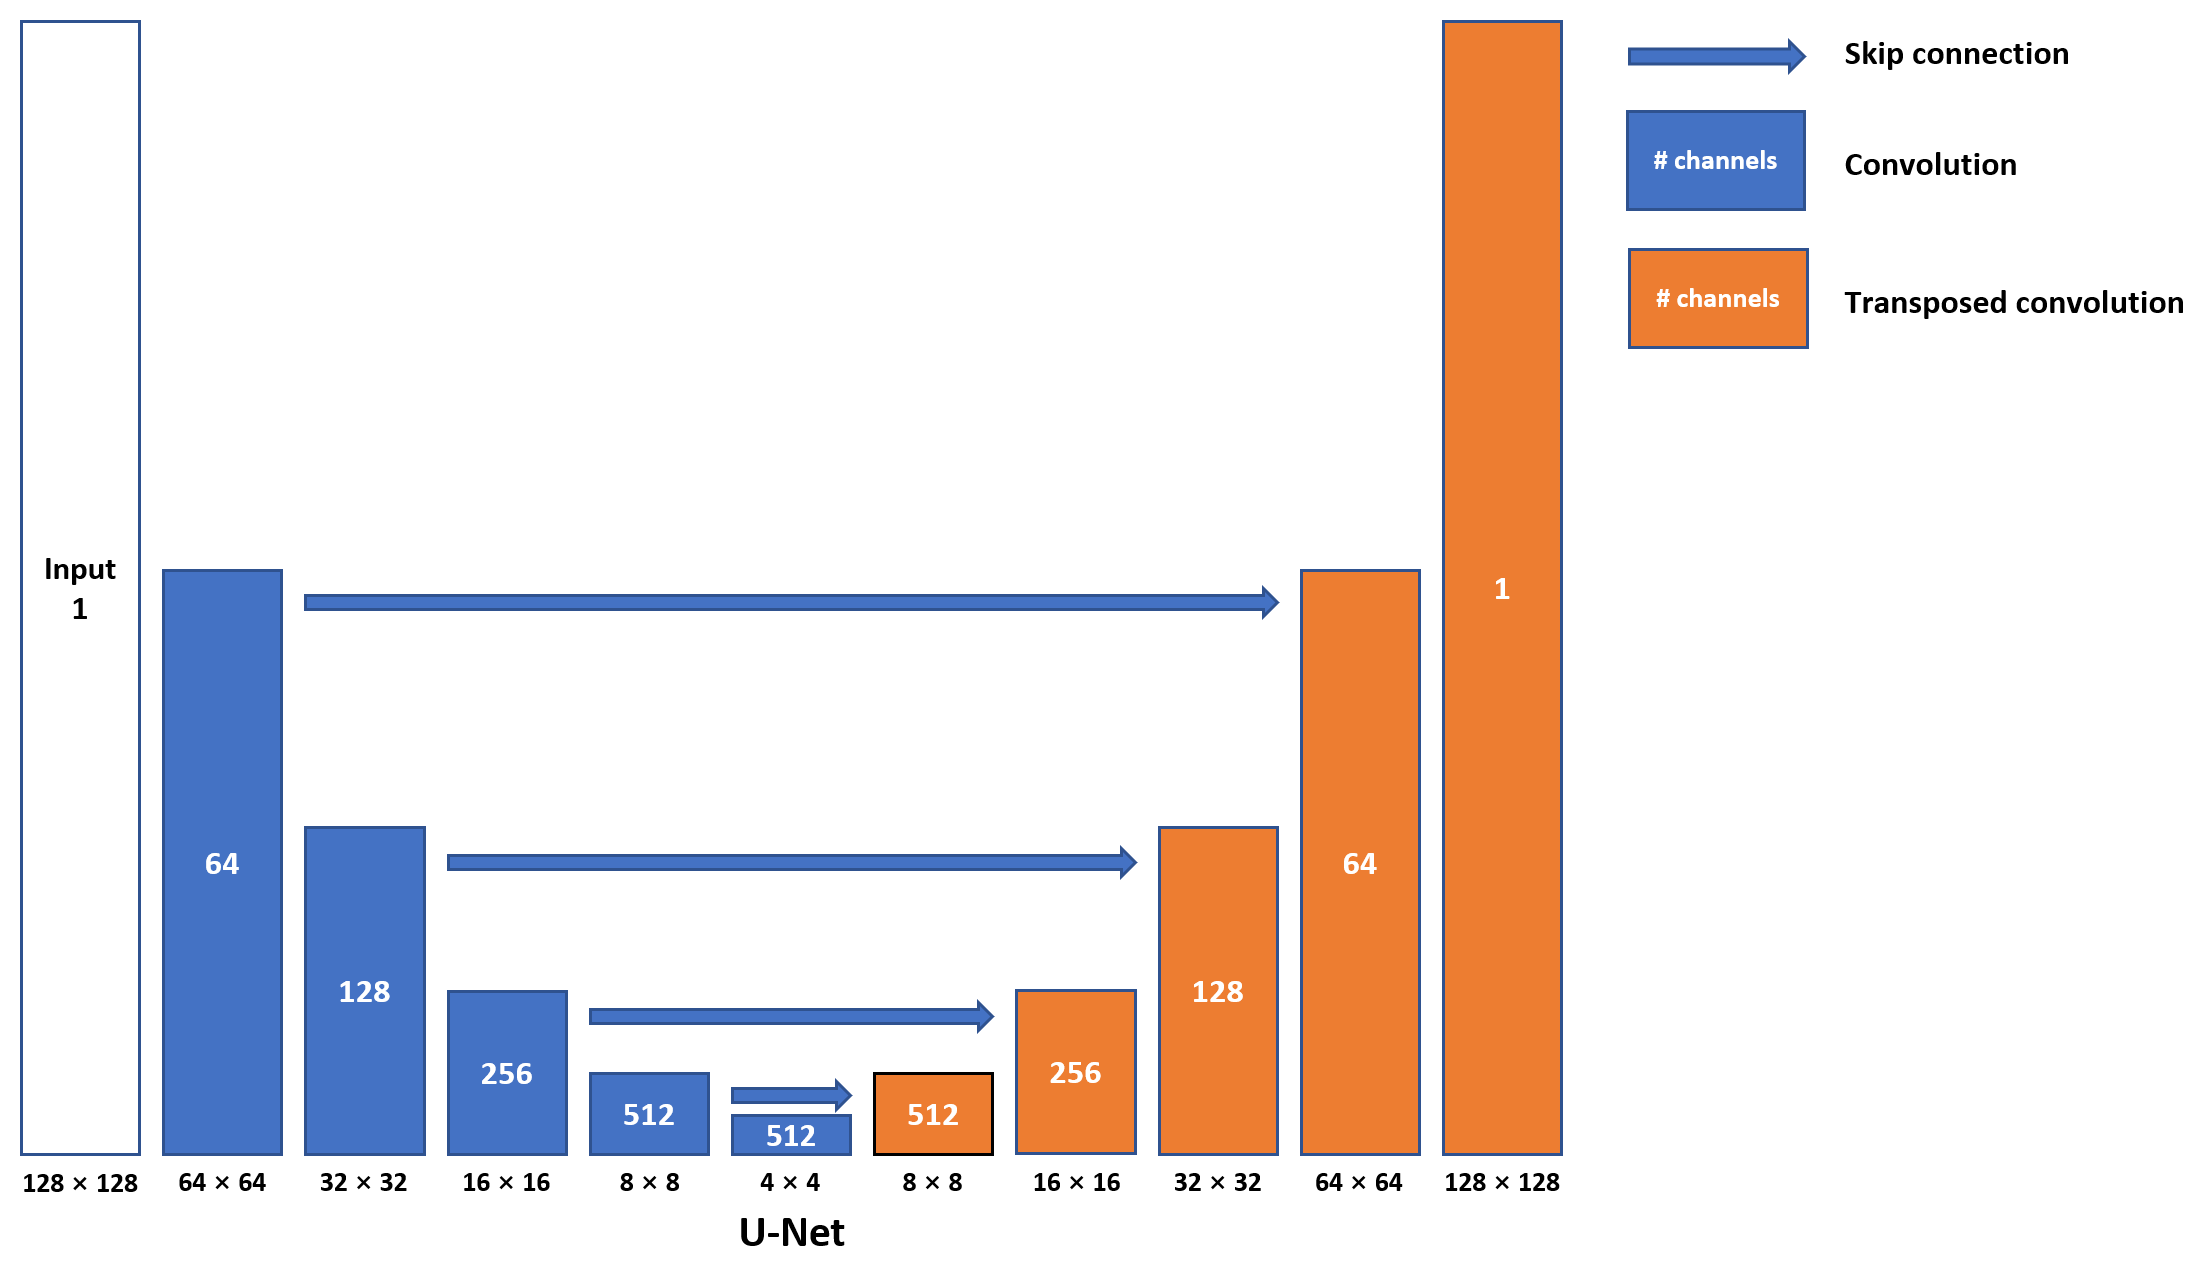
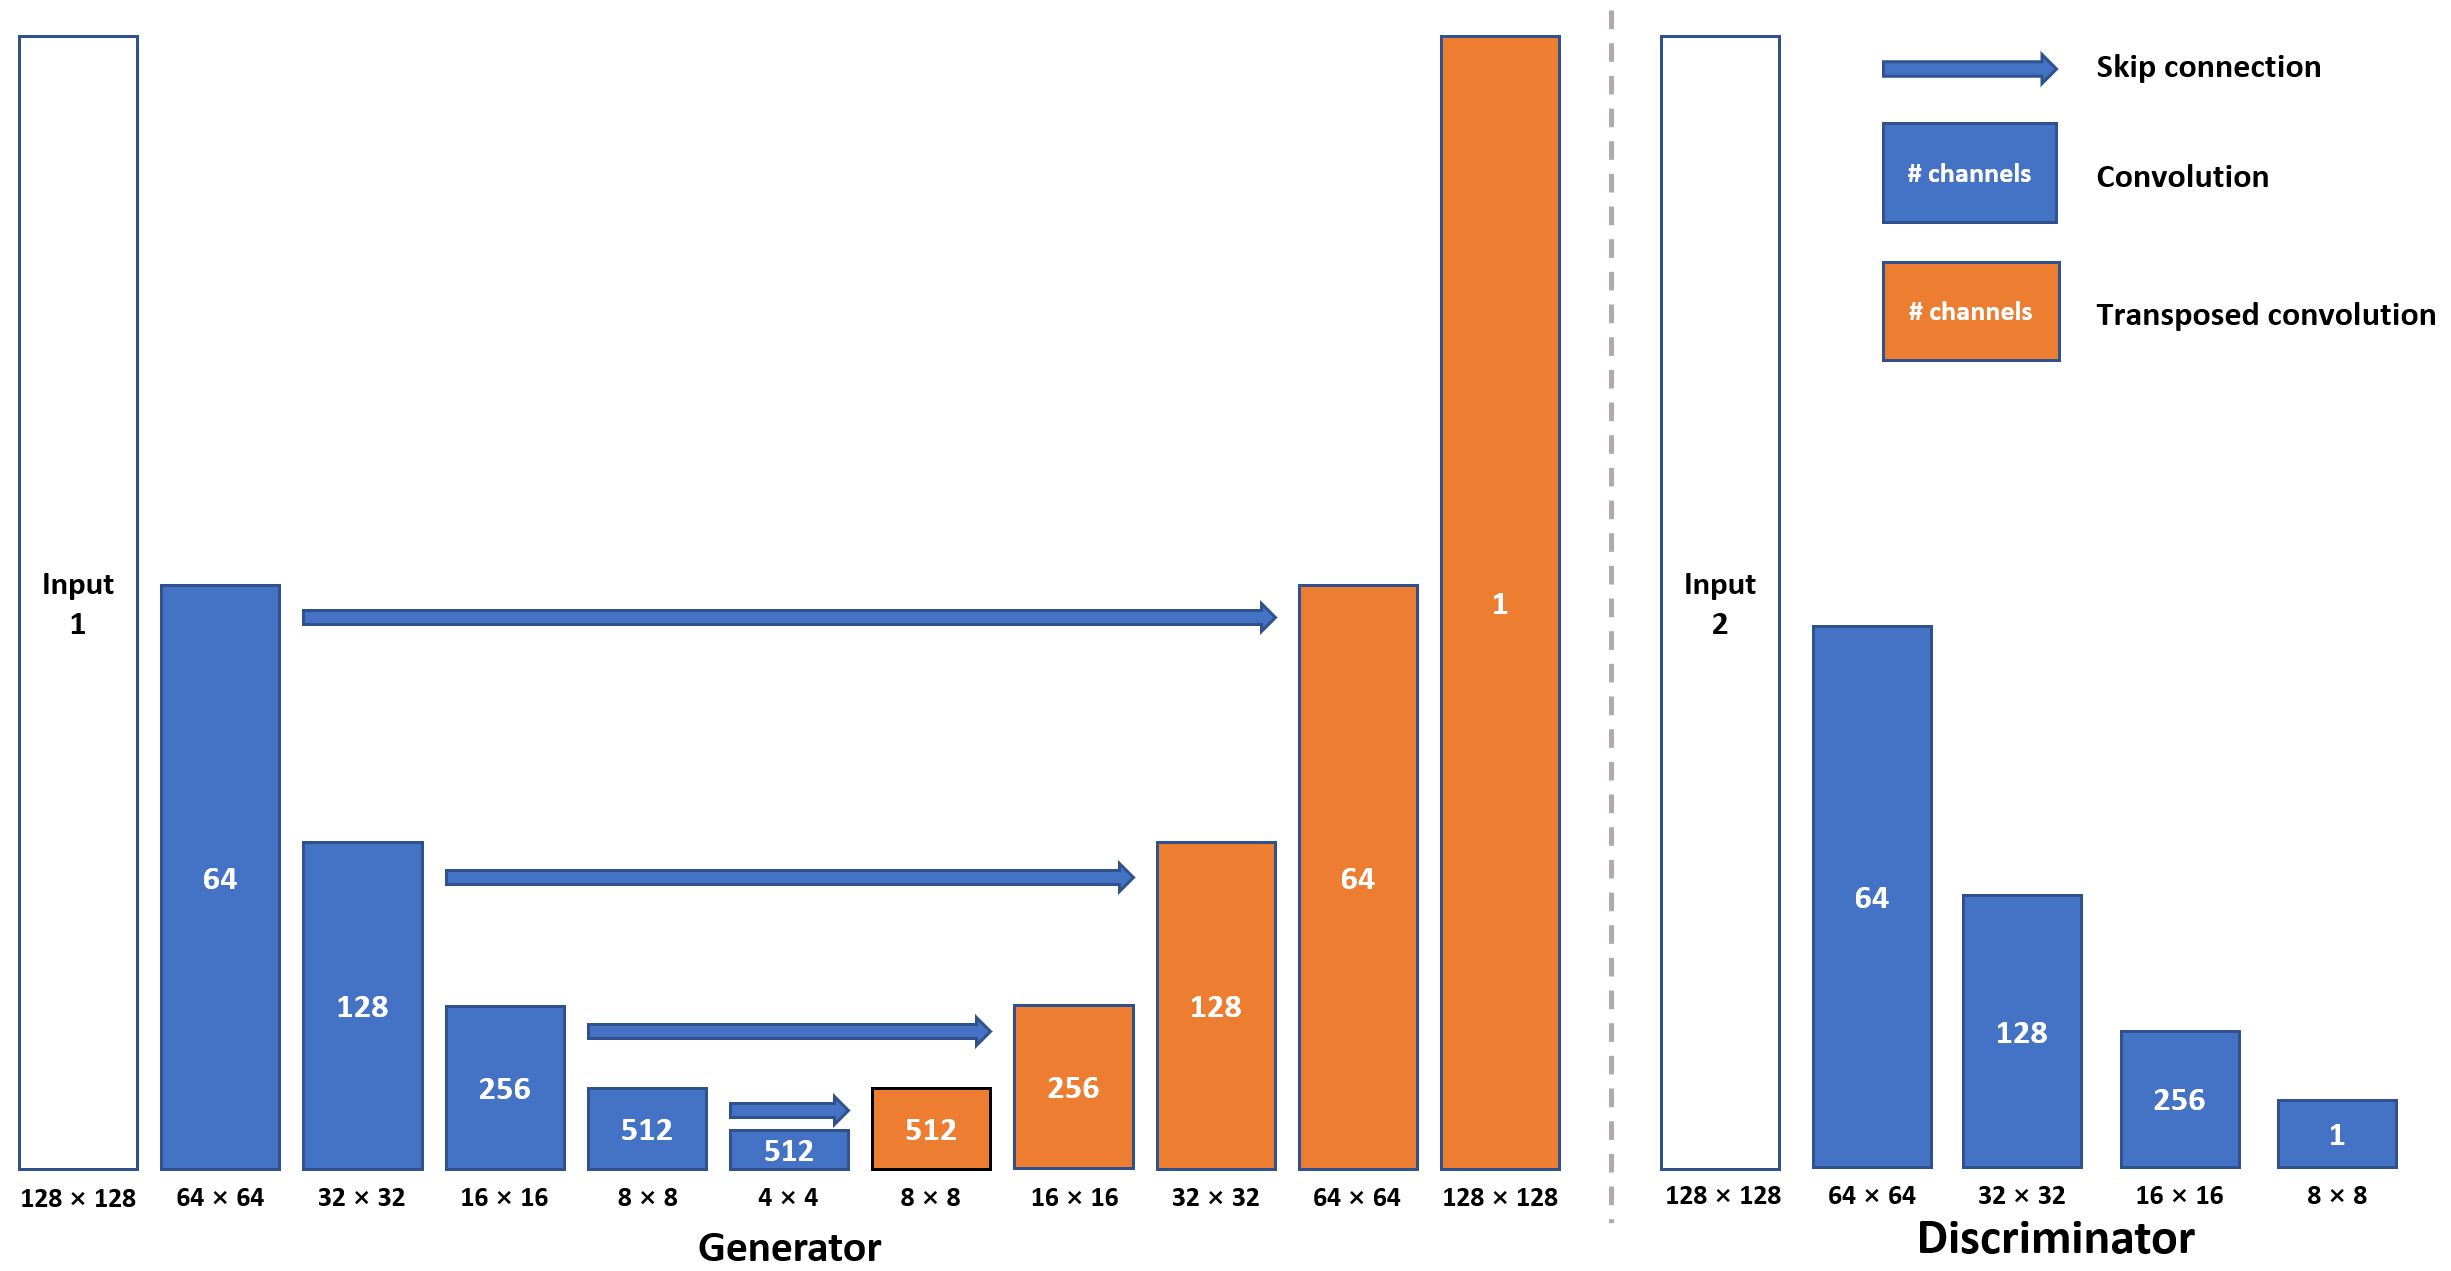
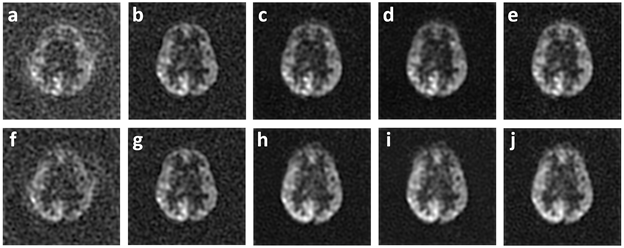
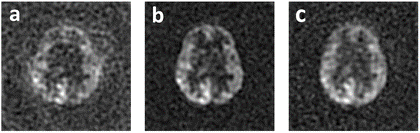
Figure 4. cGAN learning results on a 1st single-spiral test image. a: One single-spiral image sample (Input); b: Corresponding two-spiral image (Ground-truth); c: Estimated high-resolution image.
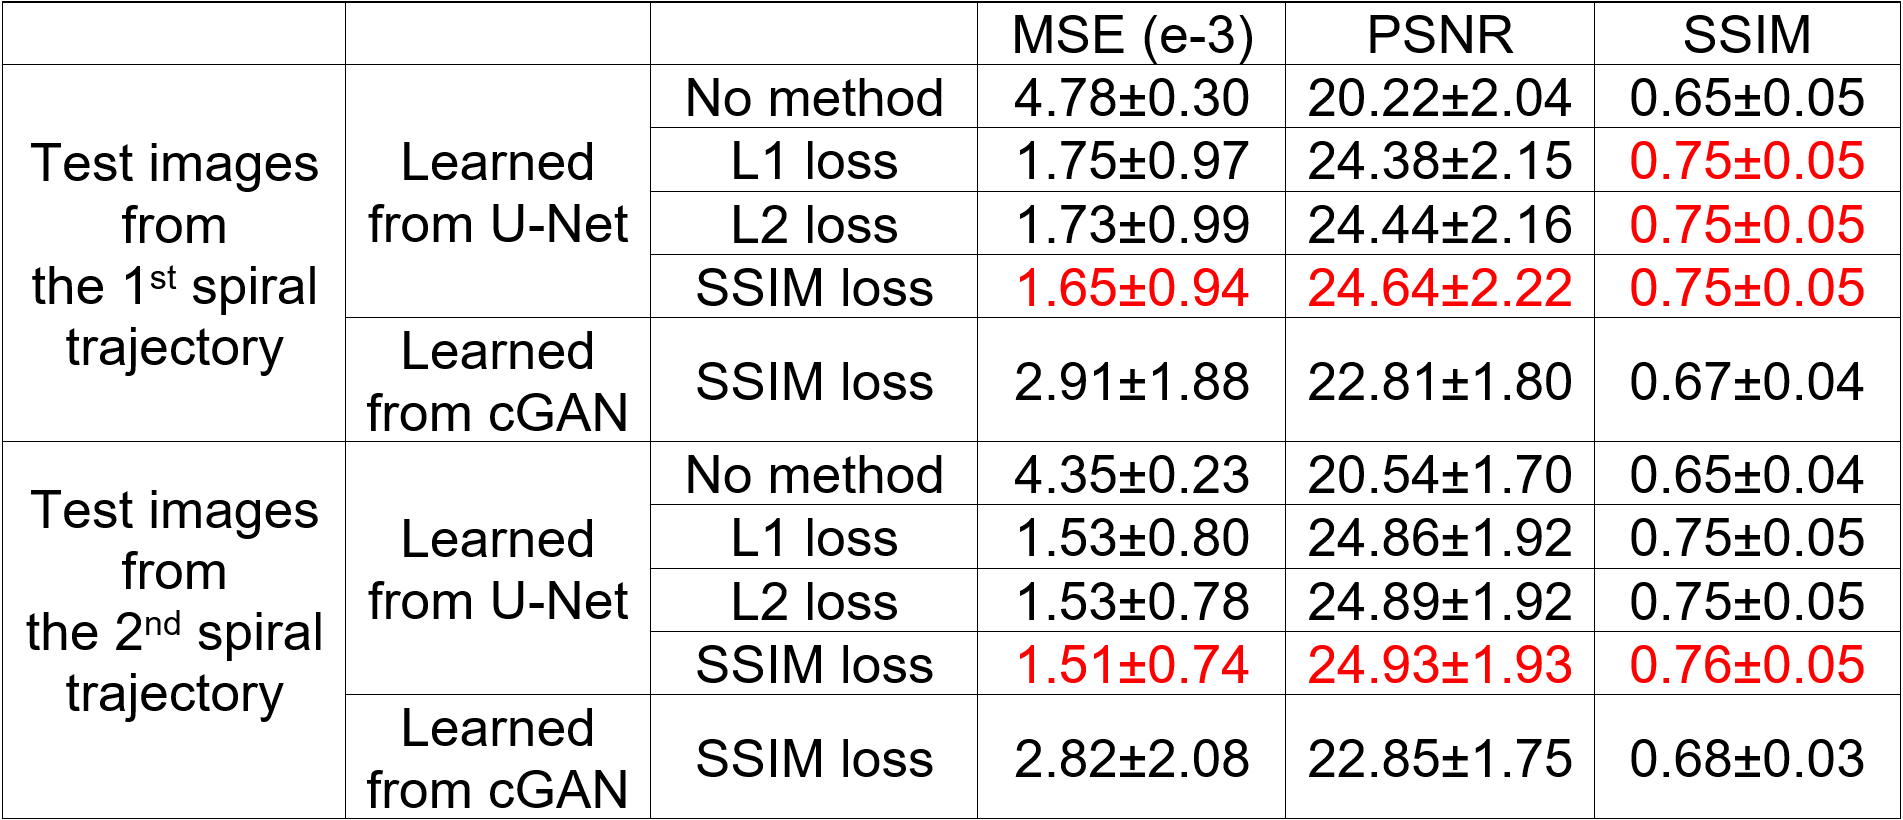
Table 1. MSE, PSNR and SSIM results from the derived deep learning networks on the 1st and 2nd one-spiral test images.