4042
MR Elastography: Clinical Protocol Optimization for Liver Stiffness Estimation1Department of Radiology, The Ohio State University, Columbus, OH, United States, 2MR Collaborations, Siemens Medical Solutions USA, Malvern, PA, United States, 3Siemens Healthineers, Erlangen, Germany
Synopsis
Magnetic resonance elastography (MRE) has become a standard clinical tool to stage liver fibrosis and it is important to optimize the imaging protocols to achieve robust stiffness measurement. Imaging was performed using a 3T MRI scanner on 20 healthy adult volunteers with varied driver powers and acquisition parameters. The stiffness value at 60Hz across the settings was found to be stable for all the subjects. 40-50% driver power with 20-35mT motion encoding gradient amplitude would deliver adequate shear waves to achieve diagnostic quality of liver stiffness maps.
Introduction
Magnetic Resonance Elastography (MRE) is a non-invasive technique to estimate the mechanical properties of soft tissues. An alternative to palpation, MRE is particularly useful to diagnose liver disease, because it eliminates the need for needle biopsy or surgical procedure [1]. Given its diagnostic accuracy, in recent years MRE has become a standard clinical tool to stage liver fibrosis. MRE quality, such as the size of confidence region and the reliability of stiffness value, can be sensitive to where the passive driver is positioned on the patient, the power of the active driver applied, and imaging protocols, i.e., the amplitude of motion encoding gradient (MEG) etc. This study was aimed to demonstrate the optimized passive driver positioning on patient and find the shear wave driver power and MEG strength needed to achieve robust image quality.Methods
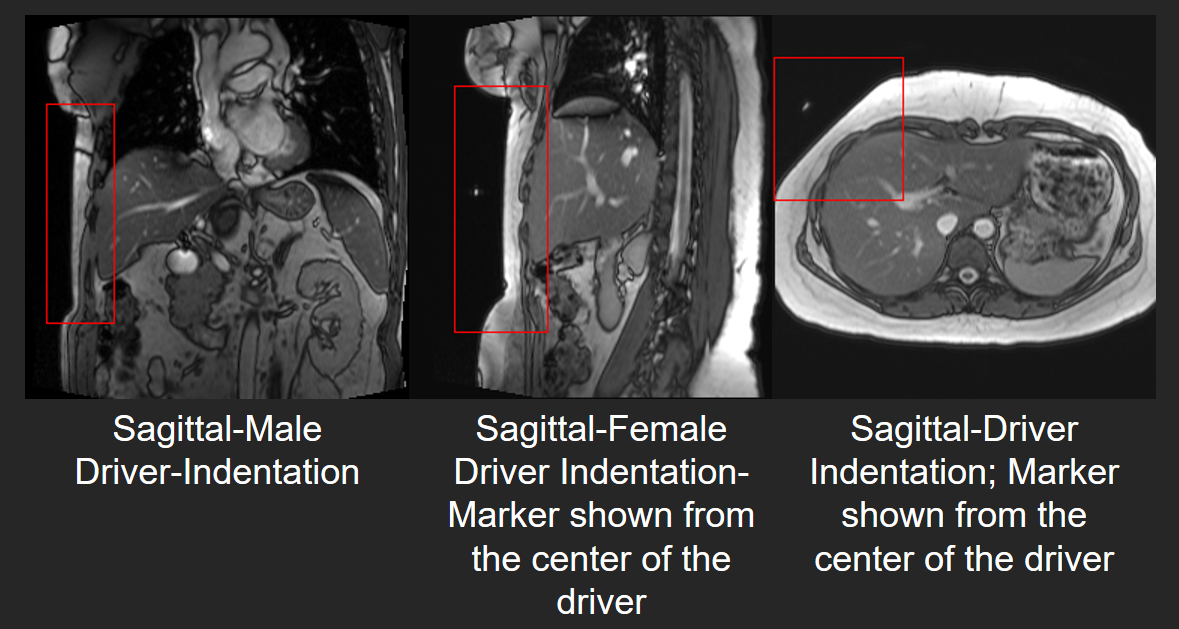
All imaging was performed using a 3T MRI scanner (MAGNETOM Prisma, Siemens Healthcare, Erlangen, Germany) on 10 healthy volunteers (ages 21-65 years, 5 M) with no known health problems. Body mass index (BMI) and belly circumference (BC) was measured after obtaining written informed consent. The passive driver (Resoundant Inc, Rochester, MN USA) was placed on the upper abdomen at the fifth intercostal ribcage but more to the lateral side. Scout images of sagittal and axial views were acquired to verify the placement of the driver (figure 1). A prototype single shot spin echo- echo planar imaging (SE-EPI) MRE sequence was used to acquire axial slices of the liver with the following parameters: FOV:320x320mm, TE:47ms, TR:1000ms, slice thickenss:6mm, acquisition matrix:100x100, bandwidth: 2380Hz/Px, motion encoding gradient (MEG) frequency:60Hz, MEG amplitude:20, 25, 30 and 35mT/m; Only through plane motion was encoded, and GRAPPA with acceleration factor of 2 with 24 GRE reference lines was used. The Spectrally Selective Adiabatic Inversion Recovery (SPAIR) technique was used to suppress the fat. Excitation frequency was 60.1Hz and driver amplitude was varied to 30%, 50%, and 70%. The magnitude images were post processed to compute the first harmonic amplitude (FHA) of the displacement field and the stiffness maps were calculated using a multi-model direct inversion algorithm (MMDI) [2]. Stiffness values and FHA were reported using a semi-automatic region of interest (ROI) selection technique in the liver. ROI areas were reported as a percentage of the segmented liver area.Results
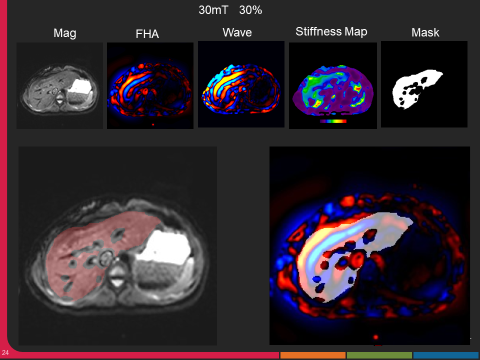
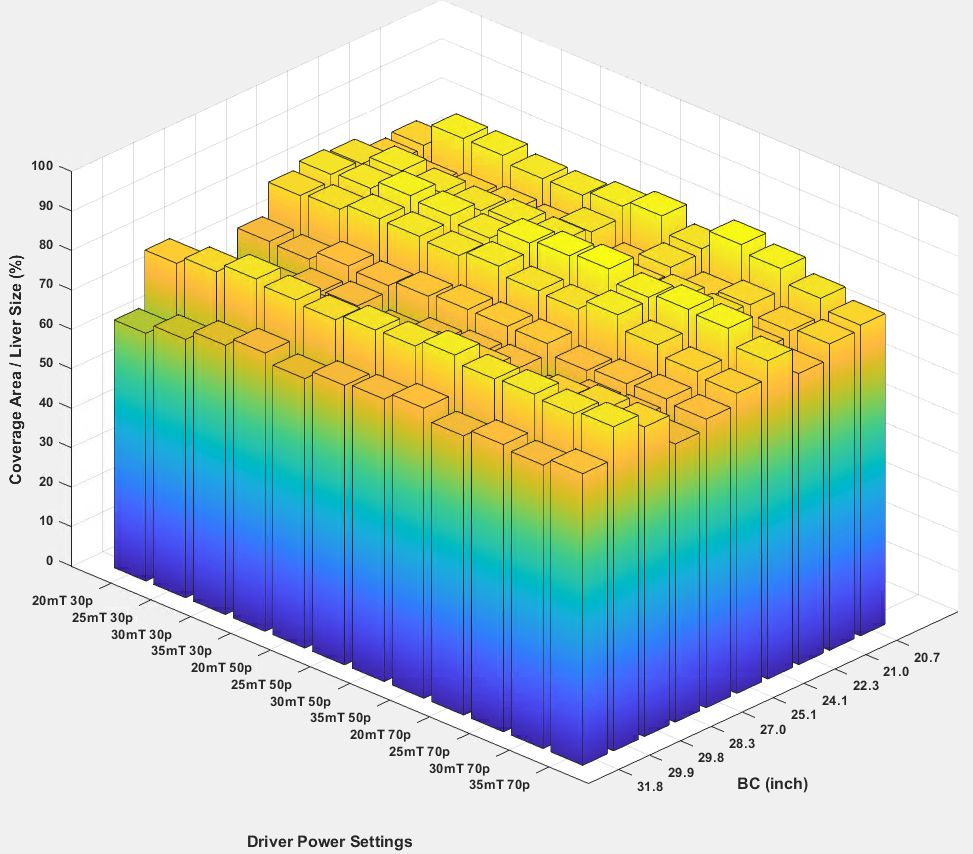
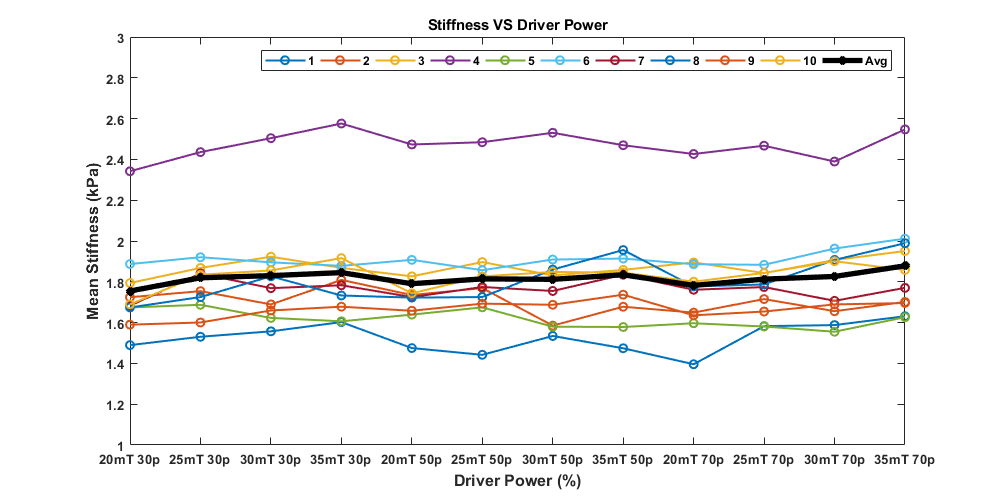
The representative MRE magnitude image, wave image and stiffness maps from one volunteer acquired with 30% driver amplitude and 30mT/m MEG are shown in figure 2. The BMI of the volunteers ranged from 17.98 to 30.18 with a mean of 24.10 ± 3.44 and the BC from 28.5 to 42.8 inches with mean of 34.40 ± 4.33 inches. FHA ranged from 4.23 to 12.84 µm/rad and increased with MEG amplitude and driver power. In the stiffness maps, globally the number of pixels inside the liver region with 95% confidence increased gradually (though marginally) with increasing MEG amplitude between 20mT to 30mT at varying driver power, and then plateaued at 35mT (Figure 3). The mean liver coverage with 95% confidence was found to be maximum between 40-50% power levels and the coverage ratio ranged from 64% to 85% as shown in figure 3. The stiffness value across the settings was found to be stable for all the subjects though one subject had significantly higher stiffness as compared to the others (figure 4).Discussion
Passive driver placement more to the lateral side of the abdomen (as shown in the scout images figure 1) helps to achieve better wave penetration and anatomical coverage of the liver. About 40% driver power was determined to be adequate to generate reliable stiffness estimates for all body habitus irrespective of belly circumference or BMI. As expected, the stiffness was not altered with increase in driver power. However, at increased power levels (i.e. >50%) a deeper portions of the liver were covered in the stiffness map (with 95% confidence interval). But with higher power, the periphery experienced inter-voxel phase dispersion due to overdriving leading to unreliable measurements in the superficial liver and therefore the net area of the confidence region in stiffness map didn’t increase. The ratio of the 95% confidence region of stiffness map to the segmented liver area ranged from 62% to 78% with increasing driver power. Major portions of the liver could be used when reporting stiffness but the %area appears lower than 90%. This measure could be biased lower because the calculated liver area includes vessels which are excluded from the measured ROI. Additionally, when the liver is soft the measurements at deeper portions of the liver becomes unreliable due to wave attenuation. Even in those settings the coverage of reportable stiffness values is still very good.Conclusion
In this study we demonstrated that with a lateral driver positioning and good driver contact with the body, the ability to achieve large measurable stiffness ROIs is relatively insensitive to driver power and MEG amplitude over a large range of values while remaining independent of body habitus as characterized by BMI and BC. 40-50% power at 60Hz with 20-35mT/m motion encoding amplitude was shown to result in measurable shear waves in adult subjects sufficient to achieve diagnostic quality liver stiffness maps.Acknowledgements
N/AReferences
1. Muthupillai R, Lomas DJ, Rossman PJ, et al. Magnetic resonance elastography by direct visualization of propagating acoustic strain waves. Science 1995; 269(5232):1854–7.
2. Silva AM, Grimm RC, Glaser KJ, et al. Magnetic resonance elastography: evaluation of new inversion algorithm and quantitative analysis method. Abdom Imaging 2015;40(4):810–817.
Figures