4041
Preliminary Evaluation of Risperidone in Huntington’s Disease: An Intravoxel Incoherent Motion (IVIM) Study1Biomedical Engineering, University of Rochester, Rochester, NY, United States, 2Neurology, University of Rochester, Rochester, NY, United States, 3Imaging Sciences, University of Rochester, Rochester, NY, United States, 4Physics and Astronomy, University of Rochester, Rochester, NY, United States
Synopsis
Huntington’s disease (HD) is a neurodegenerative movement disorder that negatively impacts quality of life. Atypical antipsychotics are used for treatment, though with limited evidence from controlled trials. In this preliminary study we investigated the effects of risperidone, an atypical antipsychotic for the treatment of chorea in HD using intravoxel incoherent motion diffusion weighted imaging (IVIM-DWI) and volumetric analysis. Preliminary findings suggest that early effects of risperidone may present as changes in the microcirculation within the basal ganglia prior to any anatomical changes. However, further evaluation in a larger sample size is needed to better assess the clinical response to risperidone.
Introduction
Huntington’s disease (HD) is a neurodegenerative movement disorder characterized by irregular movements known as chorea, which negatively impact patient quality of life and cause functional disability1. Typically manifesting around 40 years of age, HD progresses in later stages to include psychiatric symptoms such as dementia and depression2. Early atrophy and involvement of the striatum is well established3-5; however, investigation of other basal ganglia structures remains limited, despite their involvement in movement and reward pathways within the brain6, 7. Additionally, atypical antipsychotics are currently used for the treatment of chorea in HD, albeit with limited evidence from controlled trials8, 9. In this preliminary study we investigated the effects of risperidone, an atypical antipsychotic, for the treatment of chorea in 4 patients with HD using intravoxel incoherent motion diffusion weighted images (IVIM-DWI) and volumetric analysis.Methods
Data AcquisitionNeuroimaging was conducted on 4 patients (1 female and 3 males, mean age ± standard error = 59.7 ± 1.12, range = 54 - 62 years) with manifest HD and Unified Huntington’s Disease Rating Scale (UHDRS)10 ≥ 8 , at baseline and 8 weeks post-treatment. All imaging was conducted on research dedicated 3 Tesla (T) whole-body MAGNETOM Prisma scanner (Siemens Healthcare, Erlangen, Germany), equipped with a 64-channel head coil. A 3D T1w MPRAGE (repetition time/echo time TR/TE = 1400/2.34 ms; 1mm isotropic resolution) sequence was acquired for anatomical segmentation and volumetric analysis. IVIM-DWI was performed using 15 b-values (0,5,7,10,15,20,30,40,50,60,100,200,400,700,1000 s/mm2) with three orthogonal acquisition directions for each b-value (TR/TE=4300/69 ms; 1.5 mm isotropic resolution). Severity of HD symptoms and response to risperidone were evaluated using the UHDRS total maximal chorea score (TMCS).
IVIM Fitting
The IVIM model is a standard two-compartment model of diffusion, described using a biexponential equation11-13:
$$ \frac{S(b)}{S_0} = fe^{-bD + D^*} + (1-f)e^{-bD} $$
Where S(b) is the signal intensity at different b-values and S0 is the signal intensity of the B0 image. The first term represents signal loss due to blood flow in the microvasculature where f, represents the perfusion fraction, D* is the pseudodiffusion coefficient. The second term represents the signal loss due to the molecular diffusion of water in the extravascular space, characterized by the diffusion coefficient D12. A two-step fitting procedure was performed using SciPy14. Based on the assumption that D*>>D, the signal attenuation was first fit using a monoexponential at b > 250 s/mm2 to solve for D. The residual signal was then fit using the biexponential model while holding D constant to solve for f and D*, using a constrained nonlinear least squares minimization.
Volumetric Analysis
Whole brain cortical and subcortical segmentation were performed using Freesurfer15 at each time point, and volumetric estimates for subcortical structures were normalized to the total intracranial volume, presented as a fraction of the total intracranial brain volume (TIBVf).
Statistical Analysis
ROI analysis was performed for each estimated IVIM metric using subject specific masks obtained from Freesurfer segmentations. Quantitative measurements were compared before and 8 weeks after initiation of risperidone in the basal ganglia. Non-parametric Wilcoxon signed rank tests were performed with post hoc multiple comparisons and Bonferroni correction. Correlations were performed using the non-parametric Spearman’s rho. The significance level was based on p < 0.05.
Results & Discussion
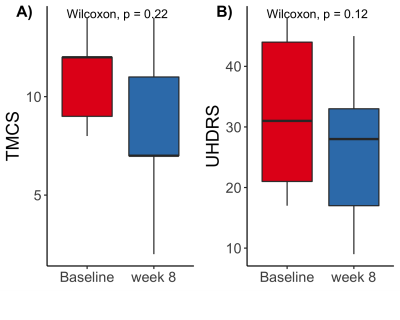
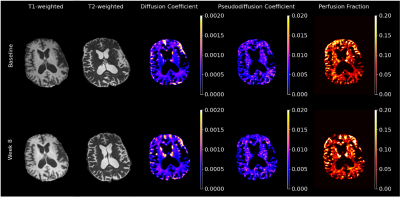
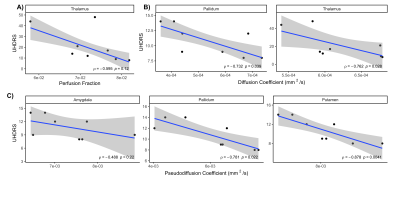
TMCS and UHDRS motor score before and during treatment are shown in Figure 1. TMCS [mean (sd); Baseline: 11.0 (2.45); 8 week: 8.2 (4.5)] and UHDRS motor scores [mean(sd) ; Baseline: 32.2 (13.6), 8 weeks: 26.4 (13.9)] were lower after 8 weeks of treatment, but these differences were not significant. Representative anatomical images and parametric maps from IVIM fitting are shown from a single subject in Figure 2 at baseline and during treatment at 8 weeks. High signal is observed in the striatum in the diffusion and perfusion fraction maps, with higher signal observed at 8 weeks than at baseline. Ventriculomegaly, secondary to atrophy of the caudate (hydrocephalus ex vacuo) is observed in T1-weighted and T2-weighted images. The pseudo-diffusion coefficient was found to be significantly increased during treatment at 8 weeks in the pallidum (p=0.02) and amygdala (p=0.04), as was the perfusion fraction (p ≤ 0.01) in the pallidum only (Figure 3A, 3B). No significant differences were found using volumetric measurements or from the diffusion coefficient, estimated from the IVIM fitting (Figure 3C, 3D). Additionally, the UHDRS was significantly negatively correlated with the pseudodiffusion coefficient and diffusion coefficient at baseline (Figure 4B, 4C). These data suggest that one of the early effects of risperidone treatment may be quantifiable by assessing changes in the microcirculation within the basal ganglia16. However, a larger sample size is needed to better assess the clinical response to risperidone and its relationship to basal ganglia microcirculation.Conclusion
The preliminary results presented suggest that functional measurements obtained from IVIM might serve as a potential in vivo biomarker for symptomatic treatment of HD.Acknowledgements
We would like to acknowledge all subjects that took part in this study as well as all MRI technicians that facilitated data acquisition.References
1. McColgan P, Tabrizi SJ. Huntington's disease: a clinical review. Eur J Neurol. Jan 2018;25(1):24-34. doi:10.1111/ene.134132.
2. Dumas EM, van den Bogaard SJ, Middelkoop HA, Roos RA. A review of cognition in Huntington's disease. Front Biosci (Schol Ed). Jan 1 2013;5:1-18. doi:10.2741/s3553.
3. Vonsattel JP, Myers RH, Stevens TJ, Ferrante RJ, Bird ED, Richardson EP, Jr. Neuropathological classification of Huntington's disease. J Neuropathol Exp Neurol. Nov 1985;44(6):559-77. doi:10.1097/00005072-198511000-000034.
4. Halliday GM, McRitchie DA, Macdonald V, Double KL, Trent RJ, McCusker E. Regional specificity of brain atrophy in Huntington's disease. Exp Neurol. Dec 1998;154(2):663-72. doi:10.1006/exnr.1998.69195.
5. Douaud G, Gaura V, Ribeiro MJ, et al. Distribution of grey matter atrophy in Huntington's disease patients: a combined ROI-based and voxel-based morphometric study. Neuroimage. Oct 1 2006;32(4):1562-75. doi:10.1016/j.neuroimage.2006.05.0576.
6. Fazio P, Paucar M, Svenningsson P, Varrone A. Novel Imaging Biomarkers for Huntington's Disease and Other Hereditary Choreas. Curr Neurol Neurosci Rep. Oct 5 2018;18(12):85. doi:10.1007/s11910-018-0890-y7.
7. Niccolini F, Politis M. Neuroimaging in Huntington's disease. World J Radiol. Jun 28 2014;6(6):301-12. doi:10.4329/wjr.v6.i6.3018.
8. Coppen EM, Roos RA. Current Pharmacological Approaches to Reduce Chorea in Huntington's Disease. Drugs. Jan 2017;77(1):29-46. doi:10.1007/s40265-016-0670-49.
9. Videnovic A. Treatment of huntington disease. Curr Treat Options Neurol. Aug 2013;15(4):424-38. doi:10.1007/s11940-013-0219-810.
10. Unified Huntington's Disease Rating Scale: reliability and consistency. Huntington Study Group. Mov Disord. Mar 1996;11(2):136-42. doi:10.1002/mds.87011020411.
11. Le Bihan D, Breton E, Lallemand D, Aubin ML, Vignaud J, Laval-Jeantet M. Separation of diffusion and perfusion in intravoxel incoherent motion MR imaging. Radiology. Aug 1988;168(2):497-505. doi:10.1148/radiology.168.2.339367112.
12. Le Bihan D. What can we see with IVIM MRI? Neuroimage. Feb 15 2019;187:56-67. doi:10.1016/j.neuroimage.2017.12.06213.
13. Le Bihan D. Intravoxel incoherent motion imaging using steady-state free precession. Magn Reson Med. Jul 1988;7(3):346-51. doi:10.1002/mrm.191007031214.
14. Virtanen P, Gommers R, Oliphant TE, et al. SciPy 1.0: fundamental algorithms for scientific computing in Python. Nat Methods. Mar 2020;17(3):261-272. doi:10.1038/s41592-019-0686-215.
15. Fischl B, Salat DH, Busa E, et al. Whole brain segmentation: automated labeling of neuroanatomical structures in the human brain. Neuron. Jan 31 2002;33(3):341-55. doi:10.1016/s0896-6273(02)00569-x16.
16.Hu ML, Zong XF, Zheng JJ, et al. Short-term Effects of Risperidone Monotherapy on Spontaneous Brain Activity in First-episode Treatment-naive Schizophrenia Patients: A Longitudinal fMRI Study. Sci Rep. Oct 4 2016;6:34287. doi:10.1038/srep34287
Figures


