4040
Non-Gaussian Brain Diffusion Cross-sectional and Longitudinal Changes in Type 2 Diabetes Mellitus Adults1Anesthesiology, University of California Los Angeles, Los Angeles, CA, United States, 2UCLA School of Nursing, Los Angeles, CA, United States, 3Medicine, University of California Los Angeles, Los Angeles, CA, United States, 4Radiological Sciences, University of California Los Angeles, Los Angeles, CA, United States, 5Bioengineering, University of California Los Angeles, Los Angeles, CA, United States, 6Brain Research Institute, University of California Los Angeles, Los Angeles, CA, United States
Synopsis
Patients with Type 2 diabetes mellitus (T2DM) show brain changes in mood and cognitive control sites, functions that are deficient in the condition, examined by Gaussian diffusion-based diffusion tensor imaging (DTI). However, the majority of brain areas with complex fibers, follow non-Gaussian diffusion, and DTI-based measures may not show adequate diffusion changes. We examined brain changes at baseline and 6 months in T2DM patients using the diffusion kurtosis imaging-based mean kurtosis procedures and showed wide-spread acute and chronic tissue changes in the condition, with continued progression after 6 months in areas involved in mood and cognitive regulatory functions.
Purpose
Type 2 diabetes mellitus (T2DM) patients show brain injury, examined by Gaussian diffusion based diffusion tensor imaging (DTI),1-3 in areas that regulate autonomic, cognitive, and mood functions, deficient in the condition.4-7 However, the majority of brain sites, especially regions with complex brain fibers, follow non-Gaussian diffusion, and thus DTI-based measures may not provide complete diffusion changes across the brain. Diffusion kurtosis imaging (DKI) can provide significant improvement over the DTI-based model to assess non-Gaussian diffusion properties. The DKI metrics quantify the degree of non-Gaussian diffusion, provide a second-order approximation of water diffusion in brain tissue,8 and are closely related to tissue microstructure. Several DKI indices, including mean kurtosis (MK) can be calculated that indicates the average amount by which the diffusion displacement probability distribution deviates from Gaussian diffusion within tissue, and can differentiate acute from chronic tissue injury. Our aim was to evaluate non-Gaussian diffusion changes, using DKI-based MK measures, across the brain in T2DM patients over controls at baseline, and examine whether those changes progress with time at 6-months in T2DM subjects.Materials and methods
We examined 22 T2DM (age, 56.0±7.6years; body-mass-index (BMI), 29.6±5.5kg/m2; 13 female; HbA1C, 7.3±1.6%; disease duration, 10.8±7.6years), who were followed after 6-months, and 25 healthy controls (age, 54.9±8.2 years; BMI, 25.9±4.7kg/m2; 18 female), using a 3.0-Tesla MRI (Siemens, Magnetom, Prisma-Fit). DKI data were acquired using an echo-planar imaging with twice-refocused spin-echo pulse sequence [repetition-time (TR)=7000ms; echo-time (TE)=90ms; flip angle (FA)=90°; bandwidth=2440Hz/pixel; matrix size=82×82; FOV=230×230mm; slice-thickness=2.8mm, diffusion values=0, 1000, and 2000s/mm2; diffusion gradient directions=30). High-resolution T1-weighted images were collected using the magnetization-prepared rapid acquisition gradient-echo pulse sequence [TR=2200ms; TE=2.4ms; inversion time=900ms; FA=9°; matrix size=320×320; FOV=230×230mm; slice-thickness=0.9mm]. Cognitive impairment and depressive and anxiety symptoms were evaluated using the Montreal Cognitive Assessment (MoCA), Beck Depression Inventory (BDI-II), and Beck Anxiety Inventory (BAI), respectively. Whole-brain MK maps were calculated from diffusion (b=1000 and 2000sec/mm2) and non-diffusion (b=0 sec/mm2) data using the DKE software.9 We performed motion correction using rigid-body transformation with six parameters to spatially-align all diffusion-weighted images, and the diffusion kurtosis tensors were mutually-fitted to the diffusion-weighted images (b=0, 1000 and 2000 sec/mm2) at each voxel. The MK maps were normalized to Montreal Neurological Institute (MNI) space, and smoothed with a Gaussian filter (8mm). High-resolution T1-weighted images of a control subject were normalized to MNI space, and were used as background images for structural identification. The smoothed MK maps were compared voxel-by-voxel between groups [T2DM at baseline vs controls, T2DM at 6-months vs controls] using ANCOVA (SPM12; covariates, age, sex, and BMI; uncorrected threshold p<0.005). Paired samples t-tests (SPM12) were also performed in T2DM patients between baseline and at 6-months follow-up using the smoothed MK map. The brain clusters with significant differences between groups were overlaid onto background images for structural identification. Cognitive and mood scores were assessed between groups using independent samples and paired t-tests (SPSSv27).Results
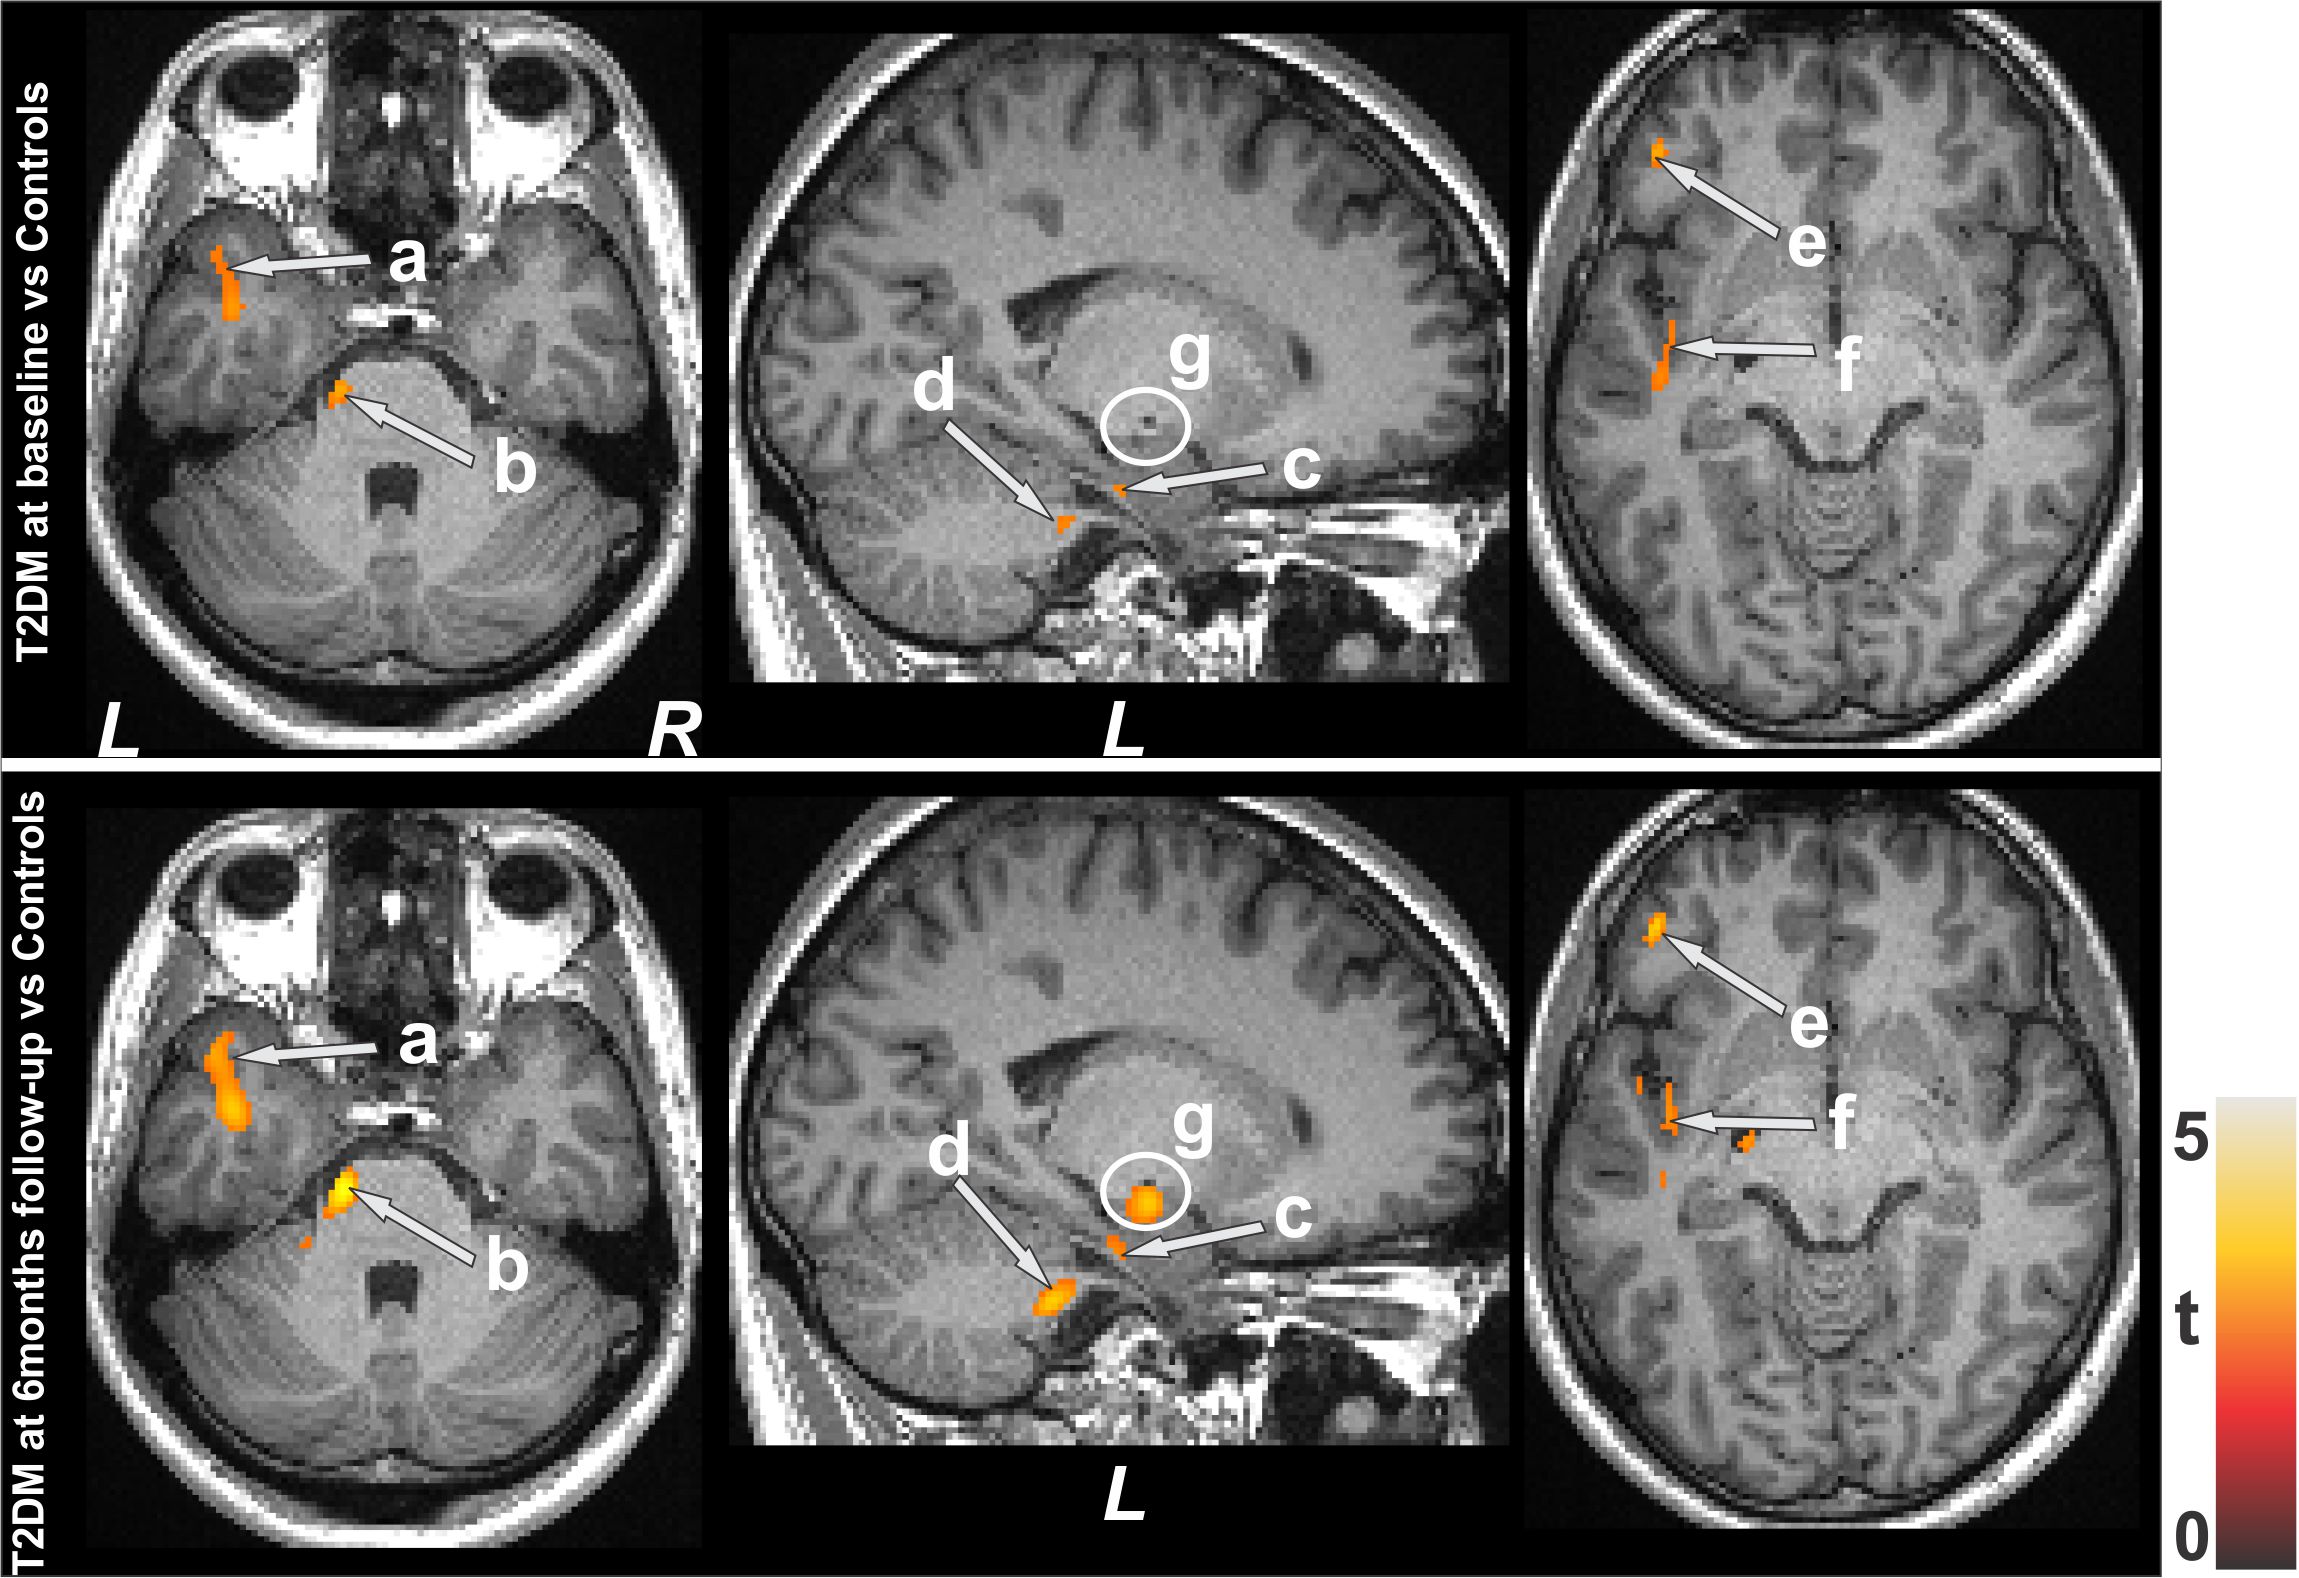
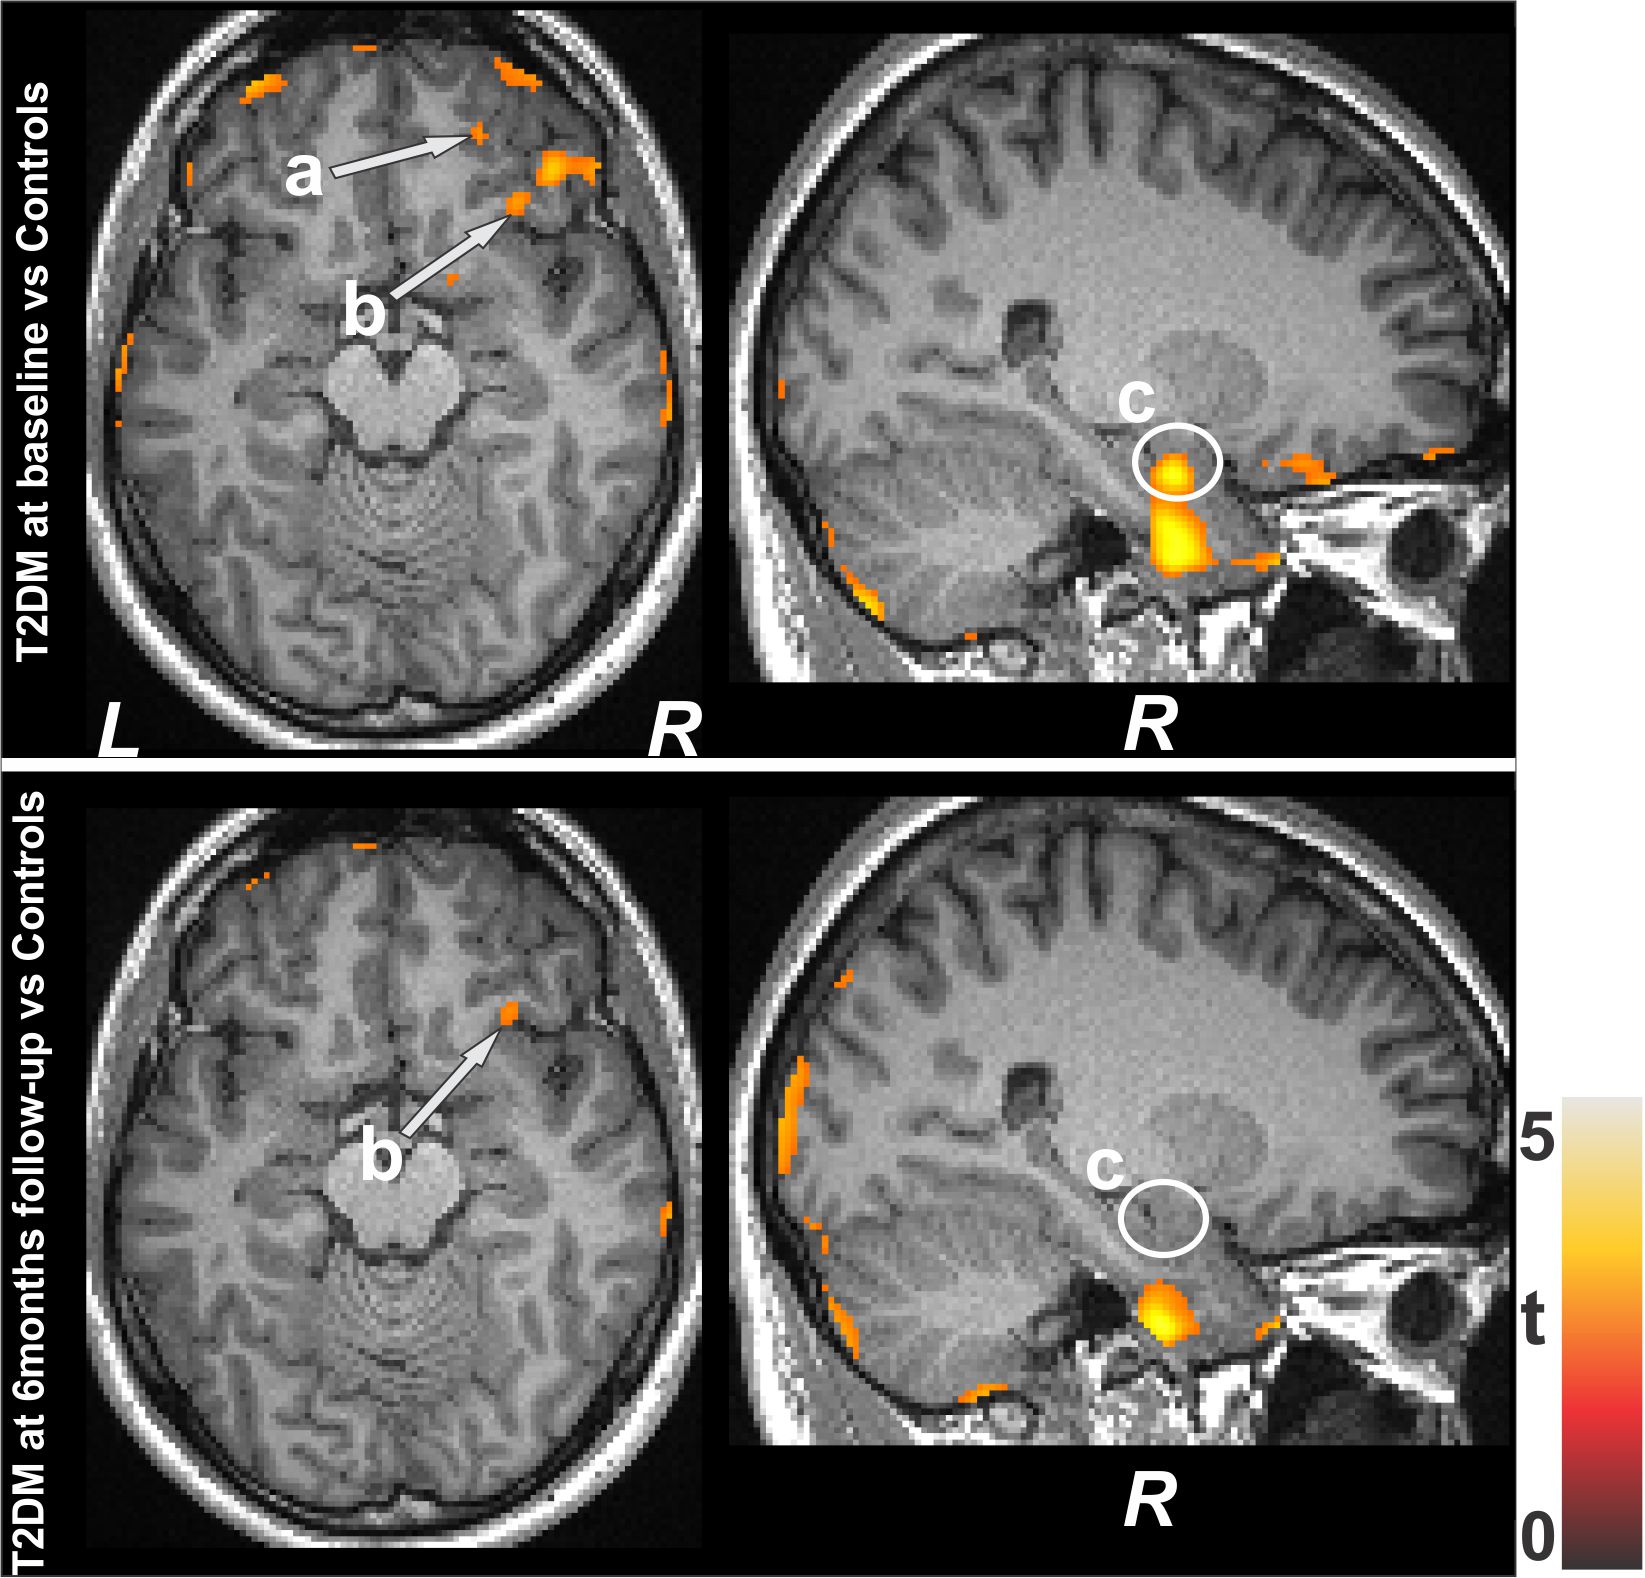
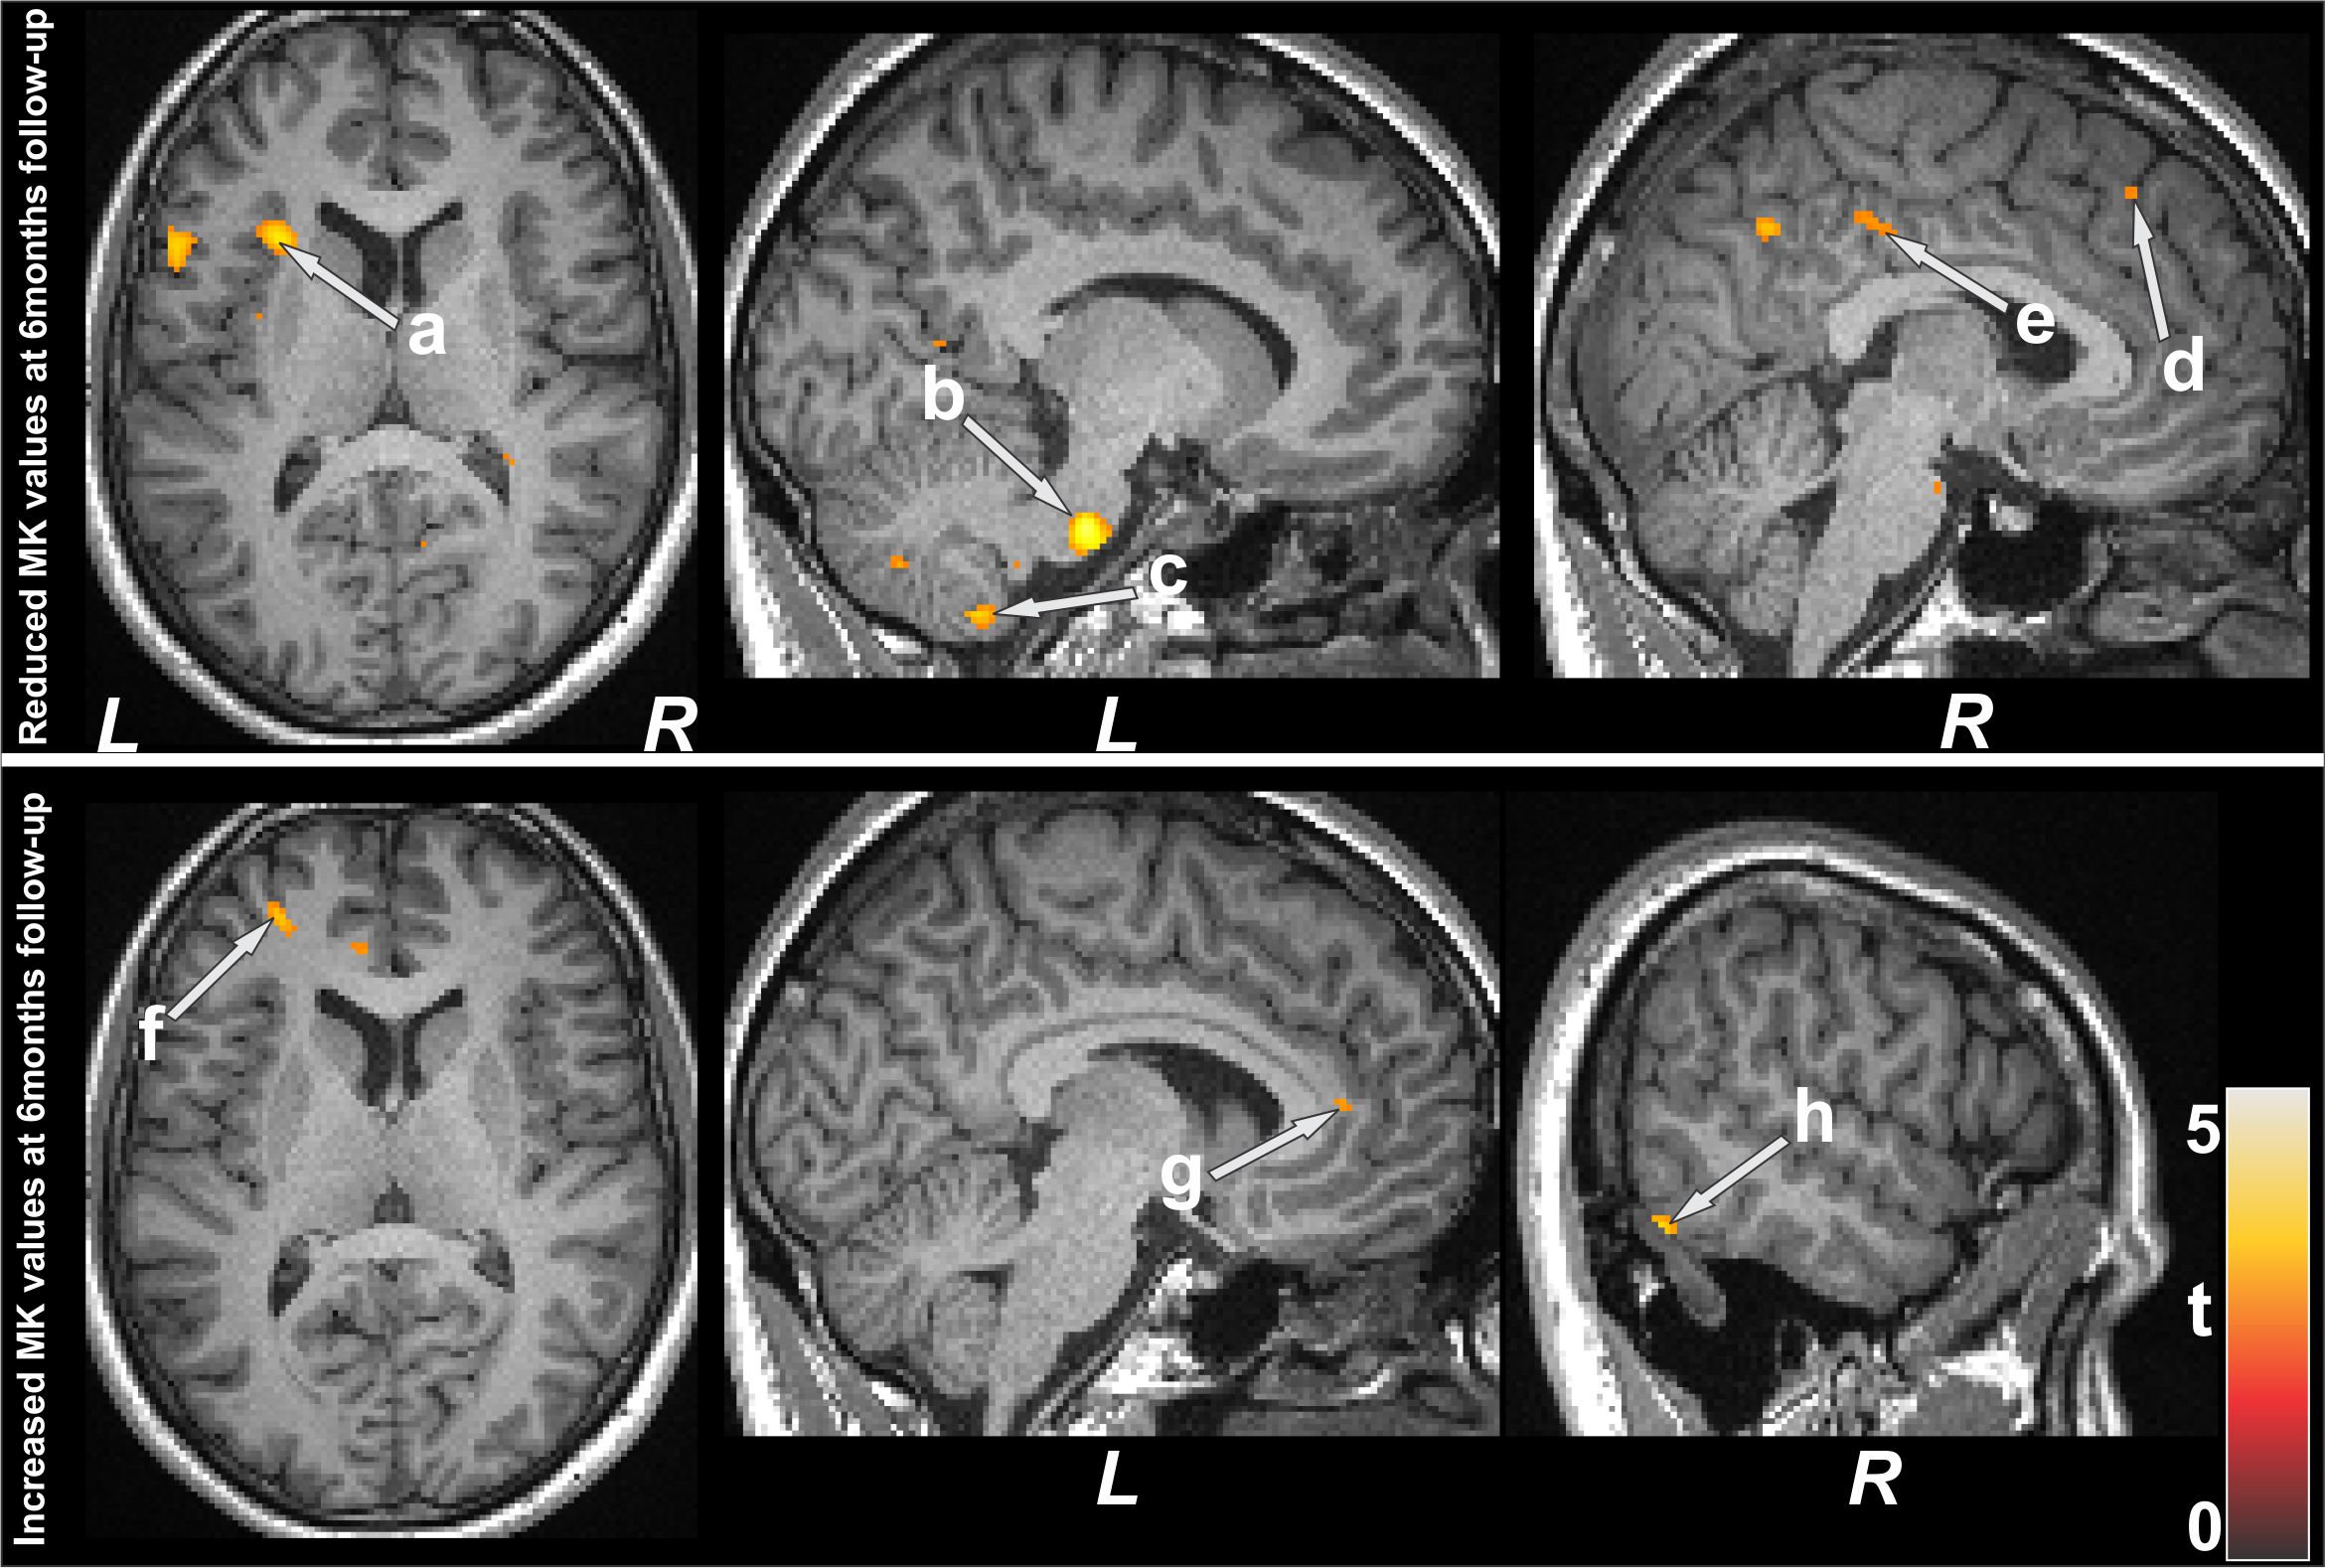
No significant differences in age and sex emerged between T2DM and controls (age, p=0.62; sex, p=0.94). However, BMI was significantly higher in T2DM patients (p=0.01) over controls. T2DM subjects had significantly higher BDI-II (p=0.004) and lower global MoCA scores (p=0.009) compared to controls, but BAI scores did not significantly differ between groups(p=0.21). Both increased and decreased MK values emerged in various brain areas in T2DM over control subjects. Multiple areas (Fig.1), including the temporal cortices (a), pons (b), cerebellar peduncle (d), para-hippocampus (c), frontal and prefrontal cortices (e), and left insula (f) showed reduced MK values in T2DM over controls, indicating chronic tissue changes. Brain regions that showed increased MK values (Fig.2) included the frontal and prefrontal cortices (a), right insula (b), hippocampus (c), amygdala (c), cerebellum, and temporal cortices. Af 6-months follow-up, MoCA and BAI scores did not change significantly from baseline in T2DM subjects, but BDI-II scores were improved. Regional brain MK values continued to be decreased in at 6-months follow-up in T2DM patients compared with controls (Fig.1) at several selected brain sites, including the cerebellum, hippocampus (g), amygdala (g), and posterior-cingulate. Acute brain tissue changes were reduced at 6-months follow-up in T2DM patients (Fig.2). The paired-t test comparison showed decreased MK values at 6-months over baseline in T2DM patients (Fig.3) in the insular cortices (a), medulla, pons (b), cerebellum (c), hippocampus, mid-and posterior-cingulate (e), frontal (d) and prefrontal cortices. Few sites, including the anterior-cingulate (g), frontal, prefrontal (f) and temporal cortices (h) showed increased MK values at 6-months.Discussion
T2DM patients showed significant brain changes in widespread areas that are involved in mood and cognition regulation. Cognitive and mood deficits emerged in T2DM patients at baseline, but cognitive deficits were comparable to baseline at 6-months with improvement in depressive symptoms. However, several brain sites showed injury progression with time at 6-months. These findings indicate that brain injury is in acute and chronic pathological stages and are progressive, which may result from underlying metabolic-dysfunction associated with the condition.Conclusion
T2DM patients have cognitive and mood dysfunctions and brain damage appear in regions regulating these functions, and such change progresses with time with similar cognitive deficits, but improved depressive symptoms in T2DM patients. The findings show that DKI-based MK measures can be used to examine brain tissue changes and progression with time in T2DM patients.Acknowledgements
This work was supported by National Institutes of Health R01 NR017190 and and 3R01 NR017190-03S1.References
1. Xiong Y, Sui Y, Xu Z, et al. A diffusion tensor imaging study on white matter abnormalities in patients with type 2 diabetes using tract-based spatial statistics. AJNR Am J Neuroradiol. 2016;37:1462–1469.
2. Huang L, Zhang Q, Tang T, et al. Abnormalities of brain white matter in type 2 diabetes mellitus: a meta-analysis of diffusion tensor imaging. Front Aging Neurosci. 2021.
3. Reijmer YD, Brundel M, Bresser J, et al. Microstructural white matter abnormalities and cognitive functioning in type 2 diabetes. Diabetes Care. 2013;36:137-144.
4. Brain atrophy in type 2 diabetes: regional distribution and influence on cognition. Diabetes Care. 2013;36:4036-4042.
5. Zhang Y, Zhang X, Zhang J, et al. Gray matter volume abnormalities in type 2 diabetes mellitus with and without mild cognitive impairment. Neurosci Lett. 2014;562:1-6.
6. Gold SM, Dziobek I, Sweat V, et al. Hippocampal damage and memory impairments as possible early brain complications of type 2 diabetes. Diabetologia. 2010;53:2298-2306.
7. Yau PL, Javier DC, Ryan CM, et al. Preliminary evidence for brain complications in obese adolescents with type 2 diabetes mellitus. Diabetologia. 2011; 34:1060-1064.
8. Jensen JH, Helpern JA, Ramani A, et al. Diffusional kurtosis imaging: the quantification of non-gaussian water diffusion by means of magnetic resonance imaging. Magn Reson Med. 2005;53:1432-1440.
9. Tabesh A, Jensen JH, Ardekani BA, et al. Estimation of tensors and tensor-derived measures in diffusional kurtosis imaging. Magn Reson Med. 2011;65:823-836.
Figures