4038
Diffusion MRI in a transgenic mouse model of Alzheimer's disease1Department of Radiology and Imaging Sciences, Indiana University School of Medicine, Indianapolis, IN, United States
Synopsis
Alzheimer’s disease (AD) is common neurodegenerative dementia. Though the disease has no cure, early intervention can help to maintain normal mental function and slow down the progression of the disease. Brain imaging, especially Magnetic Resonance Imaging (MRI) has been extensively used to characterize the location and progression of the disease. Diffusion MRI is a novel imaging technique that exploits the microscopic mobility of water molecules. However, a comprehensive study incorporating high-resolution diffusion tensor imaging (DTI), diffusion kurtosis imaging (DKI), and Neurite Orientation Dispersion and Density Imaging (NODDI) is still lacking. So, we aim to apply DTI, DKI and NODDI.
Synopsis
Alzheimer’s disease (AD) is common neurodegenerative dementia. Though the disease has no cure, early intervention can help to maintain normal mental function and slow down the progression of the disease. Brain imaging, especially Magnetic Resonance Imaging (MRI) has been extensively used to characterize the location and progression of the disease. Diffusion MRI is a novel imaging technique that exploits the microscopic mobility of water molecules. However, a comprehensive study incorporating high-resolution diffusion tensor imaging (DTI), diffusion kurtosis imaging (DKI), and Neurite Orientation Dispersion and Density Imaging (NODDI) is still lacking. Here, in this present study, we aim to conduct DTI, DKI, and NODDI analysis between the AD and wild type (WT) groups using ex-vivo mice brains.Purpose
To determine the statistically significant difference of image metrics between AD and WT mice using DTI, DKI, and NODDI.Introduction
Diffusion MRI (dMRI) is a useful imaging technology to delineate microstructural white matter integrity1. DTI has been widely used for the investigation of brain changes in AD2. However, conventional DTI measures water diffusion based upon Gaussian water displacement distribution3. This assumption may not be valid for biological tissues where water molecules often show non-Gaussian distribution3,4. The DKI extends the conventional DTI by estimating the kurtosis of the water diffusion probability distribution function5 and the NODDI is also a non-Gaussian model that assumes three types of microstructural environments (intra-neurite, extra-neurite and cerebrospinal fluid (CSF) compartments6.Methods
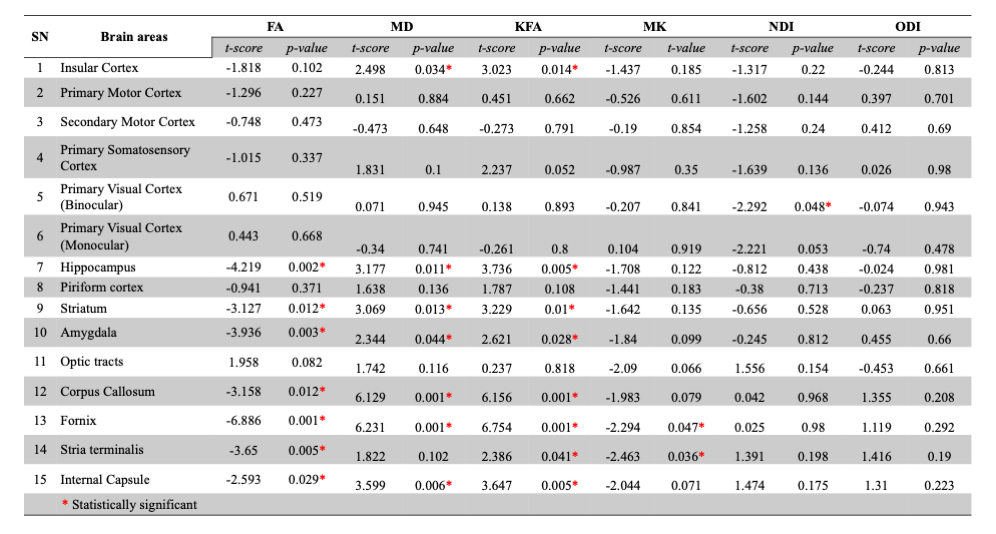
All animal experiments were carried out in compliance with the local Institutional Animal Care and Use Committee. Five Alzheimer’s disease (AD) with 5xFAD background and six wildtype (WT) mice brains were included in this study. MR images were acquired on a 30-cm bore 9.4 T magnet (Bruker BioSpec 94/30, Billerica, MA)) with a 3D diffusion-weighted multi-shot echo-planar imaging (EPI) pulse sequence. Multiple shells (b-value = 1000, 2000, and 3000) were acquired at isotropic resolution 0.1 mm and 123 diffusion directions with 12 b0 images. The data was preprocessed (denoising7, Gibb’s artifact removal8, motion correction, and eddy-current correction using MRtrix3). The preprocessed data were used to determine the DTI metrics, namely Fractional Anisotropy (FA) and Mean Diffusivity (MD) using DIPY9, DKI metrics, i.e., Kurtosis Fractional Anisotropy (KFA) and Mean Kurtosis (MK) using DIPY9 and NODDI metrics, viz., Neurite Density Index (NDI) and Orientation Dispersion Index (ODI) using AMICO10 respectively. These metrics were registered to standard template using diffeomorphic ANTs registration11. 15 brain regions, namely insular cortex, primary motor cortex, secondary motor cortex, primary somatosensory cortex, primary visual cortex binocular, primary visual cortex monocular, hippocampus, piriform cortex, striatum, amygdala, optic tracts, corpus callosum, fornix, stria terminalis, and internal capsule were analyzed for ROIs. Two samples t-test was conducted using SPSS statistics, version 27 (IBM, Armonk, Chicago, USA) to determine the statistical significance between AD and WT. The p-value was set at 0.05 level of significance.Results
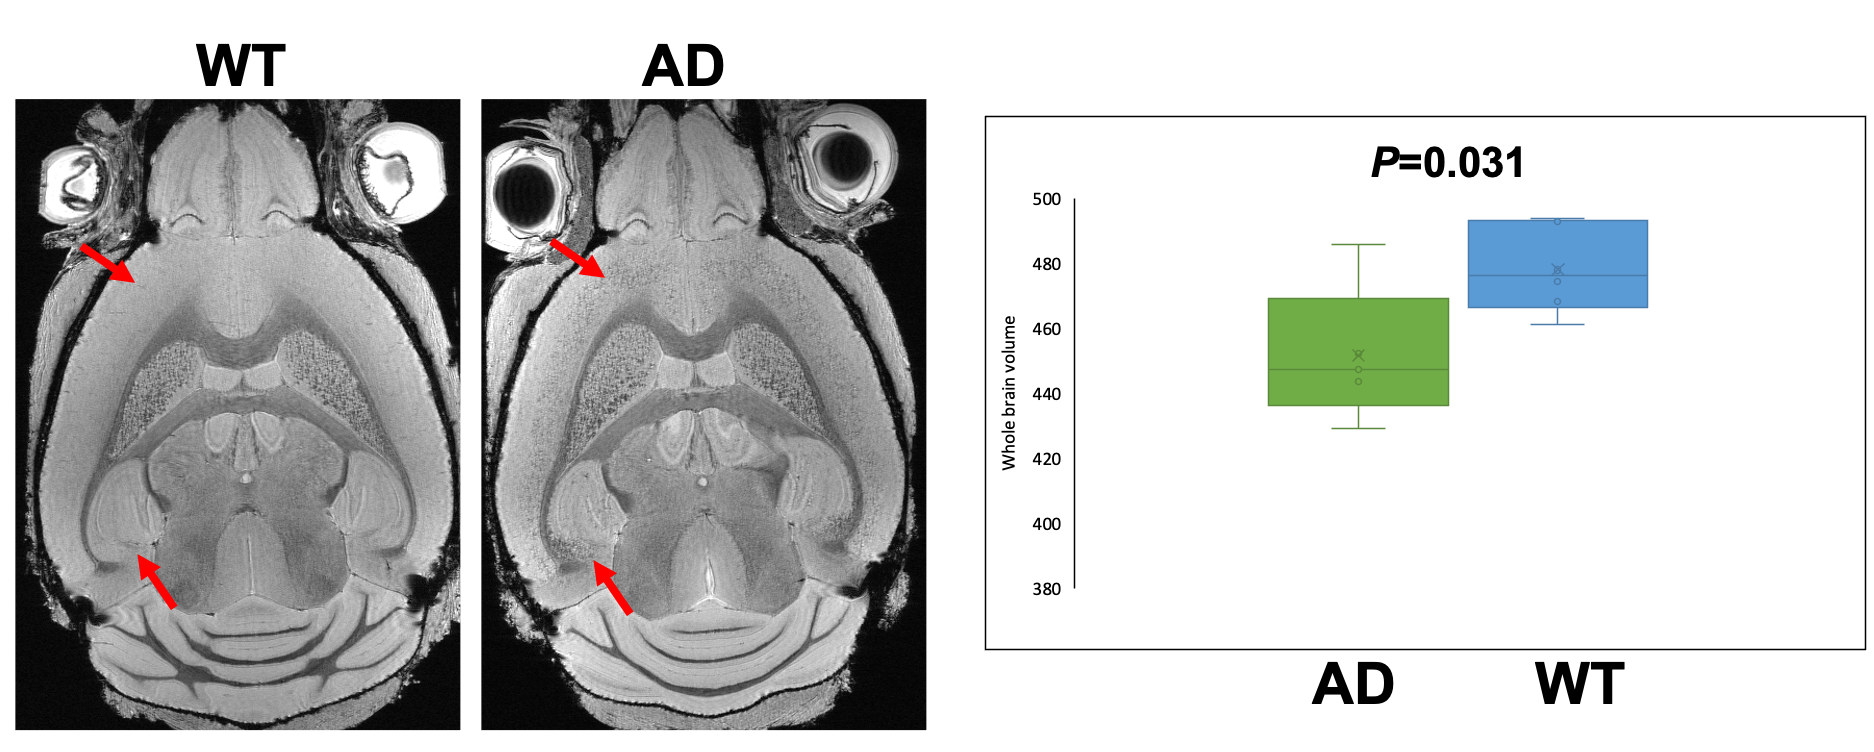
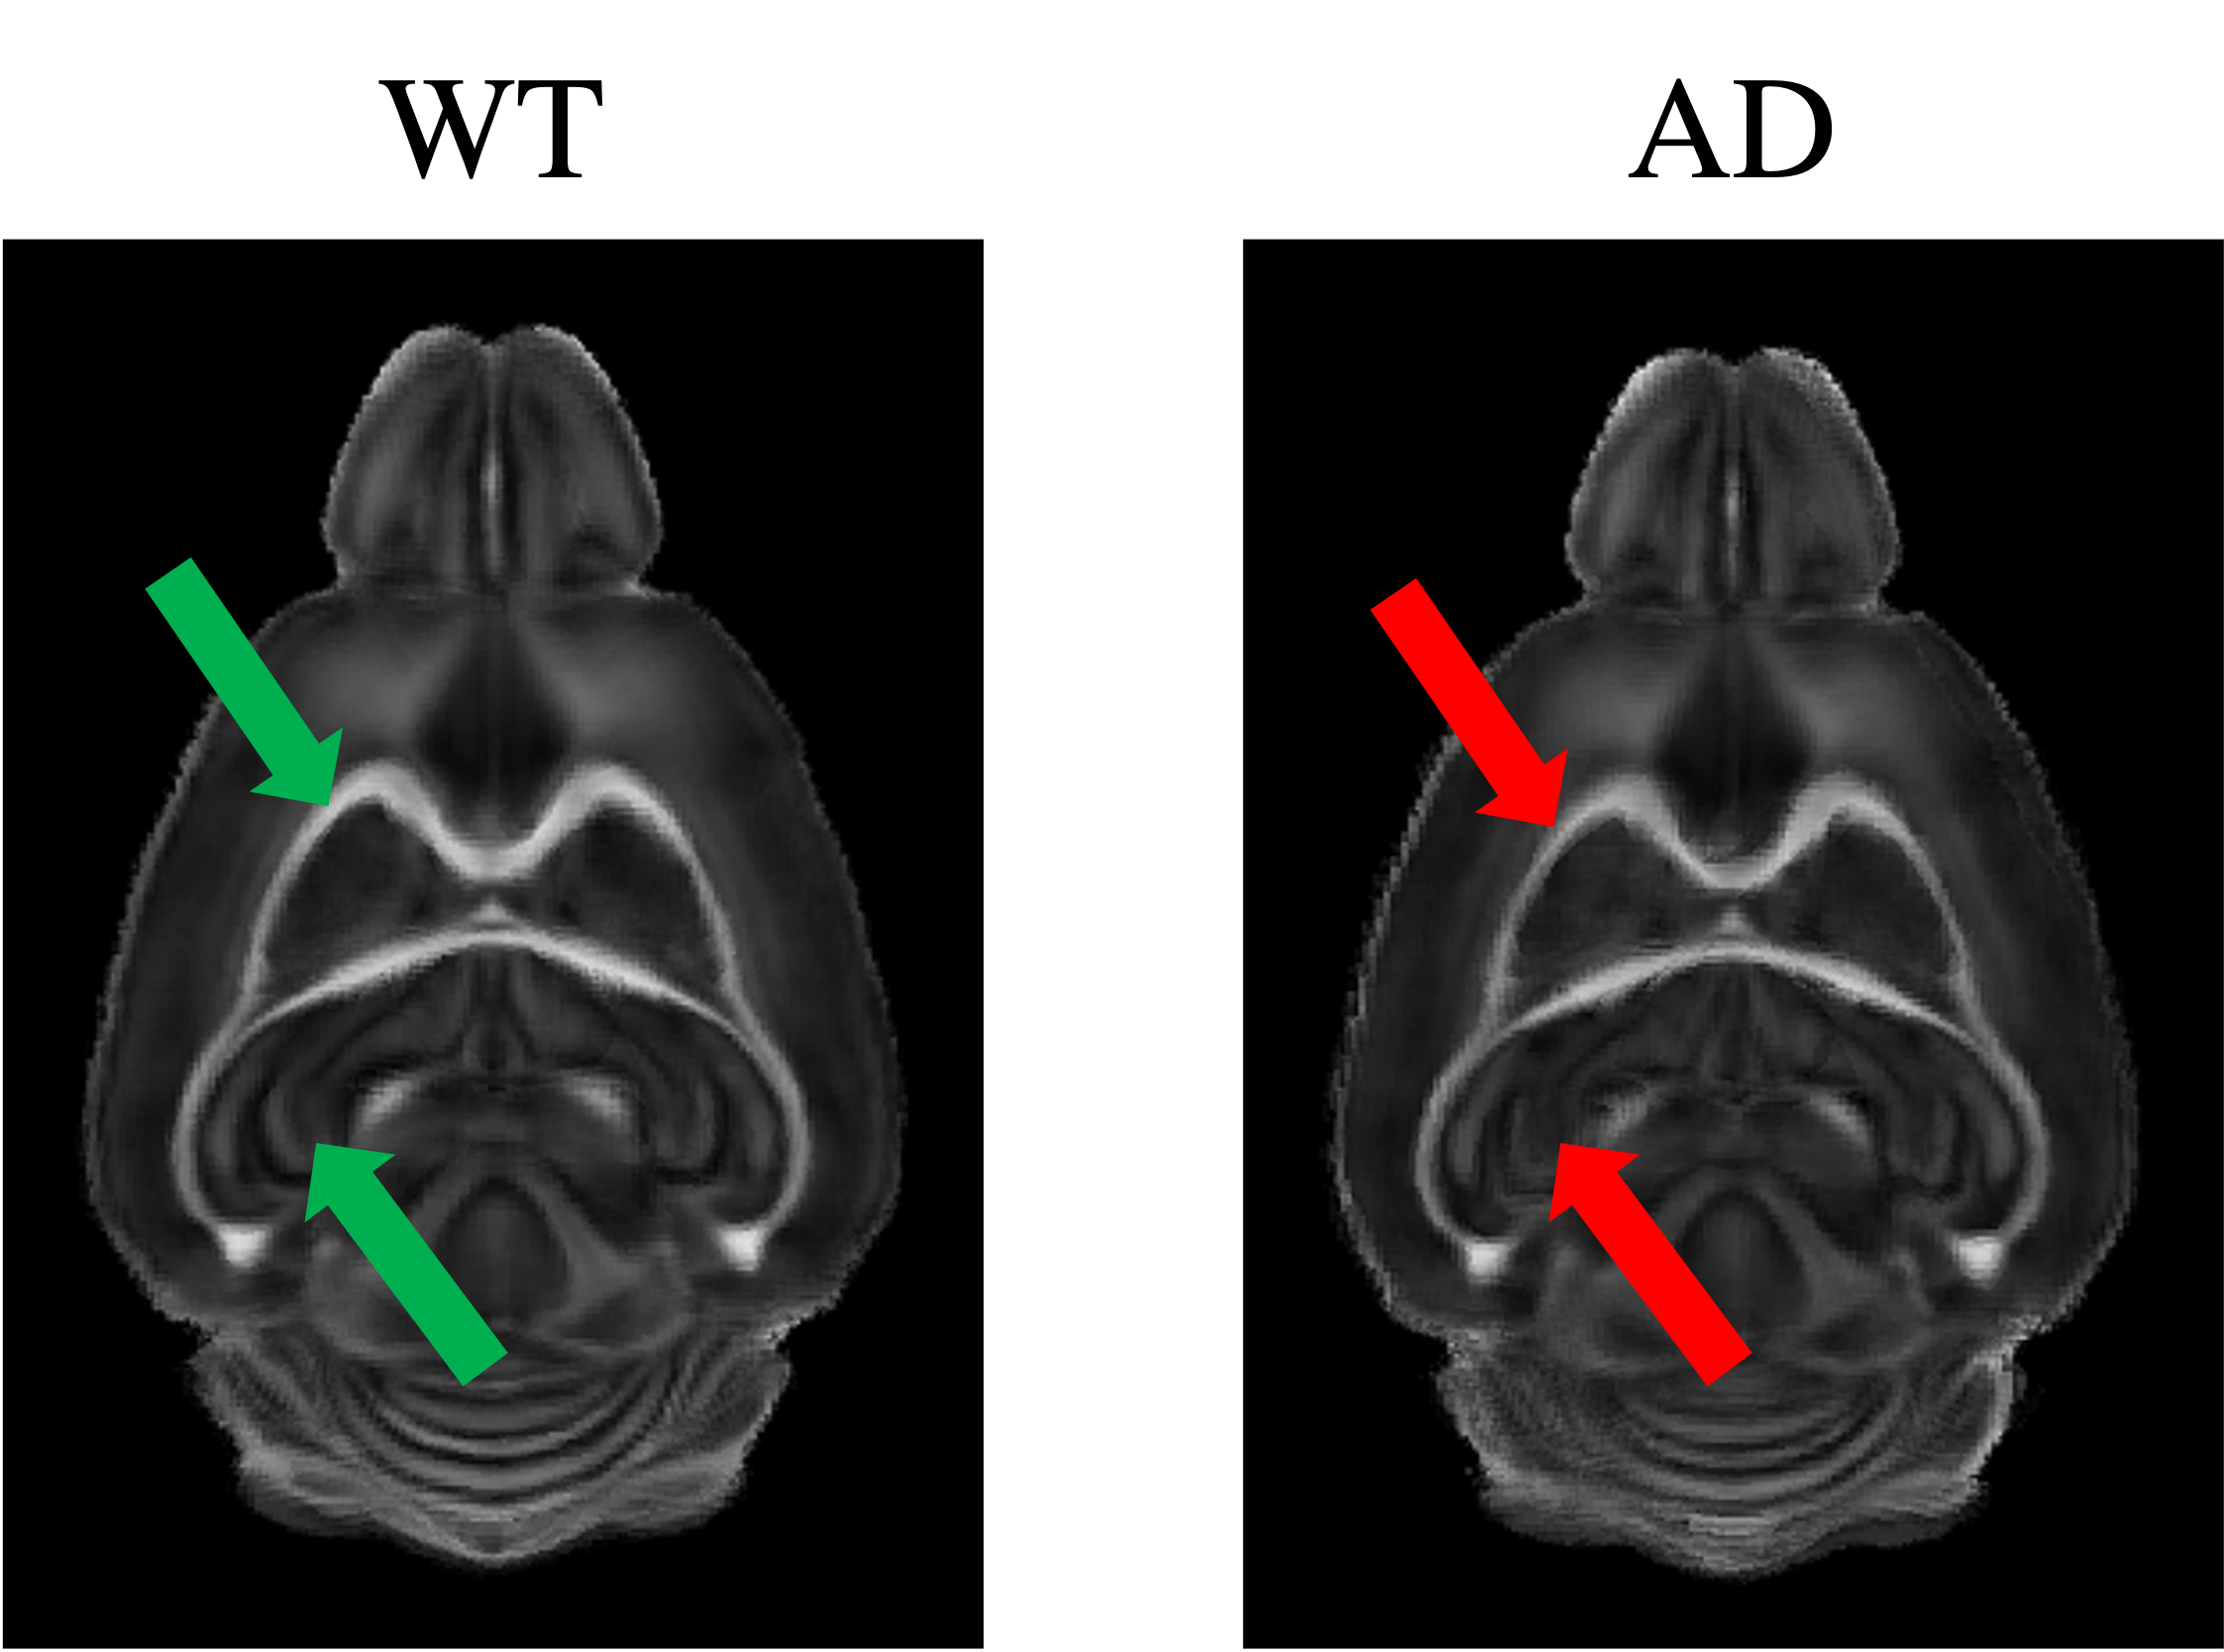
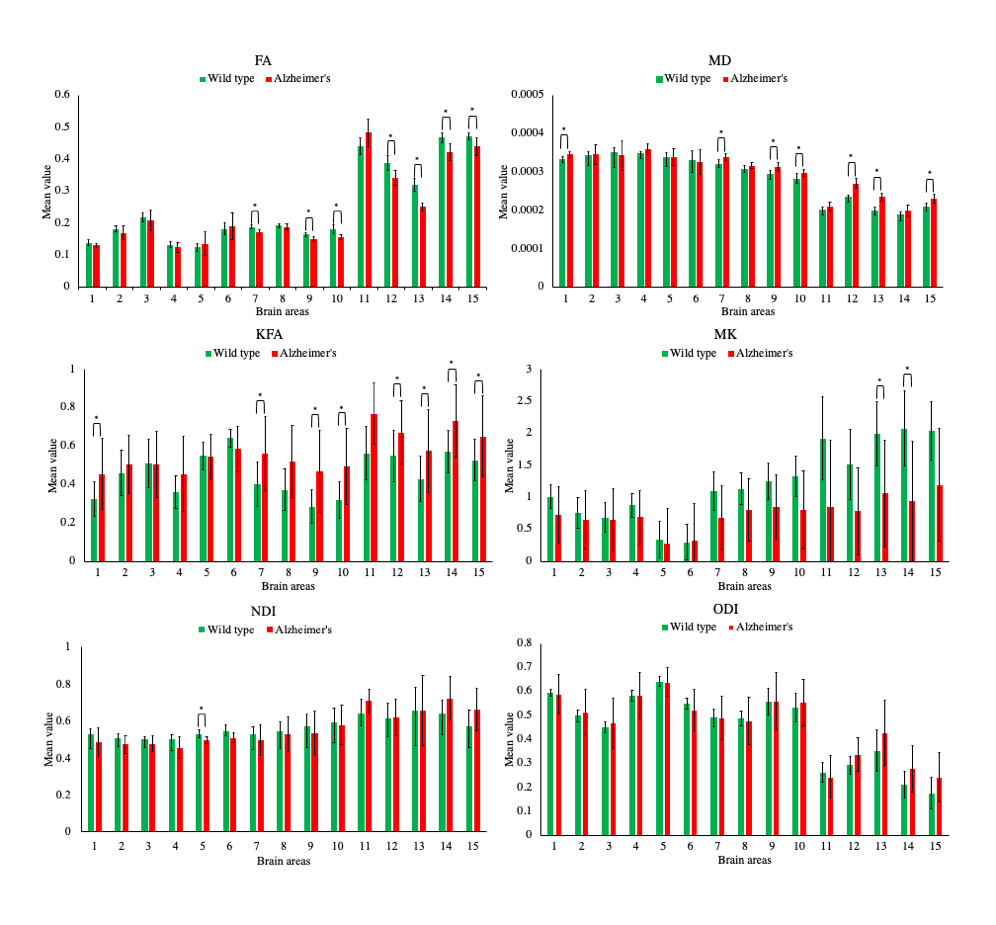
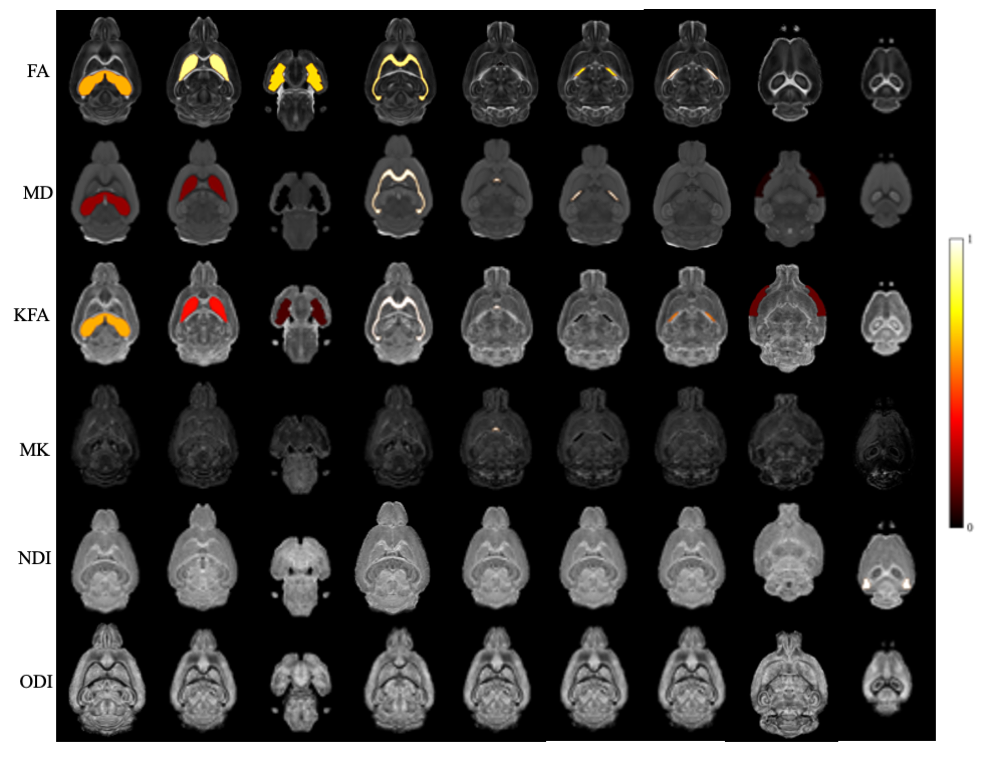
Figure 1 shows a representative slice of both WT and AD mice 'brains. The hypo intensity signals are evident in the cortex and hippocampus of AD mice (red arrows). The brain volume of AD mice is significantly smaller than that of WT (p=0.031). Figure 2 demonstrates the difference in FA maps between AD and WT groups, where corpus callosum and hippocampus show lower FA values in the AD group Figure 3 shows the bar diagram for the mean values of FA, MD, KFA, MK, NDI and ODI for 15 brain regions. . The t-score with p-value is shown in Figure 4. Figure 5 illustrates the image metrics with statistically significant ROIs overlaid on different quantitative maps.Discussion
The study showed differences in mean value of DTI, DKI and NODDI metrics. This difference could be exploited to diagnose Alzheimer's disease using dMRI. Yet, further improvements and optimization in the DTI, DKI and NODDI processing pipeline can be performed to increase the sensitivity of these techniques. The results are preliminary yet promising for the diagnosis of Alzheimer’s disease in mice brain. We also intend to incorporate whole brain regions in the future to obtain the complete perspective of AD.Conclusion
To sum up, we conclude that this study demonstrated a difference in DTI, DKI and NODDI metrics between AD and WT groups. The differences are strongly dependent on different dMRI models. The quantitative metrics derived from diffusion MRI could be used as imaging biomarkers for detecting AD.Acknowledgements
The authors thank Roberts Translational Imaging Facility and STARK Neuroscience Research Institute for resource support.References
1. Hagmann, P. et al. Understanding Diffusion MR Imaging Techniques: From Scalar Diffusion-weighted Imaging to Diffusion Tensor Imaging and Beyond. RadioGraphics 26, S205–S223 (2006).
2. Oishi, K., Mielke, M. M., Albert, M., Lyketsos, C. G. & Mori, S. DTI Analyses and Clinical Applications in Alzheimer’s Disease. J. Alzheimers Dis. 26, 287–296 (2011).
3. Basser, P. J., Mattiello, J. & LeBihan, D. MR diffusion tensor spectroscopy and imaging. Biophys. J. 66, 259–267 (1994).
4. Wang, N. et al. Neurite Orientation Dispersion and Density Imaging of Mouse Brain Microstructure. Brain Struct. Funct. 224, 1797–1813 (2019).
5. Steven, A. J., Zhuo, J. & Melhem, E. R. Diffusion Kurtosis Imaging: An Emerging Technique for Evaluating the Microstructural Environment of the Brain. Am. J. Roentgenol. 202, W26–W33 (2014).
6. Zhang, H., Schneider, T., Wheeler-Kingshott, C. A. & Alexander, D. C. NODDI: practical in vivo neurite orientation dispersion and density imaging of the human brain. NeuroImage 61, 1000–1016 (2012).
7. Veraart, J. et al. Denoising of diffusion MRI using random matrix theory. NeuroImage 142, 394–406 (2016).
8. Kellner, E., Dhital, B., Kiselev, V. G. & Reisert, M. Gibbs-ringing artifact removal based on local subvoxel-shifts. Magn. Reson. Med. 76, 1574–1581 (2016).
9. Garyfallidis, E. et al. Dipy, a library for the analysis of diffusion MRI data. Front. Neuroinformatics 8, 8 (2014).
10. Daducci, A. et al. Accelerated Microstructure Imaging via Convex Optimization (AMICO) from diffusion MRI data. NeuroImage 105, 32–44 (2015).
11. Avants, B. B. et al. A Reproducible Evaluation of ANTs Similarity Metric Performance in Brain Image Registration. NeuroImage 54, 2033–2044 (2011).
Figures