4034
Phase-Contrast MRI for Quantifying Cerebrospinal Flow in Patients with Shunted Hydrocephalus1Division of Neurosurgery, Children's Hospital of Los Angeles, Los Angeles, CA, United States, 2Radiology, Children's Hospital of Los Angeles, Los Angeles, CA, United States, 3Keck School of Medicine, University of Southern California, Los Angeles, CA, United States, 4Shared last author, Los Angeles, CA, United States, 5Fetal and Neonatal Institute, Division of Neonatology, Department of Pediatrics, Children's Hospital of Los Angeles, Los Angeles, CA, United States
Synopsis
We investigate a new approach to assess ventricular shunt function using phase-contrast magnetic resonance imaging (PC MRI). A flow phantom was constructed to assess CSF flows between 0-24 ml/hour. The PC MRI sequence showed strong flow correlation (R2 = .9671) even for flow velocities below 1 cm/s. The lowest non-zero CSF flow we measured was 1 ml/hour (0.02 cm/s), 67% lower than previously reported shunt flow measurements. The sequence was tested in a human subject after phantom calibration. With a 96 second duration, PC SHUNT shows promise as a practical means for determining shunt failure clinically.
INTRODUCTION
Hydrocephalus is an excessive accumulation of cerebrospinal fluid (CSF) within the ventricles of the brain commonly treated with shunts. Over time, shunts can become blocked, causing a relapse of the accumulation of CSF in the ventricles and increasing risk of brain damage and death. Between 30% and 40% of shunts malfunction within the first year and the rate of shunt failure increases every year thereafter, requiring surgical intervention.1–5 Patients with shunted hydrocephalus require ongoing monitoring to verify shunt function. Currently, shunt failure can be assessed by a combination of shunt tap, radionuclide shunt studies and diagnostic imaging. Shunt taps and radionuclide studies are invasive while CT scans can pose radiation risk to young patients. MRI is safe, non-invasive, and already used to monitor shunted patients. In this study, we investigate the use of PC SHUNT, a magnetic resonance (MR) sequence to measure CSF flow through the shunt lumen.METHODS
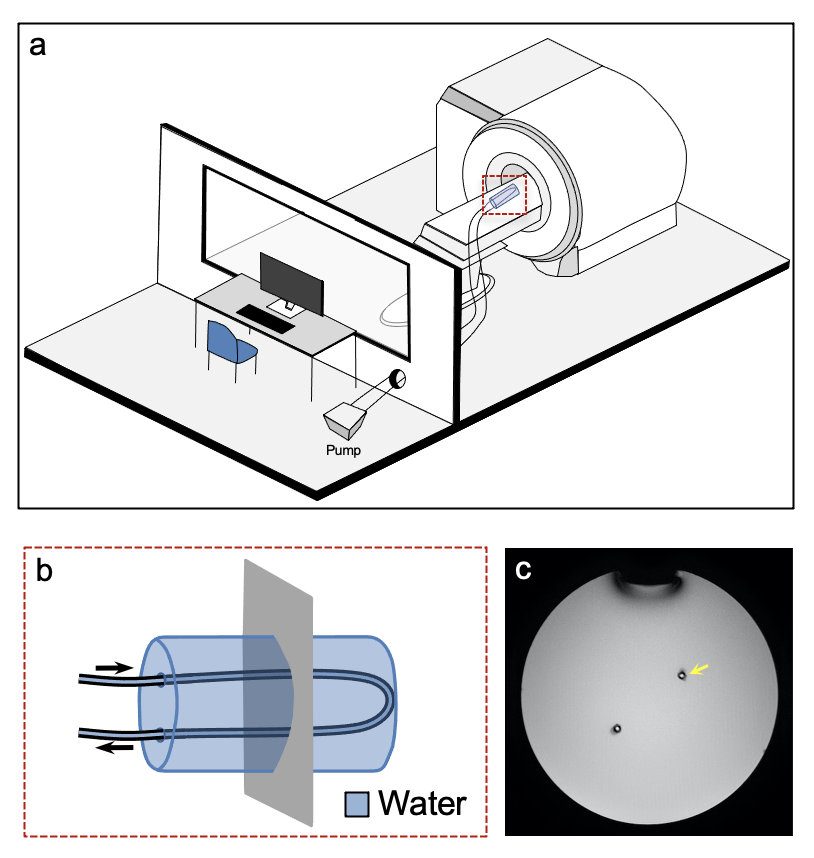
This IRB-approved (CHLA-20-00041) study was conducted at Children’s Hospital Los Angeles a Philips Achieva 3T MR scanner (Best, the Netherlands). Sequence parameters for PC SHUNT were as follows: TR=47 ms; TE=30 ms; FOV=30x30 mm; slice=10 mm; NSA=2; matrix, 92 × 91; voxel=0.33 ×0.33 mm; BW=48 Hz/pixel; and velocity encoding gradient (Venc)=1 cm/s. A patch was prepared using the Philips PARADISE pulse programming environment to allow scanning of Venc values below 1 cm/s and tested using additional Venc values of 0.5 and 5 cm/s.Phantom A flow phantom was constructed by placing a shunt catheter with 1.2 mm inner diameter in a water bottle approximating the magnetic susceptibility of surrounding parenchyma. A calibrated peristaltic pump (Masterflex, Gelsenkirchen, Germany) provided known flow rates; the flow was validated with an analytical balance (Mettler Toledo, Columbus, Ohio) (Figure 1).
The phantom was imaged with a single slice perpendicular to the catheter at 19 velocities from 0 to 0.82 cm/s (Figure 1c). Measurements were repeated 5 times to calibrate PC SHUNT and assess measurement error.
Subject A single shunted patient (stable, not sedated) with a shunt catheter matching the phantom was scanned using PC SHUNT (male, 6 years old). PC SHUNT (acquisition time = 96 second) with Venc =1 cm/s was added following clinical imaging. The PC SHUNT imaging plane was placed perpendicular to the shunt catheter and approximately 2 cm inferior to the shunt valve.
Analysis Image analyses were performed using Horos (Nimble Co LLC d/b/a Purview, Annapolis, MD USA) and custom software developed in MATLAB (Mathworks, Natick, MA). CSF velocity was measured by recording the average velocity from a 1.2 mm circular ROI in the center of the lumen. Mass flow rates via analytical balance were converted to flow profiles assuming laminar flow in the catheter. Voxels were sampled along the diameter of the lumen to create a velocity profile of the flow within the shunt catheter. Voxels near catheter walls with standard deviation greater than voxel magnitude were recorded as having a value of 0 cm/s.
RESULTS
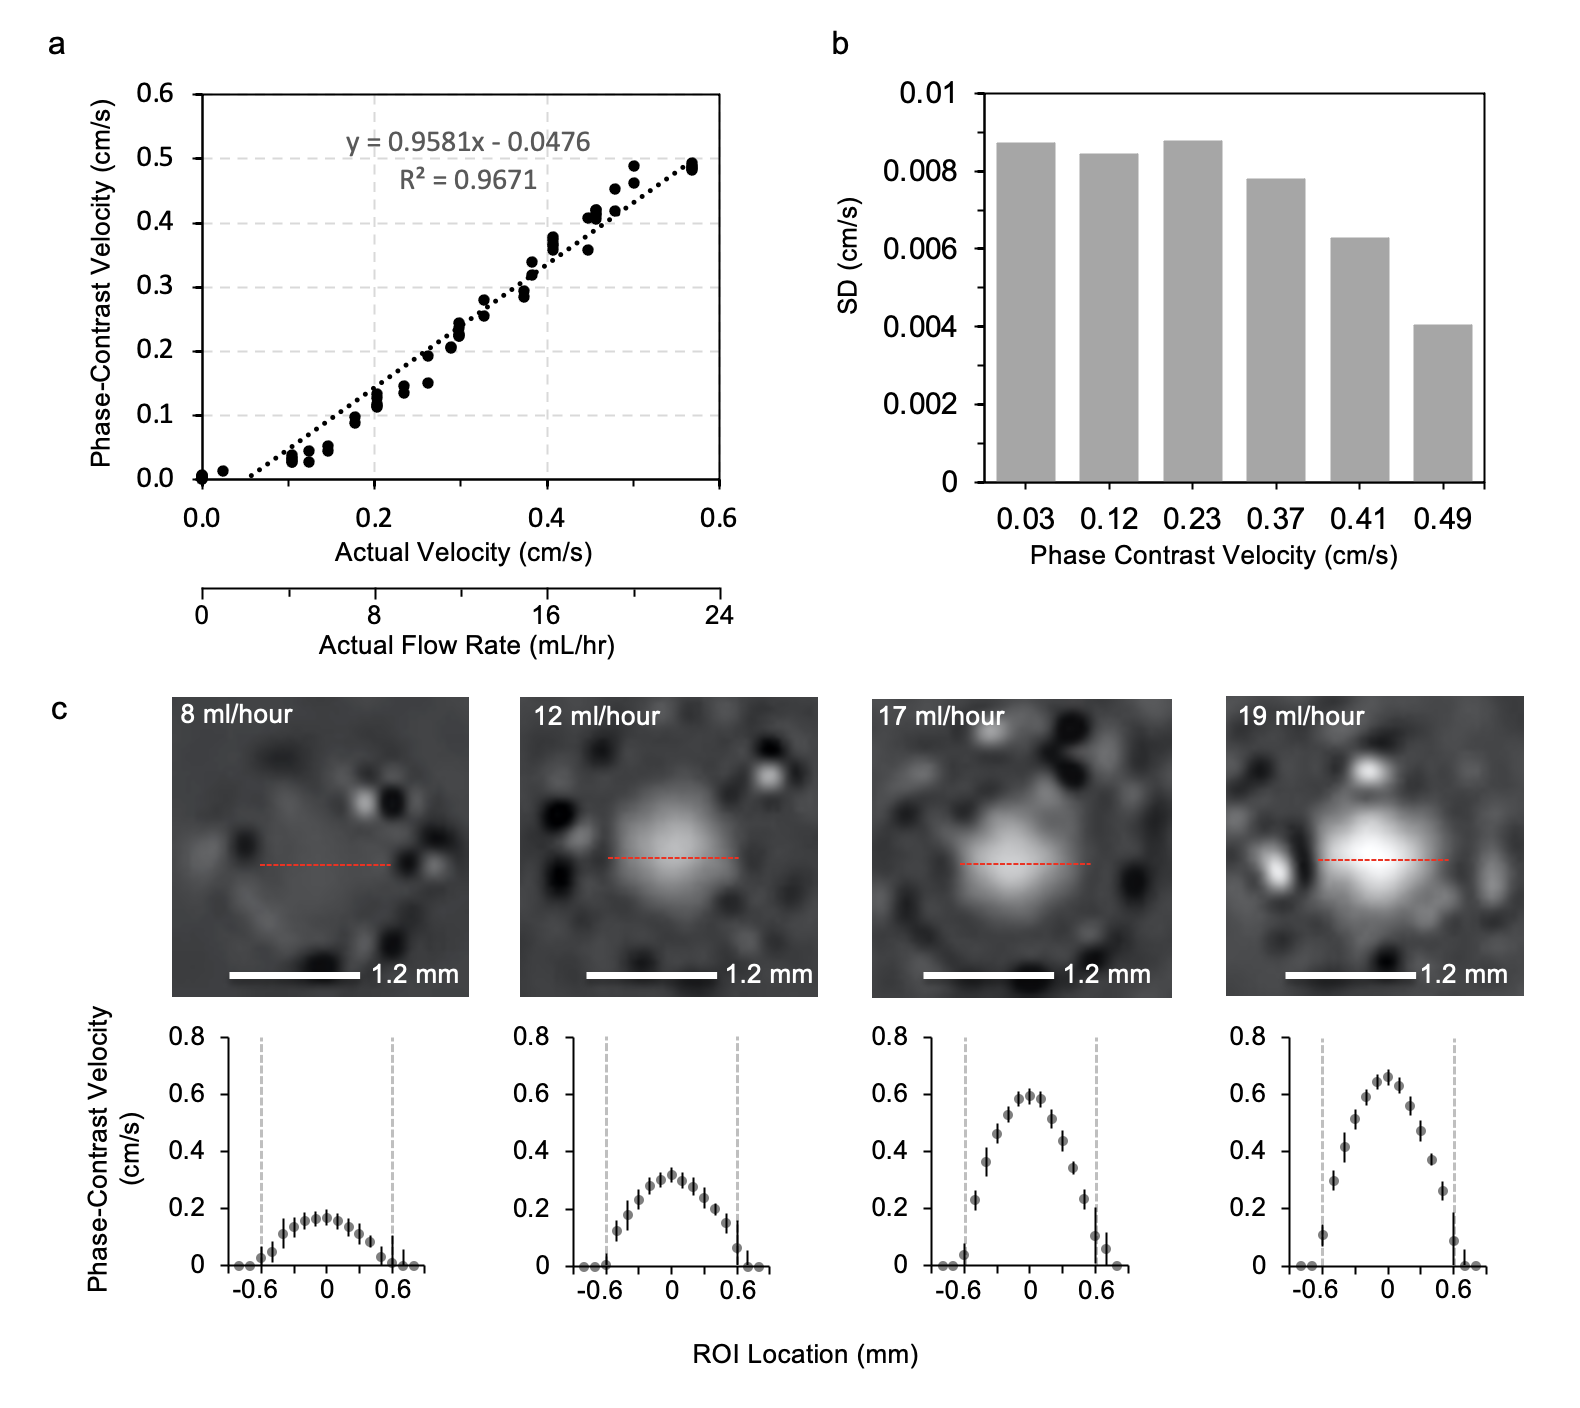
Figure 2a illustrates phantom measurements using PC SHUNT. Flow values measured by MRI and analytical balance were linearly correlated (R2 = 0.9671). PC SHUNT measured velocity down to 0.02 cm/s. Comparison of SD (Figure 2b) demonstrates decreased SD with increased flow rate.Velocity profiles were generated using voxels along the diameter of the lumen at four different flow settings (Figure 2c). The measured flow profile resembled laminar flow; velocity overestimation near catheter walls was attributed to partial volume effects.
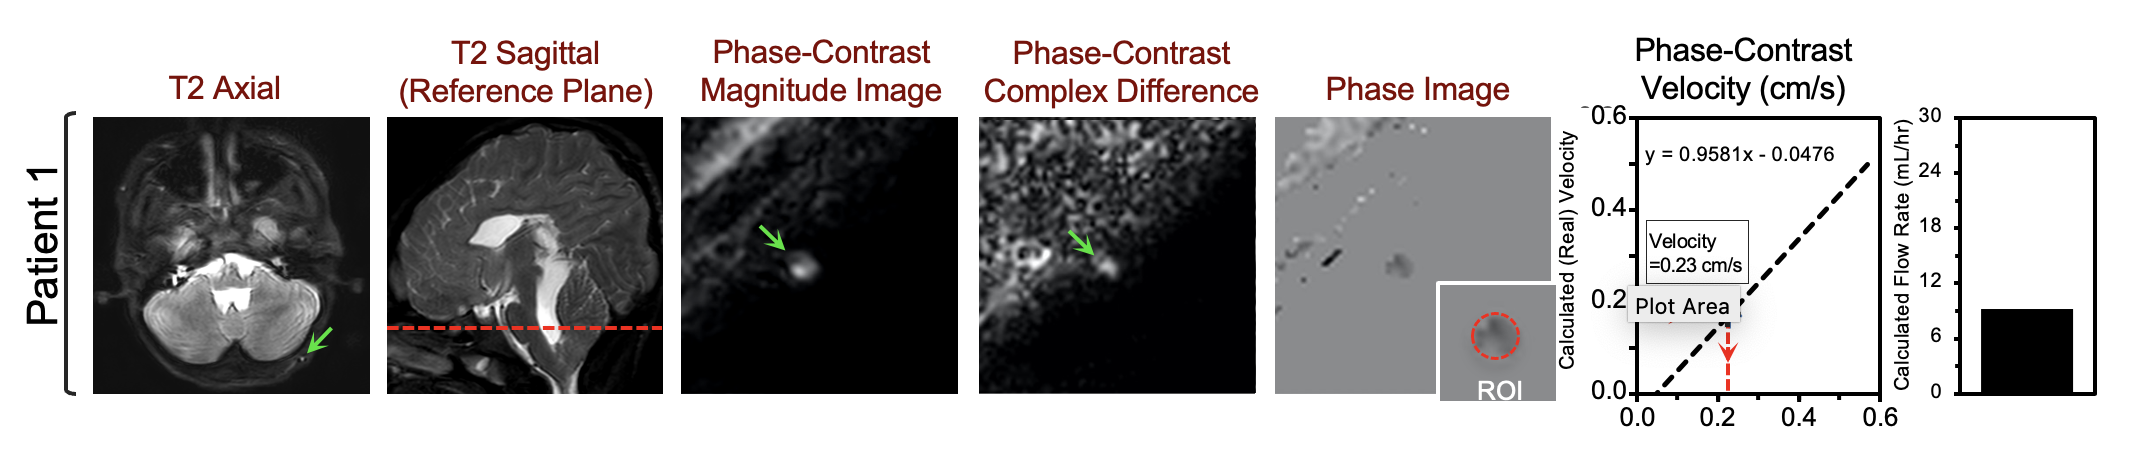
Figure 3 shows the calculated velocities and CSF flow rates from the in vivo study. The patient’s phase-contrast measured flow rate was 0.17 cm/s, correlating to a calibrated velocity of 0.35 cm/s. This measurement fell within the range of our phantom calibration experiments as well as the Venc setting of 1 cm/s.
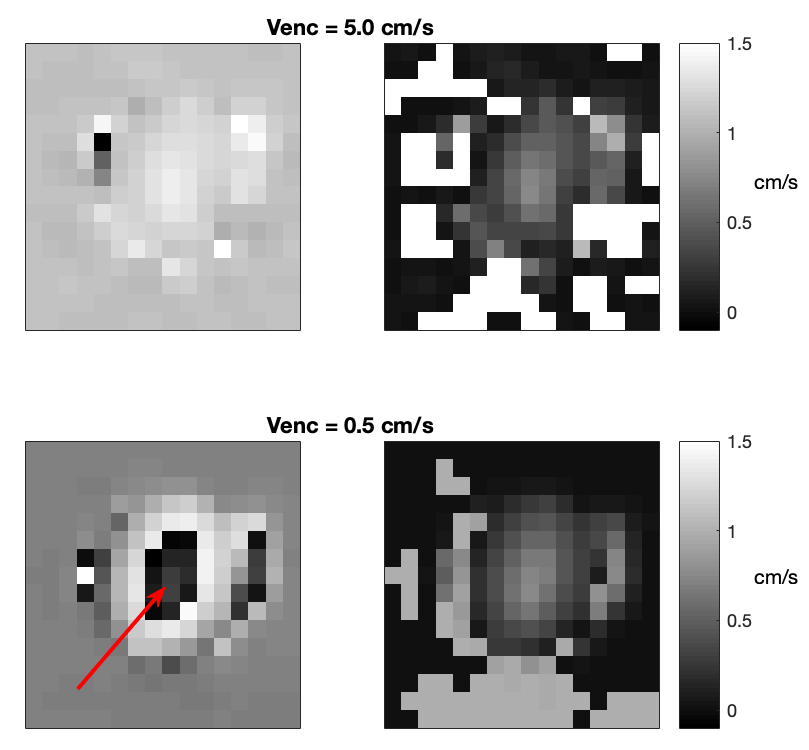
Figure 4 demonstrates the phase wrapping present when the flow velocity exceeds Venc and the correction of the low Venc image using data from higher Venc images.
DISCUSSION
PC SHUNT is a non-invasive, flow-quantifying scan that can be integrated into clinical MR workflows without significantly increasing exam duration. Despite PC commonly being used for higher flow velocities, the phantom data demonstrates strong correlation between known flow rates below 1 cm/s and those determined via PC SHUNT; further PC SHUNT accurately demonstrated absence of flow. The PC SHUNT minimum velocity measured was 67% lower than previously measured flow values in a shunt.6 However, the increase in SD for lower flow rates suggests that matching Venc to flow velocity may yield more accurate results. Additionally, our results show proof of concept for correcting phase wraps in PC data, allowing for a wide range of Venc values to be assessed without advance knowledge of the flow velocity. Subsequent work will aim to gather more in vivo PC SHUNT in patients to assess its efficacy relative to existing tests.CONCLUSION
Our work demonstrates that clinical evaluation of shunt malfunction may benefit from the implementation of phase-contrast MRI. PC SHUNT non-invasively quantifies a range of physiological flow values.Acknowledgements
No acknowledgement found.References
1. Browd, S. R., Ragel, B. T., Gottfried, O. N. & Kestle, J. R. W. Failure of Cerebrospinal Fluid Shunts: Part I: Obstruction and Mechanical Failure. Pediatric Neurology 34, 83–92 (2006).
2. Kestle, J. et al. Long-Term Follow-Up Data from the Shunt Design Trial. PNE 33, 230–236 (2000).
3. Rossi, N. B. et al. Predicting shunt failure in children: should the global shunt revision rate be a quality measure? Journal of Neurosurgery: Pediatrics 17, 249–259 (2016).
4. Stein, S. C. & Guo, W. Have we made progress in preventing shunt failure? A critical analysis. Journal of Neurosurgery: Pediatrics 1, 40–47 (2008).
5. McGirt, M. J. et al. Cerebrospinal Fluid Shunt Survival and Etiology of Failures: A Seven-Year Institutional Experience. PNE 36, 248–255 (2002).
6. Hara, M. et al. A new method for measuring cerebrospinal fluid flow in shunts. Journal of Neurosurgery 58, 557–561 (1983).
Figures