4032
Regional Brain Volumes, Cortical Thickness, Folding and Sulcal Depth in Perinatally HIV-Infected Youths1Radiological Sciences, University of California-Los Angeles, Los Angeles, CA, United States, 2School of Nursing and Brain Research Institute, University of California-Los Angeles, Los Angeles, CA, United States, 3Radiology and Biomedical Imaging, University of California-San Francisco, San Francisco, CA, United States, 4Psychiatry and Behavioral Sciences, Emory University, Atlanta, GA, United States, 5Pediatrics, The Lundquist Institute, Harbor-UCLA Medical Center, Torrance, CA, United States
Synopsis
The human immunodeficiency virus (HIV) can affect the morphometry of the developing brain of perinatally HIV (PHIV)-infected youths. Surface-based morphometric analysis can reveal if local effects on gray and white matter volumes is significant in the regions with alterations in cortical thickness (CT), gyrification index (GI), or sulcal depth (SD). So, we compared these morphometric parameters of 19 PHIV-youths on combination antiretroviral therapy with those in 26 uninfected healthy controls. PHIV-youths had altered gray and white matter regional volume, CT, GI, and SD, partly in overlapping regions. The findings survived multiple comparisons using both false discovery rate and Holm-Bonferroni corrections.
Introduction
The success of combined antiretroviral therapy (cART) has reduced the risk of major neurological complications in perinatally HIV (PHIV)-infected youth, thereby significantly improving life expectancy (1-2). However, HIV-associated neurocognitive disorders (HAND) continue to be widely prevalent among PHIV-youths (3-5). Previous publications have reported volumetric and surface area changes in different brain regions of PHIV-youths compared with healthy controls (HC) (6-11). However, the reported high variability in these structural group differences indicate that the reported information is inconclusive and further studies may lead to a better understanding of the morphometric alterations in the brain of PHIV-youths (12). The variability in reports can be attributed to different factors, including but not limited to differences in socioeconomic status, health conditions, and medical comorbidities like psychiatric disorders or drug use (12). The purpose of this study is to use cutting-edge structural MRI data to measure regional grey matter (GM) and white matter (WM) volumes, as well as to determine the variations in cortical thickness (CT), gyrification index (GI), and sulcal depth (SD) in a group of PHIV-youths and HIV-negative controls selected with an active psychiatric diagnosis based exclusion criteria.Materials and Methods
We investigated nineteen PHIV-youths (mean age:18.7±3.9yrs, range 14–29yrs, m/f 8/11) and twenty-six HC (mean age:19.6±3.7yrs, range 13-28, m/f 14/12). From PHIV-youths, we obtained age at first treatment, HIV viral load, highest viral load, current antiretroviral therapy (yes/no), and presence/absence of HIV encephalopathy. We excluded volunteers with current alcohol or other substance use/abuse, current or past attention deficit disorder, active depression or other psychiatric diagnoses, metabolic disturbances, metallic implants, claustrophobia, pregnancy, and non-HIV-related brain diseases. All MRI studies were performed on a Siemens 3T Prisma MRI scanner using a 16-channel phased-array head 'receive' coil. High-resolution T1-weighted images were acquired using an MPRAGE sequence with TR/TE=2200/2.41ms, inversion time=900ms, flip angle=9°, matrix size=320×320, FOV=230×256mm2, slice thickness=0.9 mm, 192 slices.Voxel-based and surface-based morphometric analyses were performed using the MATLAB Computational Anatomy Toolbox (CAT12.7(1700), http://dbm.neuro.uni-jena.de/cat/), which is an extension of SPM12 (https://www.fil.ion.ucl.ac.uk/spm/software/spm12/) (13-14). An independent 2-sample t-test was used to compare PHIV-youths with controls on imaging outcome measures. A p-value<0.001 was used for GM and WM volume measures in voxel-based morphometry to limit type 1 errors. We used a p<0.05 threshold for region-of-interest analysis (surface measurements) with Holm-Bonferroni and false discovery rate (FDR) corrections. Age and gender were included as covariates in the analysis of CT, while total intracranial volume (TIV), age, and gender were used to analyze GM and WM volumes, GI, and SD.
Results
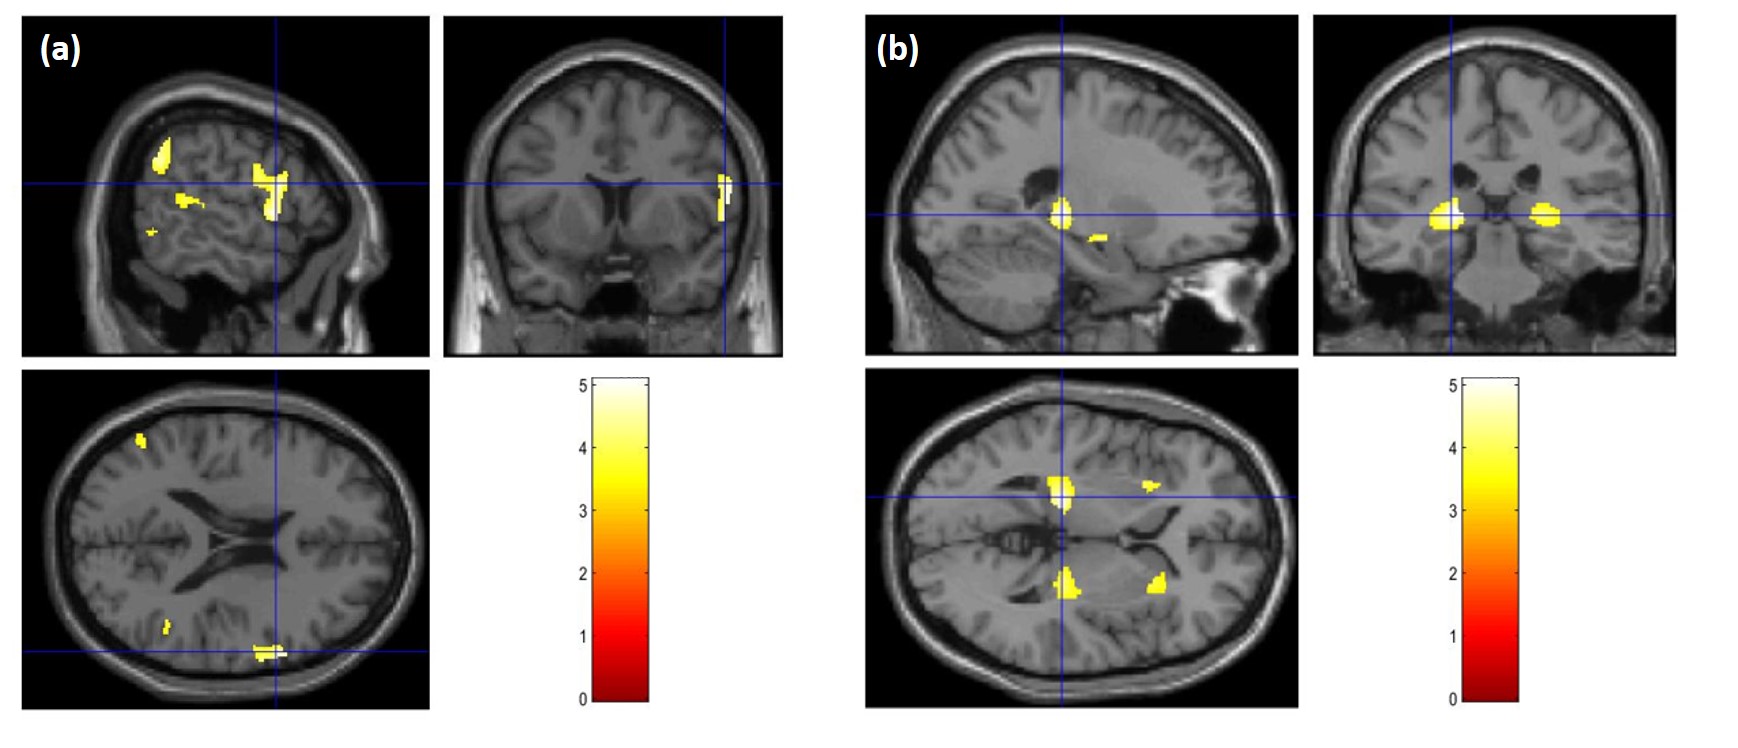
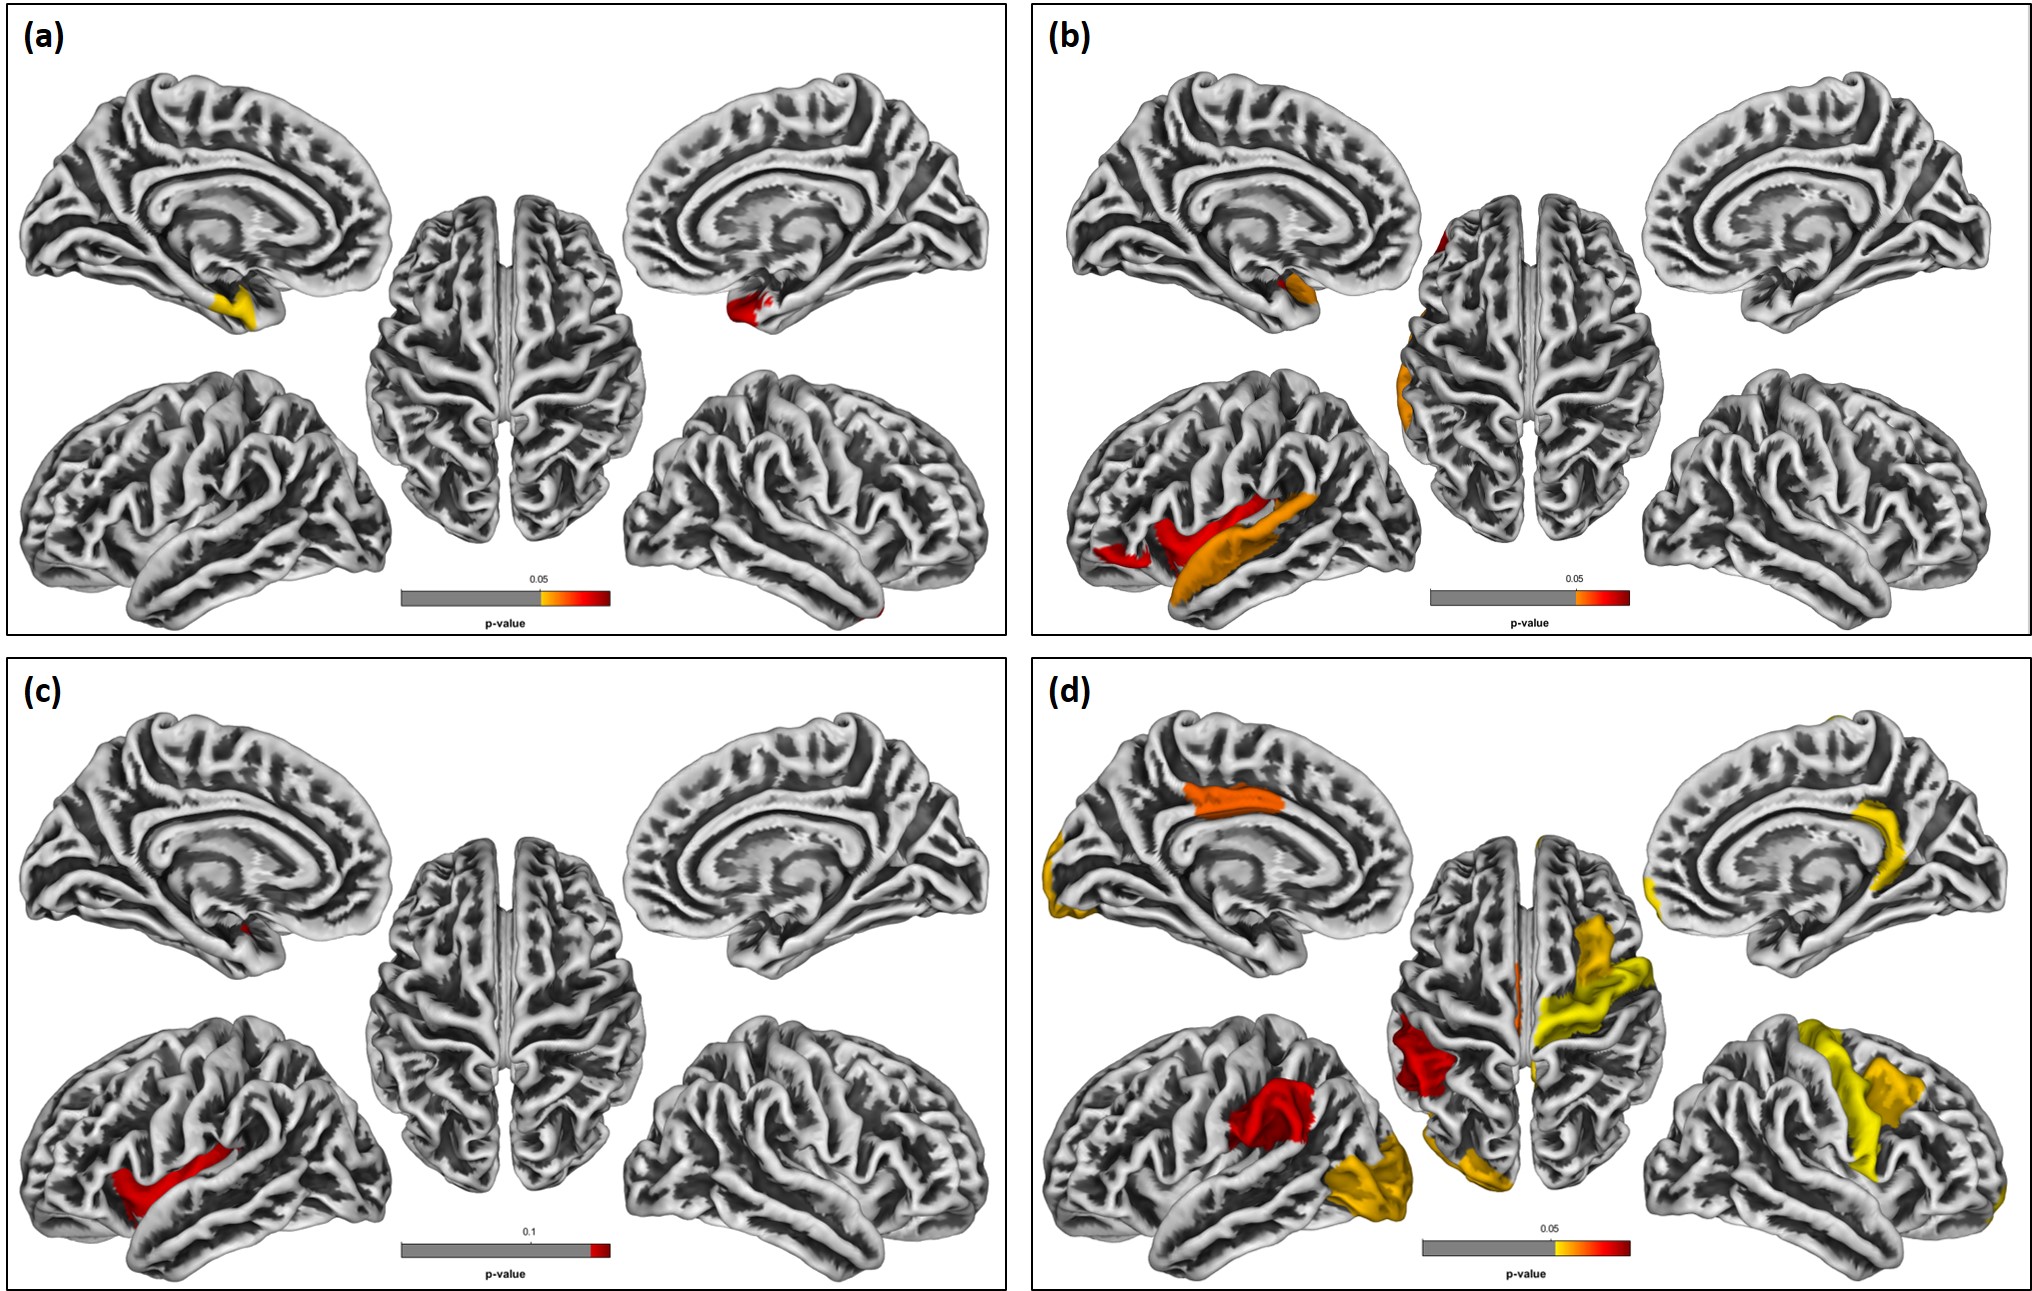
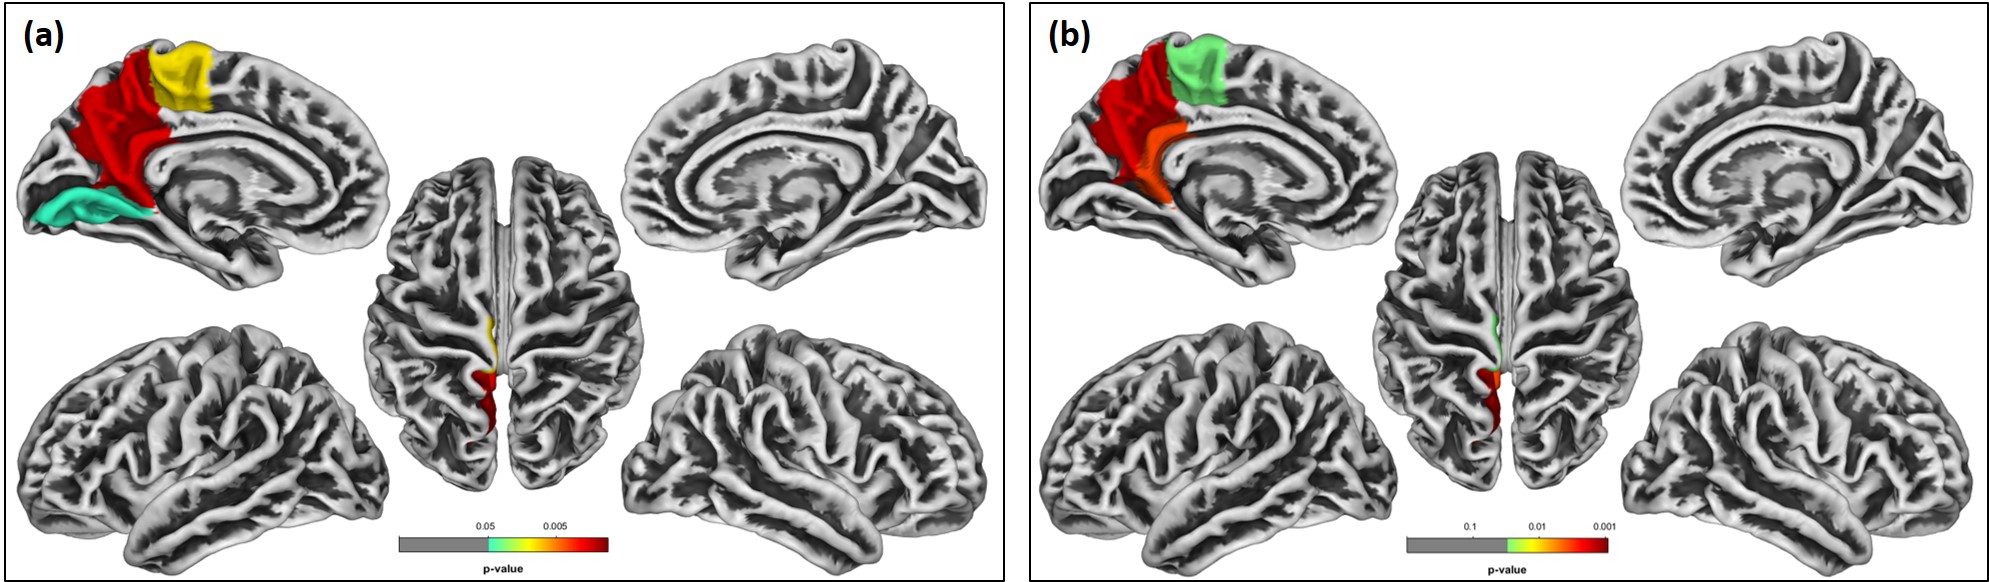
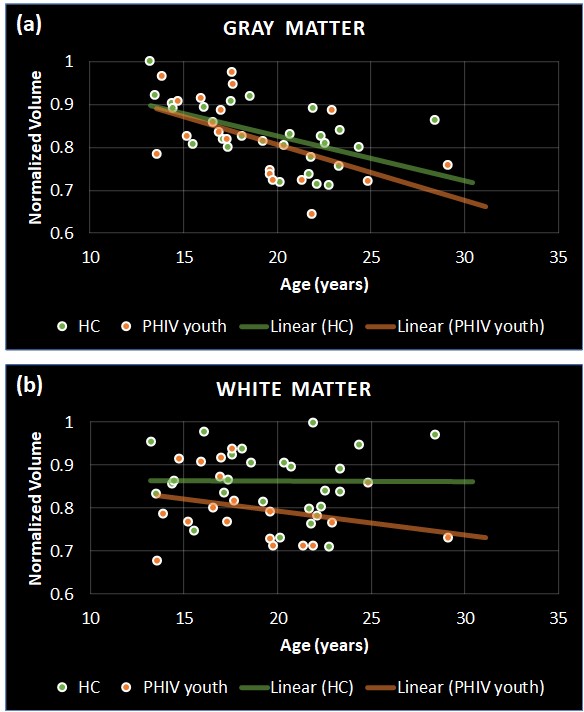
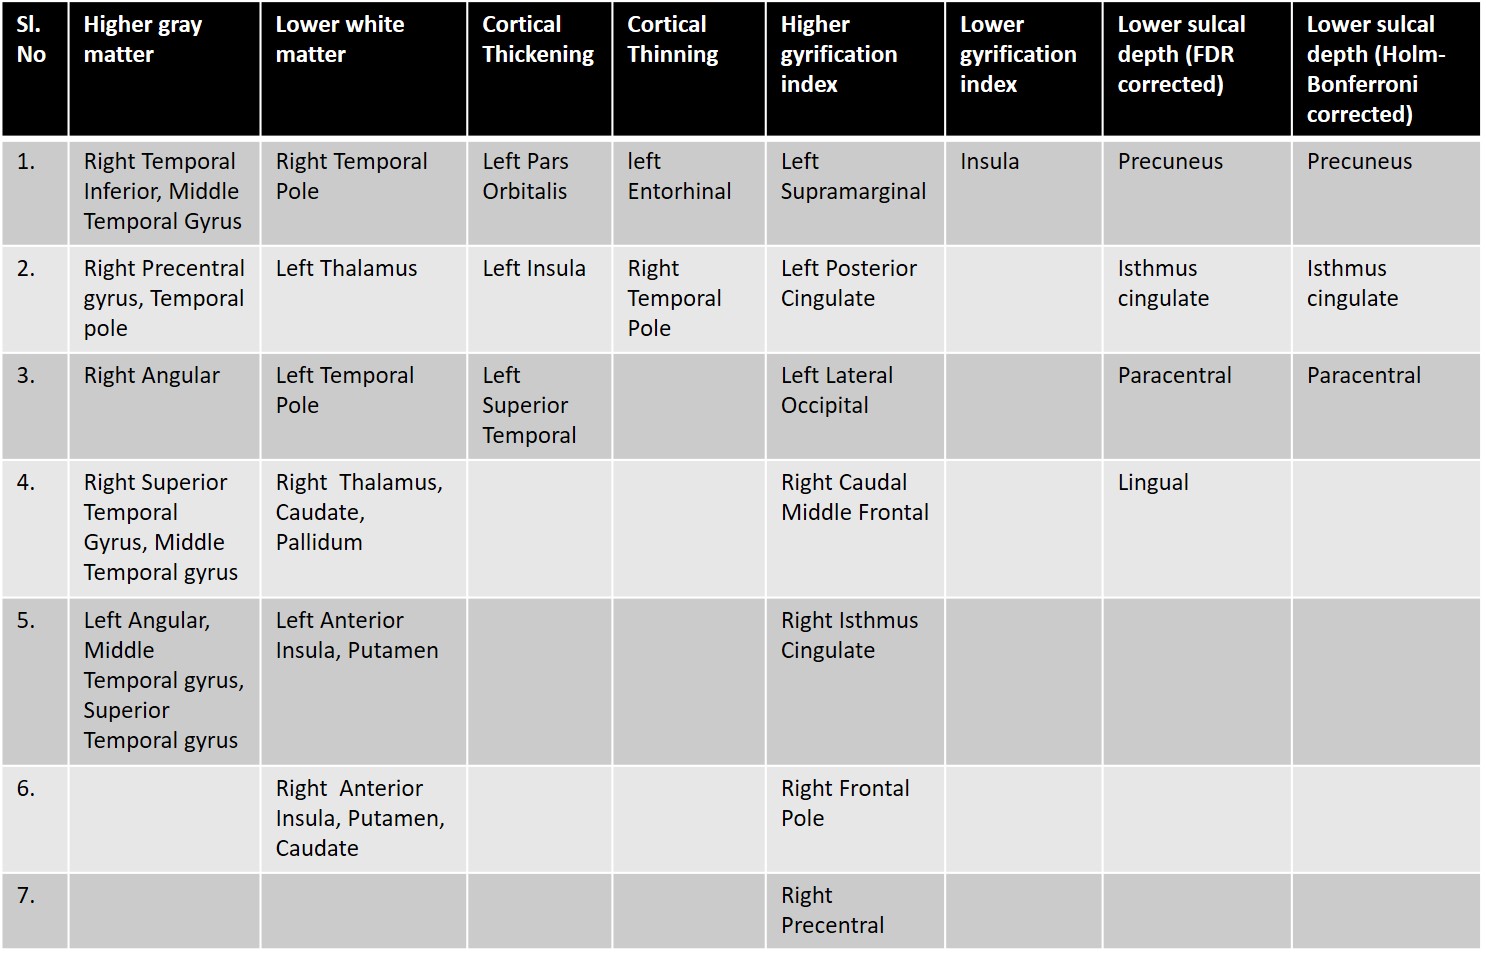
Significant differences were observed in PHIV-youths compared to HC despite the demographic similarities and cART. Fig 1a shows the regions with larger GM volume in PHIV-youths compared to HC. Whereas we identified no regions with smaller GM in the PHIV-youths, we noted smaller WM volume in regions demonstrated in Fig 1b. Fig 2a and b show regions identified with cortical thickening and thinning, respectively, and Fig 2c and d show regions with greater and smaller GI. Fig 3a and b shows regions with lower SD after FDR and Holm-Bonferroni corrections, respectively. No regions with greater SD were identified. Labels for the regions shown in Figs 1-4 are shown in Table 1. Finally, Fig 4 shows plots of GM and WM volumes versus age. We detected significant negative correlations of age with total GM volume in both HC (P = 0.004) and PHIV-youths (P = 0.017), which was also significant in females but not males. This GM decline with age appeared accelerated in PHIV-youths compared to HC (cf. Fig 4a).Discussion
Our results demonstrate larger GM and smaller WM volumes in PHIV-youths compared to healthy controls, which is consistent with an earlier study on PHIV-youths (7). According to (15), these larger GM volumes could be related to cortical thickening and/or less cortical folding (lower GI). Earlier reports suggested that cortical thickening in PHIV-youths may be due to abnormal developmental trajectories in the presence of HIV and cART, while cortical thinning may be due to neuronal and glial cell injury resulting from HIV (7,16-17). Our results suggest an association between the GM volume alterations and cortical thickening in the temporal gyrus of PHIV-youths (cf. Figs 1 and 3 and Table 1). Furthermore, the cortical thickening and GI loss in the insula region suggests an association between these abnormalities as well. (cf. Figs 3-4 and Table 1). After FDR corrections, we also found lower SD in the precuneus, isthmus cingulate, and paracentral regions in PHIV-youths versus HC. Finally, PHIV-youths tended to display greater age-related GM volume loss than HC.Conclusion
We confirmed key volumetric differences in GM and WM volumes between PHIV-youths and HC, and we found more specific regional alterations in CT, GI, and depth related to PHIV in regions overlapping with the observed volumetric alterations. In addition, we found regions with smaller GM volumes and GI overlapping with regions of greater cortical thickness. We also identified regions of lower SD in PHIVY than HC after correction for multiple comparisons. Taken together, these findings suggest that a combination of voxel-based and surface-based analyses sheds more light on the specific morphometric alterations in the PHIV adolescent brain that may be related to the widely prevalent HAND observed in PHIV.Acknowledgements
This research was funded by the NIH grants: 5R21NS090956-02 and 5R21MH125349-02.References
1. Justice AC, Modur SP, Tate JP, Althoff KN, Jacobson LP, Gebo KA, et al. Predictive accuracy of the veterans aging cohort study index for mortality with HIV infection: a North American cross cohort analysis. J Acquir Immune Defic Syndr. 2013;62:149-63.
2. Lee GM, Gortmaker SL, McIntosh K. Quality of life for children and adolescents: impact of HIV infection and antiretroviral treatment. Pediatrics. 2006;117(2):273-283.
3. Masters M, Ances, B. Role of neuroimaging in HIV-associated neurocognitive disorders. Semin Neurol. 2014;34:89-102.
4. Cohen S, Caan MW, Mutsaerts HJ, Scherpbier HJ, Kuijpers TW, Reiss P, et al. Cerebral injury in perinatally HIV-infected children compared to matched healthy controls. Neurology. 2016;86:19-27.
5. Smith R, Chernoff M, Williams PL, Malee KM, Sirois PA, Kammerer B, et al. Impact of HIV severity on cognitive and adaptive functioning during childhood and adolescence. Pediatr Infect Dis J. 2012;31:592-8.
6. Sarma MK, Keller MA, Macey PM, Michalik DE, Hayes J, NielsenSaines K, et al. White matter microstructure among perinatally HIV-infected youth: a diffusion tensor imaging study. J Neurovirol. 2019; 25:313-23.
7. Sarma MK, Nagarajan R, Keller MA, Kumar R, Nielsen-Saines K, Michalik DE, et al. Regional brain gray and white matter changes in perinatally HIV-infected adolescents. Neuroimage Clin. 2013;4:29-34.
8. Andronikou S, Ackermann C, Laughton B, Cotton M, Tomazos N, Spottiswoode B, et al. Corpus callosum thickness on mid-sagittal MRI as a marker of brain volume: a pilot study in children with HIV-related brain disease and controls. Pediatr Radiol. 2015;45:1016-25.
9. Andronikou S, Ackermann C, Laughton B, Cotton M, Tomazos N, Spottiswoode B, et al. Correlating brain volume and callosal thickness with clinical and laboratory indicators of disease severity in children with HIV-related brain disease. Childs Nerv Syst 2014;30:1549-57.
10. Yu X, Gao L, Wang H, Yin Z, Fang J, Chen J, et al. Neuroanatomical changes underlying vertical HIV infection in adolescents. Front Immunol. 2019;10:814.
11. Li J, Gao L, Wen Z, Zhang J, Wang P, Tu N. Structural covariance of gray matter volume in HIV vertically infected adolescents. Sci Rep. 2018;8:1182.
12. Martín-Bejarano M, Ruiz-Saez B, Martinez-de-Aragón A, et al. A Systematic Review of Magnetic Resonance Imaging Studies in Perinatally HIV-Infected Individuals. AIDS reviews, 10.24875/AIDSRev.20000088. 18 Mar. 2021
13. Ashburner J, Friston KJ. Voxel-based morphometry--the methods. Neuroimage. 2000;11:805-21
14. Dahnke R, Yotter RA, Gaser C. Cortical thickness and central surface estimation. NeuroImage vol. 65 (2013): 336-48.
15. Riccelli R, Toschi N, Nigro S, Terracciano A, Passamonti L. Surface-based morphometry reveals the neuroanatomical basis of the five-factor model of personality. Social cognitive and affective neuroscience vol. 12,4 (2017): 671-684.
16. Yadav SK, Gupta RK, Garg RK, et al. Altered structural brain changes and neurocognitive performance in pediatric HIV. Neuroimage Clin. 2017;14:316-322.
17. Zhang K, McQuibban GA, Silva C, et al. HIV-induced metalloproteinase processing of the chemokine stromal cell derived factor-1 causes neurodegeneration. Nat Neurosci. 2003;6:1064–1071.
Figures