4028
Pancreatic PDFF in persons with obesity: change during weight loss and correlations with adipose tissue PDFF
Daniela Junker1, Selina Rupp1, Jessie Han1, Mingming Wu1, Anna Reik2, Meike Wiechert2, Hans Hauner2,3, Marcus M. Makowski1, Christina Holzapfel2, and Dimitrios C. Karampinos1
1Department of Diagnostic and Interventional Radiology, School of Medicine, Technical University of Munich, Munich, Germany, 2Institute for Nutritional Medicine, School of Medicine, Technical University of Munich, Munich, Germany, 3Else Kroener-Fresenius-Center of Nutritional Medicine, School of Life Sciences, Technical University of Munich, Freising, Germany
1Department of Diagnostic and Interventional Radiology, School of Medicine, Technical University of Munich, Munich, Germany, 2Institute for Nutritional Medicine, School of Medicine, Technical University of Munich, Munich, Germany, 3Else Kroener-Fresenius-Center of Nutritional Medicine, School of Life Sciences, Technical University of Munich, Freising, Germany
Synopsis
Risk stratification strategies in patients with metabolic diseases are urgently needed for the selection of appropriate lifestyle interventions. Pancreatic fat content has been shown to be associated with the metabolic syndrome and type 2 diabetes mellitus. MRI-based proton density fat fraction (PDFF) mapping based on a multi-echo gradient echo acquisition is the method of choice for non-invasive pancreatic fat quantification. This study evaluates how the PDFF of the pancreas correlates to adipose tissue PDFF and evolves after an 8-week weight loss intervention.
Introduction
Risk stratification strategies in patients with metabolic diseases are urgently needed for the selection of optimal lifestyle interventions. Pancreatic fat content has been shown to be associated with metabolic syndrome and type 2 diabetes mellitus [1]. Therefore, MRI-based metabolic phenotyping quantifying and characterizing not only different fat depots but also the pancreatic fat content has been suggested as a methodology to improve risk stratification [2]. Proton density fat fraction (PDFF) mapping based on a multi-echo gradient echo acquisition is the method of choice for non-invasive pancreatic fat quantification [3]. However, little is known about the relations between pancreas PDFF and PDFF in adipose tissue and their change during weight loss in people with obesity. The purpose of this study was to evaluate how the magnetic resonance imaging (MRI)-based PDFF of the pancreas correlates to adipose tissue PDFF and evolves after an 8-week weight loss intervention.Methods
We recruited 64 persons with obesity (35 female, mean age 42.8 years) from the lifestyle intervention study (LION study [4]) to undergo an MRI scan of the abdomen/pelvis on a 3T scanner (Elition, Philips Healthcare). Of those, 22 participants underwent a follow-up MRI scan after an 8-week calorie-restriction (low caloric formula-based diet). For PDFF and volume measurements of adipose tissue, a 6-echo multi-echo gradient echo sequence with bipolar gradients was used in four stacks, covering the abdomen/pelvis from the liver dome to the femoral heads: TR = 7 ms, TE1 = 1.14 ms, ΔTE = 0.8, flip angle = 3°, bandwidth = 2367 Hz/pixel, 132x180x19 acquisition matrix size, FOV = 400x543x144 mm³, 3x3x6 mm3 acquisition voxel size, acceleration factor R = 3.5 and reconstructed using Compressed SENSE. For the pancreas an additional 6-echo multi-echo gradient echo sequence was performed: TR = 8.6 ms, TE1 = 1.19 ms, ΔTE = 1.2, flip angle = 3°, bandwidth = 1034 Hz/pixel, 152x199x40 acquisition matrix size, FOV = 300x400x120 mm³, 2x2x3 mm3 acquisition voxel size, acceleration factor R = 6 and reconstructed using Compressed SENSE. PDFF maps were generated using the online complex-based fat quantification algorithm, accounting for known confounding factors including the presence of multiple fat peaks, a single T2* correction and phase errors. The whole pancreas was segmented manually in the resulting water map avoiding larger vessels using ITKsnap (version 3.8.0). The visceral and subcutaneous adipose tissue (VAT and SAT) were segmented automatically using a custom-built post-processing algorithm (https://github.com/BMRRgroup/vatsatseg) and segmentations were corrected manually if necessary. VAT and SAT volumes and VAT, SAT and pancreas PDFF were extracted. Body weight was measured in light clothing before each MRI scan using MPD 250K100M (Kern and Sohn, Germany). Wilcoxon test and paired samples t-test were used to test for changes between baseline and follow-up (for non-normally and normally distributed data, respectively). Spearman Rank correlation coefficient and partial correlation with body weight as covariate were used to evaluate associations between the parameters.Results
At baseline, median body weight was 99.85 kg, median PDFF values were as follows: pancreas PDFF 12.0 %, SAT PDFF 90.8 %, VAT PDFF 86.5 %. Mean SAT volume was 15.33 L and mean VAT volume 4.28 L. In those participants with follow-ups, body weight decreased from 100.74 kg to 88.97 kg, pancreas PDFF decreased from 12.0 to 9.6 %, SAT PDFF from 91.1 to 89.1 %, VAT PDFF from 86.7 to 83.3 %, SAT volume from 15.48 to 11.98 L and VAT volume from 4.11 to 2.94 L (all p<0.01) (Figure 1). Pancreas PDFF significantly correlated with body weight, VAT PDFF and volume at baseline (ρ=0.3, p=0.02; ρ=0.64, p<0.01 and ρ=0.68, p<0.01) (Figure 2). At follow-up, PDFF of pancreas and VAT still showed a tendency to correlate (ρ=0.44, p=0.05) and pancreas PDFF remained significantly correlated with body weight and VAT volume (ρ=0.53, p=0.02 and ρ=0.66, p<0.01). With body weight as covariate, the correlation between pancreas PDFF and VAT PDFF and volume remained significant at baseline (r=0.42 and 0.51, both p<0.01) and pancreas PDFF and VAT volume correlated at follow-up (r=0.49, p=0.03). No significant correlations could be found between pancreas PDFF and SAT PDFF or volumes.Discussion
The present study demonstrates that after an 8-week formula-based weight loss intervention, not only body weight and PDFF and volume of SAT and VAT decrease but also pancreas PDFF. Furthermore, pancreatic PDFF correlates with VAT measurements both at baseline and after weight loss. VAT is considered as crucial fat depot regarding metabolic risk [5]. Therefore, the observed correlations of VAT measurements with pancreatic PDFF further corroborate the potential of pancreas PDFF as imaging marker for metabolic phenotyping to improve risk stratification in persons living with obesity.Conclusion
Pancreas PDFF should be taken into account in metabolic phenotyping for metabolic risk stratification.Acknowledgements
This study is funded by the German Federal Ministry of Education and Research (BMBF, grant number: 01EA1709) within the framework of the Junior Research Group for Personalized Nutrition & eHealth (PeNut) of the enable Nutrition Cluster. Further, the present work was supported by the German Research Foundation (project number 450799851). The authors also acknowledge research support from Philips Healthcare.References
[1] Lee JS, Kim SH, Jun DW, Han JH, Jang EC, Park JY, et al. Clinical implications of fatty pancreas: correlations between fatty pancreas and metabolic syndrome. World J Gastroenterol. 2009;15(15):1869-75. [2] Dong Z, Luo Y, Cai H, Zhang Z, Peng Z, Jiang M, et al. Noninvasive fat quantification of the liver and pancreas may provide potential biomarkers of impaired glucose tolerance and type 2 diabetes. Medicine (Baltimore). 2016;95(23):e3858. [3] Idilman IS, Tuzun A, Savas B, Elhan AH, Celik A, Idilman R, et al. Quantification of liver, pancreas, kidney, and vertebral body MRI-PDFF in non-alcoholic fatty liver disease. Abdom Imaging. 2015;40(6):1512-9. [4] Reik A, Holzapfel C. Randomized Controlled Lifestyle Intervention (LION) Study for Weight Loss and Maintenance in Adults With Obesity-Design and Methods. Front Nutr. 2020;7:586985. [5] Fox CS, Massaro JM, Hoffmann U, Pou KM, Maurovich-Horvat P, Liu CY, et al. Abdominal visceral and subcutaneous adipose tissue compartments: association with metabolic risk factors in the Framingham Heart Study. Circulation. 2007;116(1):39-48.Figures
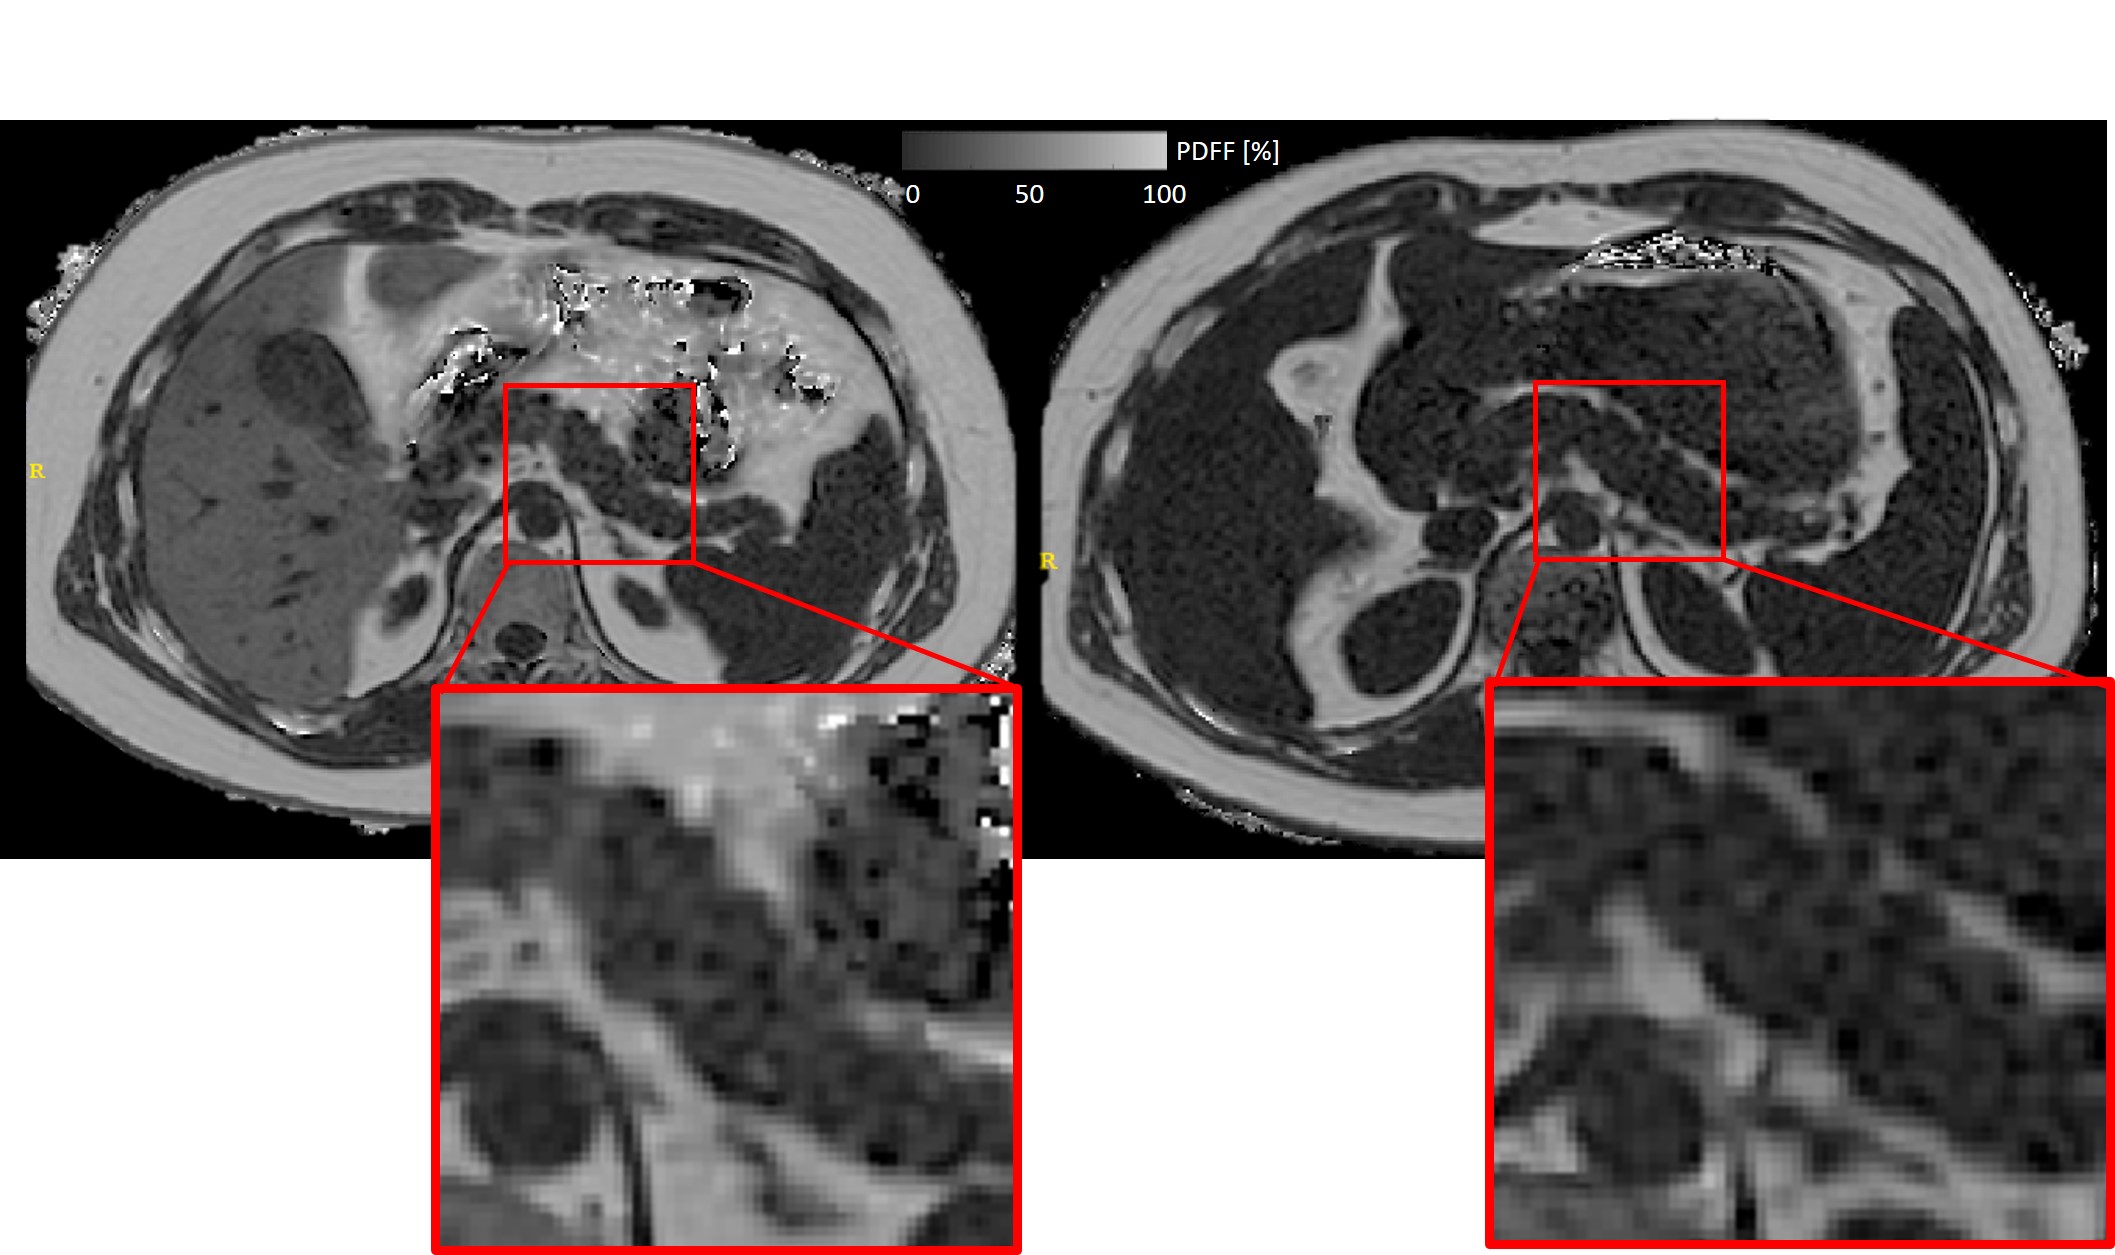
Figure
1: Axial PDFF map
at height of pancreatic body with zoom of
pancreatic body. At baseline (left), pancreas PDFF was 12.7%, VAT PDFF 87.8% and
VAT volume 4.1L. At follow-up
(right), pancreas PDFF was 7.0%, VAT PDFF 82.8% and
VAT volume 2.58L. Also note
the
clear
decrease in liver fat and the altered position of the organs due to adipose tissue volume changes.
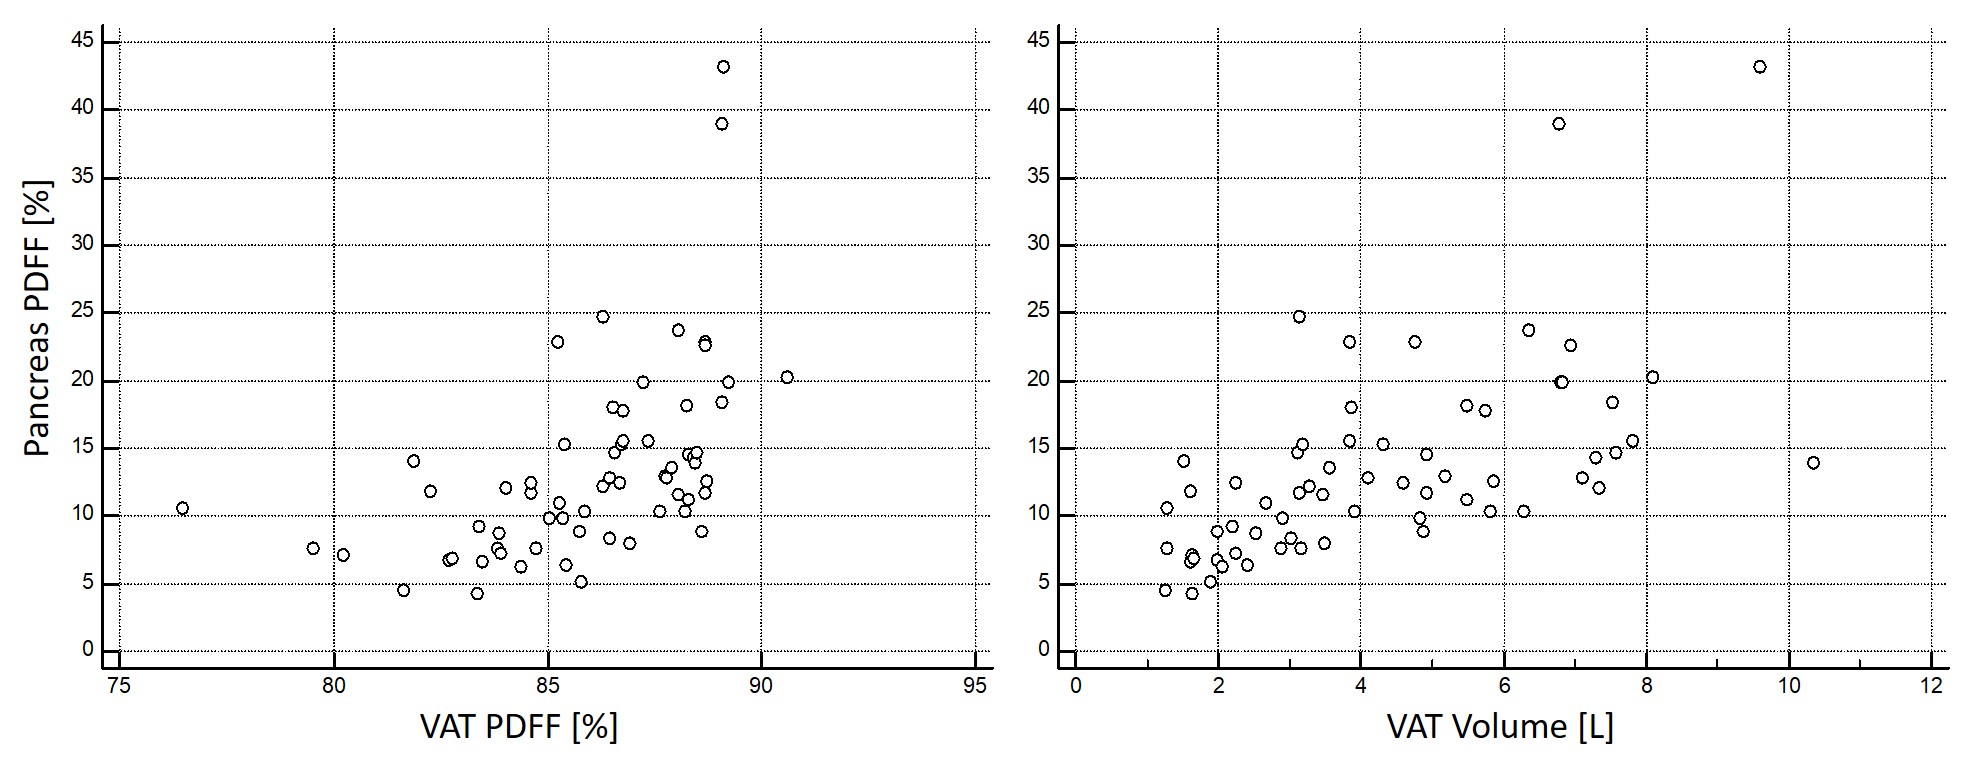
Figure
2: Scatter plots depicting the association between pancreas PDFF and
VAT PDFF (left,
p=0.02) and
VAT volume (right, p<0.01) at baseline.
DOI: https://doi.org/10.58530/2022/4028