4027
Combined structural and functional connectivity changes in Fabry disease1Department of Computer Science, University of Verona, Verona, Italy, 2Department of Advanced Biomedical Sciences, University of Naples "Federico II", Naples, Italy, 3Department of Electrical Engineering and Information Technology, University of Naples "Federico II", Naples, Italy, 4Department of Neuroscience, Rehabilitation, Ophthalmology, Genetics, Maternal and Child Health (DINOGMI), University of Genoa, Genoa, Italy, 5Department of Biomedical Engineering, University Hospital Basel and University of Basel, Basel, Switzerland, 6Department of Human Neurosciences, Sapienza University of Rome, Rome, Italy, 7University of Sherbrooke, Sherbrooke, QC, Canada, 8Department of Public Health, University of Naples "Federico II", Naples, Italy
Synopsis
Central nervous system involvement in Fabry disease (FD) patients is known, but the effects on brain connectivity have never been explored at macro-scale level. Here, we investigate both structural (SC) and functional connectivity (FC) by analyzing diffusion and resting-state functional MRI. We applied a graph theory approach to compare connectomes of patients and controls and we explored how altered global network metrics are related to patients’ outcome in neuropsychological tests. Our results show that FD patients present a loss of axonal integrity which leads to a widespread reorganization of brain structural and functional architecture, related to their clinical performances.
Introduction
Fabry disease (FD) is a rare progressive X-linked lysosomal storage disease caused by a defective activity of the α-galactosidase A enzyme, leading to intracellular accumulation of glycosphingolipid globotriaosylceramide1. Patients present neurovascular events2 and volumetric3,4, functional5,6 and structural7–9 changes. Today the information available is restricted to functional/structural changes affecting specific brain areas6,8 or to whole-brain microstructural damage5,9, but an understanding of macro-scale brain connectivity is missing. Here, we combine diffusion (dMRI) and resting-state functional MRI (rs-fMRI) to better understand the interactions occurring between functional and structural changes in this condition, as well as their possible clinical impact (Fig.1).Methods
46 FD patients (28F, 42.2±13.2years) and 49 healthy controls (HC, 21F, 42.3±16.3years) underwent the following MRI examination on a Siemens Magnetom Trio 3T: 3D-FLAIR (TR/TE/TI=6000/396/2200ms; voxel-size=1x1x1mm3); MPRAGE (TR/TE/TI=1900/3.4/900ms; voxel-size=1x1x1mm3); diffusion (DTI, TR/TE=7400/88ms; voxel-size=2.2×2.2×2.2mm3 with 64 directions at b=1000s/mm2 and 9 b=0s/mm2); rs-fMRI (TR/TE=2500/50ms; voxel-size=3x3x4mm3; gap=1mm; time-points=200). For 11 FD patients, results of a neuropsychological examination obtained within 1 week from the MRI scan were also available (Tab.1).dMRIs were corrected for noise10 and eddy currents induced distortions11 and used to perform whole-brain probabilistic anatomically constrained tractography12,13. The resulting tractograms were processed using COMMIT14,15 with ball-and-stick model16 to estimate the intra-axonal signal contribution (IAS) of each tract. Structural connectomes (SC) were built using a modified AAL17 parcellation with 100 regions and weighting each connection by the total IAS of the streamlines in it18.
Rs-fMRIs were preprocessed19 with motion and slice-timing correction, denoising, outlier identification, indirect segmentation and normalization to the MNI152 space, resampling to 2mm isotropic voxels20. Functional connectomes (FC) were built weighting the edges by the Fisher-transformed bivariate correlation coefficient between the pair of BOLD timeseries extracted from the corresponding ROIs. Afterwards, these matrices were absolutized21,22 and filtered using network density of 0.20 as threshold23.
Network-based statistics (NBS)24 was used to identify specific connected subnetworks associated with a significant between-group difference. FD<HC and FD>HC contrasts were tested on both SC and FC for a range of primary thresholds (t∈[2.0,…, 4.0])25 via ANCOVA analyses, with age, gender, and mean motion (rs-fMRI only) as covariates. 5000 permutations were used, with intensity as the measure of network size and statistical significance threshold set at p<0.05 (FWER-corrected).
Five global network metrics were extracted from both connectomes26: density, mean strength, global efficiency, clustering coefficient and modularity. Between-group comparisons were performed with robust linear model27, considering age28, gender29, and mean motion (rs-fMRI only) as covariates.
As exploratory analysis, we investigated the possible association between cognitive performance and SC/FC modifications at both global and subnetwork level.
Network metrics associated with significant between-group differences were expressed as age-, gender- and mean motion (rs-fMRI only)-adjusted z-scores w.r.t. HC values, and their relationship with neuropsychological tests was assessed via robust correlation analysis.
As for the sub-networks identified with NBS, a measure of mean SC disruption was obtained by referencing each subnetwork edge’s weight to HC values (adjusting for age and gender) and averaging the resulting z-scores. Similarly, an index of mean within-subnetwork FC deviation was obtained by averaging the z-scores of each edge’s absolute weights w.r.t. HC values (adjusting for age, gender, and mean motion). The resulting mean z-scores were correlated with neuropsychological tests scores.
Results
NBS analysis of SC for the FD<HC contrast identified subnetworks associated with a significant between-group difference across a wide range of statistical thresholds. Subsequent analyses were performed considering the subnetwork identified at the t=3.0 median primary threshold (Fig.2).Fig.3 reports the between-group comparison of the network metrics extracted from SC and FC. For SC, global efficiency (p=0.01) and mean strength (p<0.001) were significantly different between patients and controls. Instead, only modularity (p=0.004) showed significant differences for FC.
When looking at the relationship between altered network metrics and neuropsychological tests, significant correlations emerged between the SC mean strength and the RAVLT-immediate score (r=0.721 [95%CI:0.125,0.949]; p=0.03), and between the FC modularity and DGS test scores (r=-0.769 [95%CI:-0.979,-0.335]; p=0.02).
As for the subnetwork identified at the NBS analysis, the mean SC disruption across FD patients was -0.62 (SD=0.36), with a mean FC deviation from HCs of 0.14 (SD=0.55). SC disruption correlated with scores at WCFST (r=0.706 [95%CI:-0.102,0.960]; p=0.03), CBTT (r=0.672 [95%CI:0.037,0.985]; p=0.05) and RAVLT-delayed (r=0.795 [95%CI:0.115,0.967]; p=0.01).
Discussion
These findings support the hypothesis of a brain structural and functional disruption in FD, supported by axonal damage and with some association with cognitive performance. The analysis of the regions showing a more pronounced microstructural damage (e.g., frontal subnetwork) might offer insightful consideration about a possible compensatory role of functional connectivity abnormalities on cognitive performance. The reduction of the connections’ strength within FD connectomes, as an index of axonal integrity loss, is in line with previous neuropathological data30 and animal models31 showing the presence of axonal damage in this condition. The damage to the brain axons might also be the reason of reduced efficiency of the connections, which causes subsequent partial loss of network integration.Conclusion
We found a widespread reorganization of brain structural and functional architecture in FD, sustained by axonal integrity loss and related to the clinical performances of patients.Acknowledgements
No acknowledgement found.References
- Germain DP. Fabry disease. Orphanet J Rare Dis. 2010;5(1):1-49.
- Sims K, Politei J, Banikazemi M, Lee P. Stroke in Fabry Disease Frequently Occurs Before Diagnosis and in the Absence of Other Clinical Events. Stroke. 2009;40(3):788-794.
- Pontillo G, Cocozza S, Brunetti A, et al. Reduced Intracranial Volume in Fabry Disease: Evidence of Abnormal Neurodevelopment? Front Neurol. 2018;9:672.
- Fellgiebel A, Wolf DO, Kolodny E, Müller MJ. Hippocampal atrophy as a surrogate of neuronal involvement in Fabry disease. J Inherit Metab Dis. 2012;35(2):363-367.
- Cocozza S, Pontillo G, Quarantelli M, et al. Default mode network modifications in Fabry disease: A resting-state fMRI study with structural correlations. Hum Brain Mapp. 2018;39(4):1755-1764.
- Cocozza S, Pisani A, Olivo G, et al. Alterations of functional connectivity of the motor cortex in Fabry disease. Neurology. 2017;88(19):1822-1829.
- Paavilainen T, Lepomäki V, Saunavaara J, et al. Diffusion tensor imaging and brain volumetry in Fabry disease patients. Neuroradiology. 2013;55(5):551-558.
- Cocozza S, Schiavi S, Pontillo G, et al. Microstructural damage of the cortico-striatal and thalamo-cortical fibers in Fabry disease: a diffusion MRI tractometry study. Neuroradiology. 2020;62(11):1459-1466.
- Ulivi L, Kanber B, Prados F, et al. White matter integrity correlates with cognition and disease severity in Fabry disease. Brain. 2020;143(11):3331-3342.
- Veraart J, Novikov DS, Christiaens D, Ades-aron B, Sijbers J, Fieremans E. Denoising of diffusion MRI using random matrix theory. Neuroimage. 2016;142:394-406.
- Andersson JLR, Sotiropoulos SN. An integrated approach to correction for off-resonance effects and subject movement in diffusion MR imaging. Neuroimage. 2016;125:1063-1078.
- Smith RE, Tournier JD, Calamante F, Connelly A. Anatomically-constrained tractography: Improved diffusion MRI streamlines tractography through effective use of anatomical information. Neuroimage. 2012;62(3):1924-1938.
- Tournier JD, Calamante F, Connelly A. Improved probabilistic streamlines tractography by 2nd order integration over fibre orientation distributions. In: Proceedings of the International Society for Magnetic Resonance in Medicine. Vol 1670. ; 2010.
- Daducci A, Dal Palù A, Lemkaddem A, Thiran J. A convex optimization framework for global tractography. In: 2013 IEEE 10th International Symposium on Biomedical Imaging. ; 2013:524-527.
- Daducci A, Dal Palù A, Lemkaddem A, Thiran J. COMMIT: Convex Optimization Modeling for Microstructure Informed Tractography. IEEE Trans Med Imaging. 2015;34(1):246-257.
- Behrens TEJ, Woolrich MW, Jenkinson M, et al. Characterization and propagation of uncertainty in diffusion-weighted MR imaging. Magn Reson Med. 2003;50(5):1077-1088.
- Tzourio-Mazoyer N, Landeau B, Papathanassiou D, et al. Automated Anatomical Labeling of Activations in SPM Using a Macroscopic Anatomical Parcellation of the MNI MRI Single-Subject Brain. Neuroimage. 2002;15(1):273-28
- Schiavi S, Petracca M, Battocchio M, et al. Sensory-motor network topology in multiple sclerosis: Structural connectivity analysis accounting for intrinsic density discrepancy. Hum Brain Mapp. 2020;41(11):2951-2963.
- Whitfield-Gabrieli S, Nieto-Castanon A. Conn: A Functional Connectivity Toolbox for Correlated and Anticorrelated Brain Networks. Brain Connect. 2012;2(3):125-141.
- Nieto-Castanon A. Handbook of Functional Connectivity Magnetic Resonance Imaging Methods in CONN. Hilbert Press; 2020.
- Chai XJ, Castañón AN, Öngür D, Whitfield-Gabrieli S. Anticorrelations in resting state networks without global signal regression. Neuroimage. 2012;59(2):1420-1428.
- Zhan L, Jenkins LM, Wolfson OE, et al. The significance of negative correlations in brain connectivity. J Comp Neurol. 2017;525(15):3251-3265.
- van den Heuvel MP, de Lange SC, Zalesky A, Seguin C, Yeo BTT, Schmidt R. Proportional thresholding in resting-state fMRI functional connectivity networks and consequences for patient-control connectome studies: Issues and recommendations. Neuroimage. 2017;152:437-449.
- Zalesky A, Fornito A, Bullmore ET. Network-based statistic: Identifying differences in brain networks. Neuroimage. 2010;53(4):1197-1207.
- Ehrlich S, Lord AR, Geisler D, et al. Reduced functional connectivity in the thalamo-insular subnetwork in patients with acute anorexia nervosa. Hum Brain Mapp. 2015;36(5):1772-1781.
- Rubinov M, Sporns O. Complex network measures of brain connectivity: Uses and interpretations. Neuroimage. 2010;52(3):1059-1069.
- Koller M, Stahel WA. Sharpening wald-type inference in robust regression for small samples. Comput Stat Data Anal. 2011;55(8):2504-2515.
- Damoiseaux JS. Effects of aging on functional and structural brain connectivity. Neuroimage. 2017;160:32-40.
- Gong G, He Y, Evans AC. Brain Connectivity: Gender Makes a Difference. Neurosci. 2011;17(5):575-591.
- Okeda R, Nisihara M. An autopsy case of Fabry disease with neuropathological investigation of the pathogenesis of associated dementia. Neuropathology. 2008;28(5):532-540.
- Nelson MP, Tonia ET, O’Quinn DB, et al. Autophagy-lysosome pathway associated neuropathology and axonal degeneration in the brains of alpha-galactosidase A-deficient mice. Acta Neuropathol Commun. 2014;2(1):1-15.
Figures
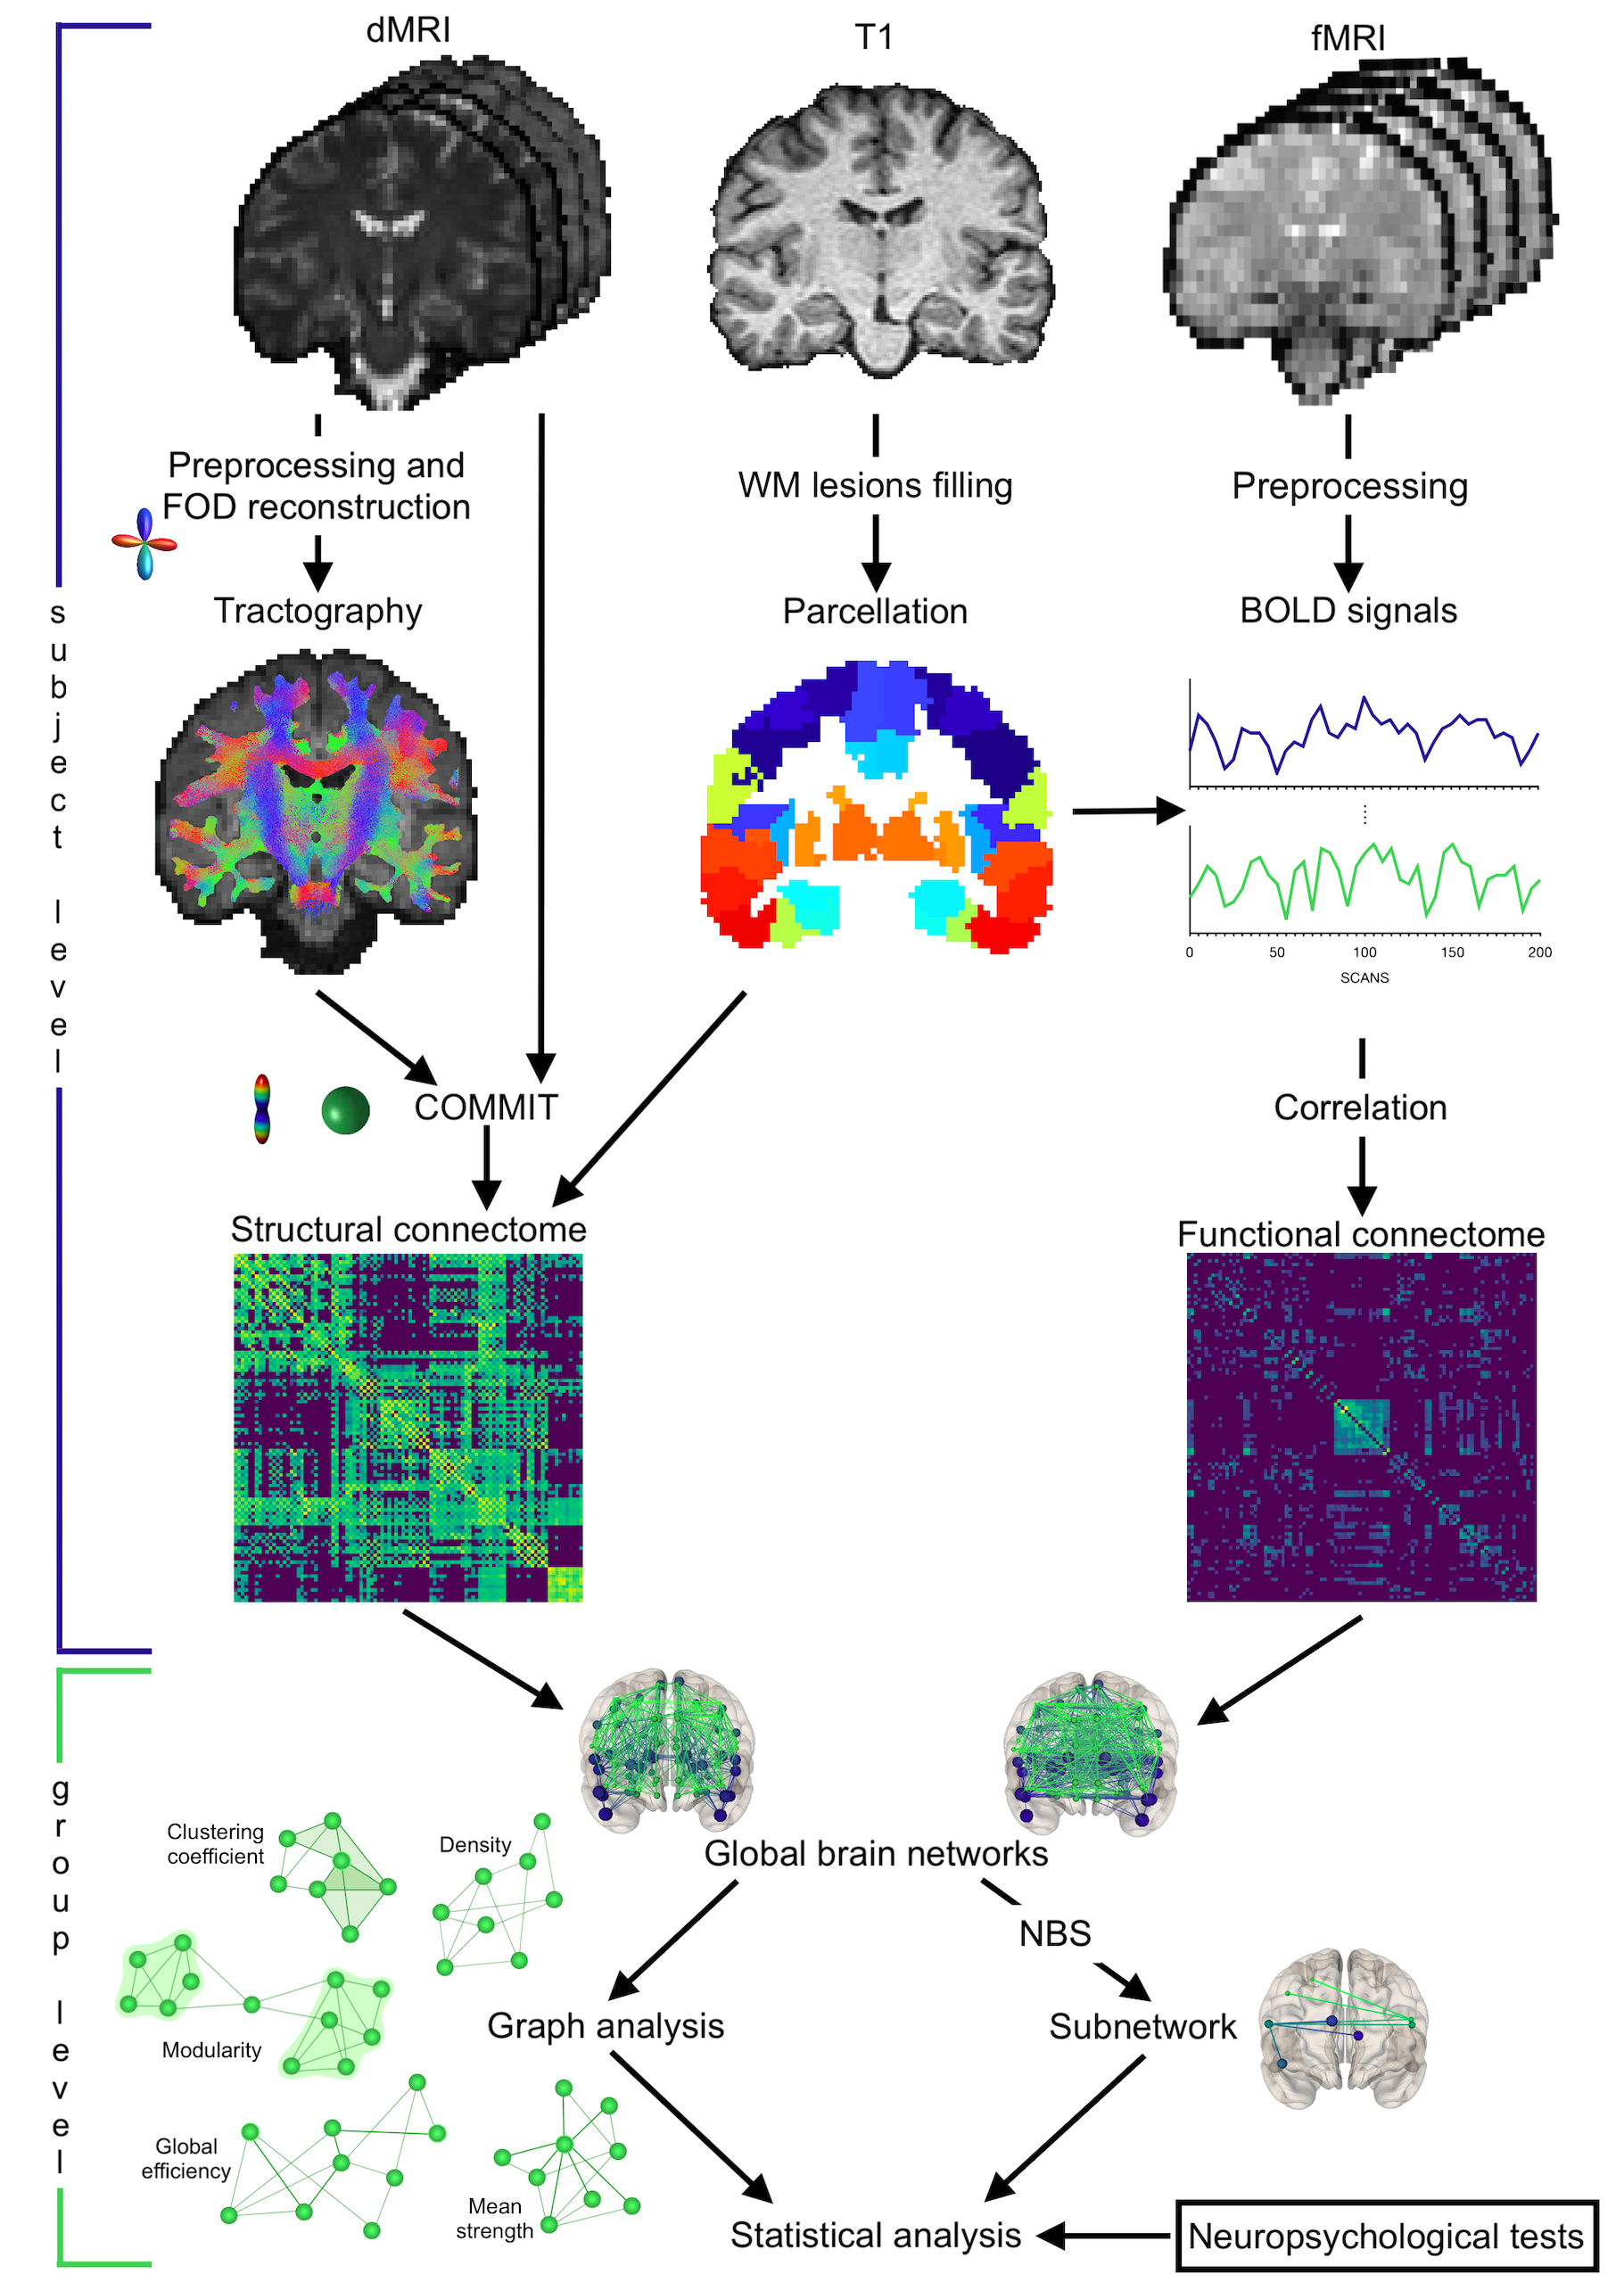
Figure 1 Summary of main steps
Structural connectomes were built exploiting probabilistic tractography while functional ones through BOLD signals correlation. Global graph metrics were extracted: density (possible/actual connections), mean strength (connections strength), global efficiency (ability to exchange information), clustering coefficient (integration measure) and modularity (segregation degree). A subnetwork associated with significant between-group difference was identified. Relations between network metrics and clinical tests were examined.
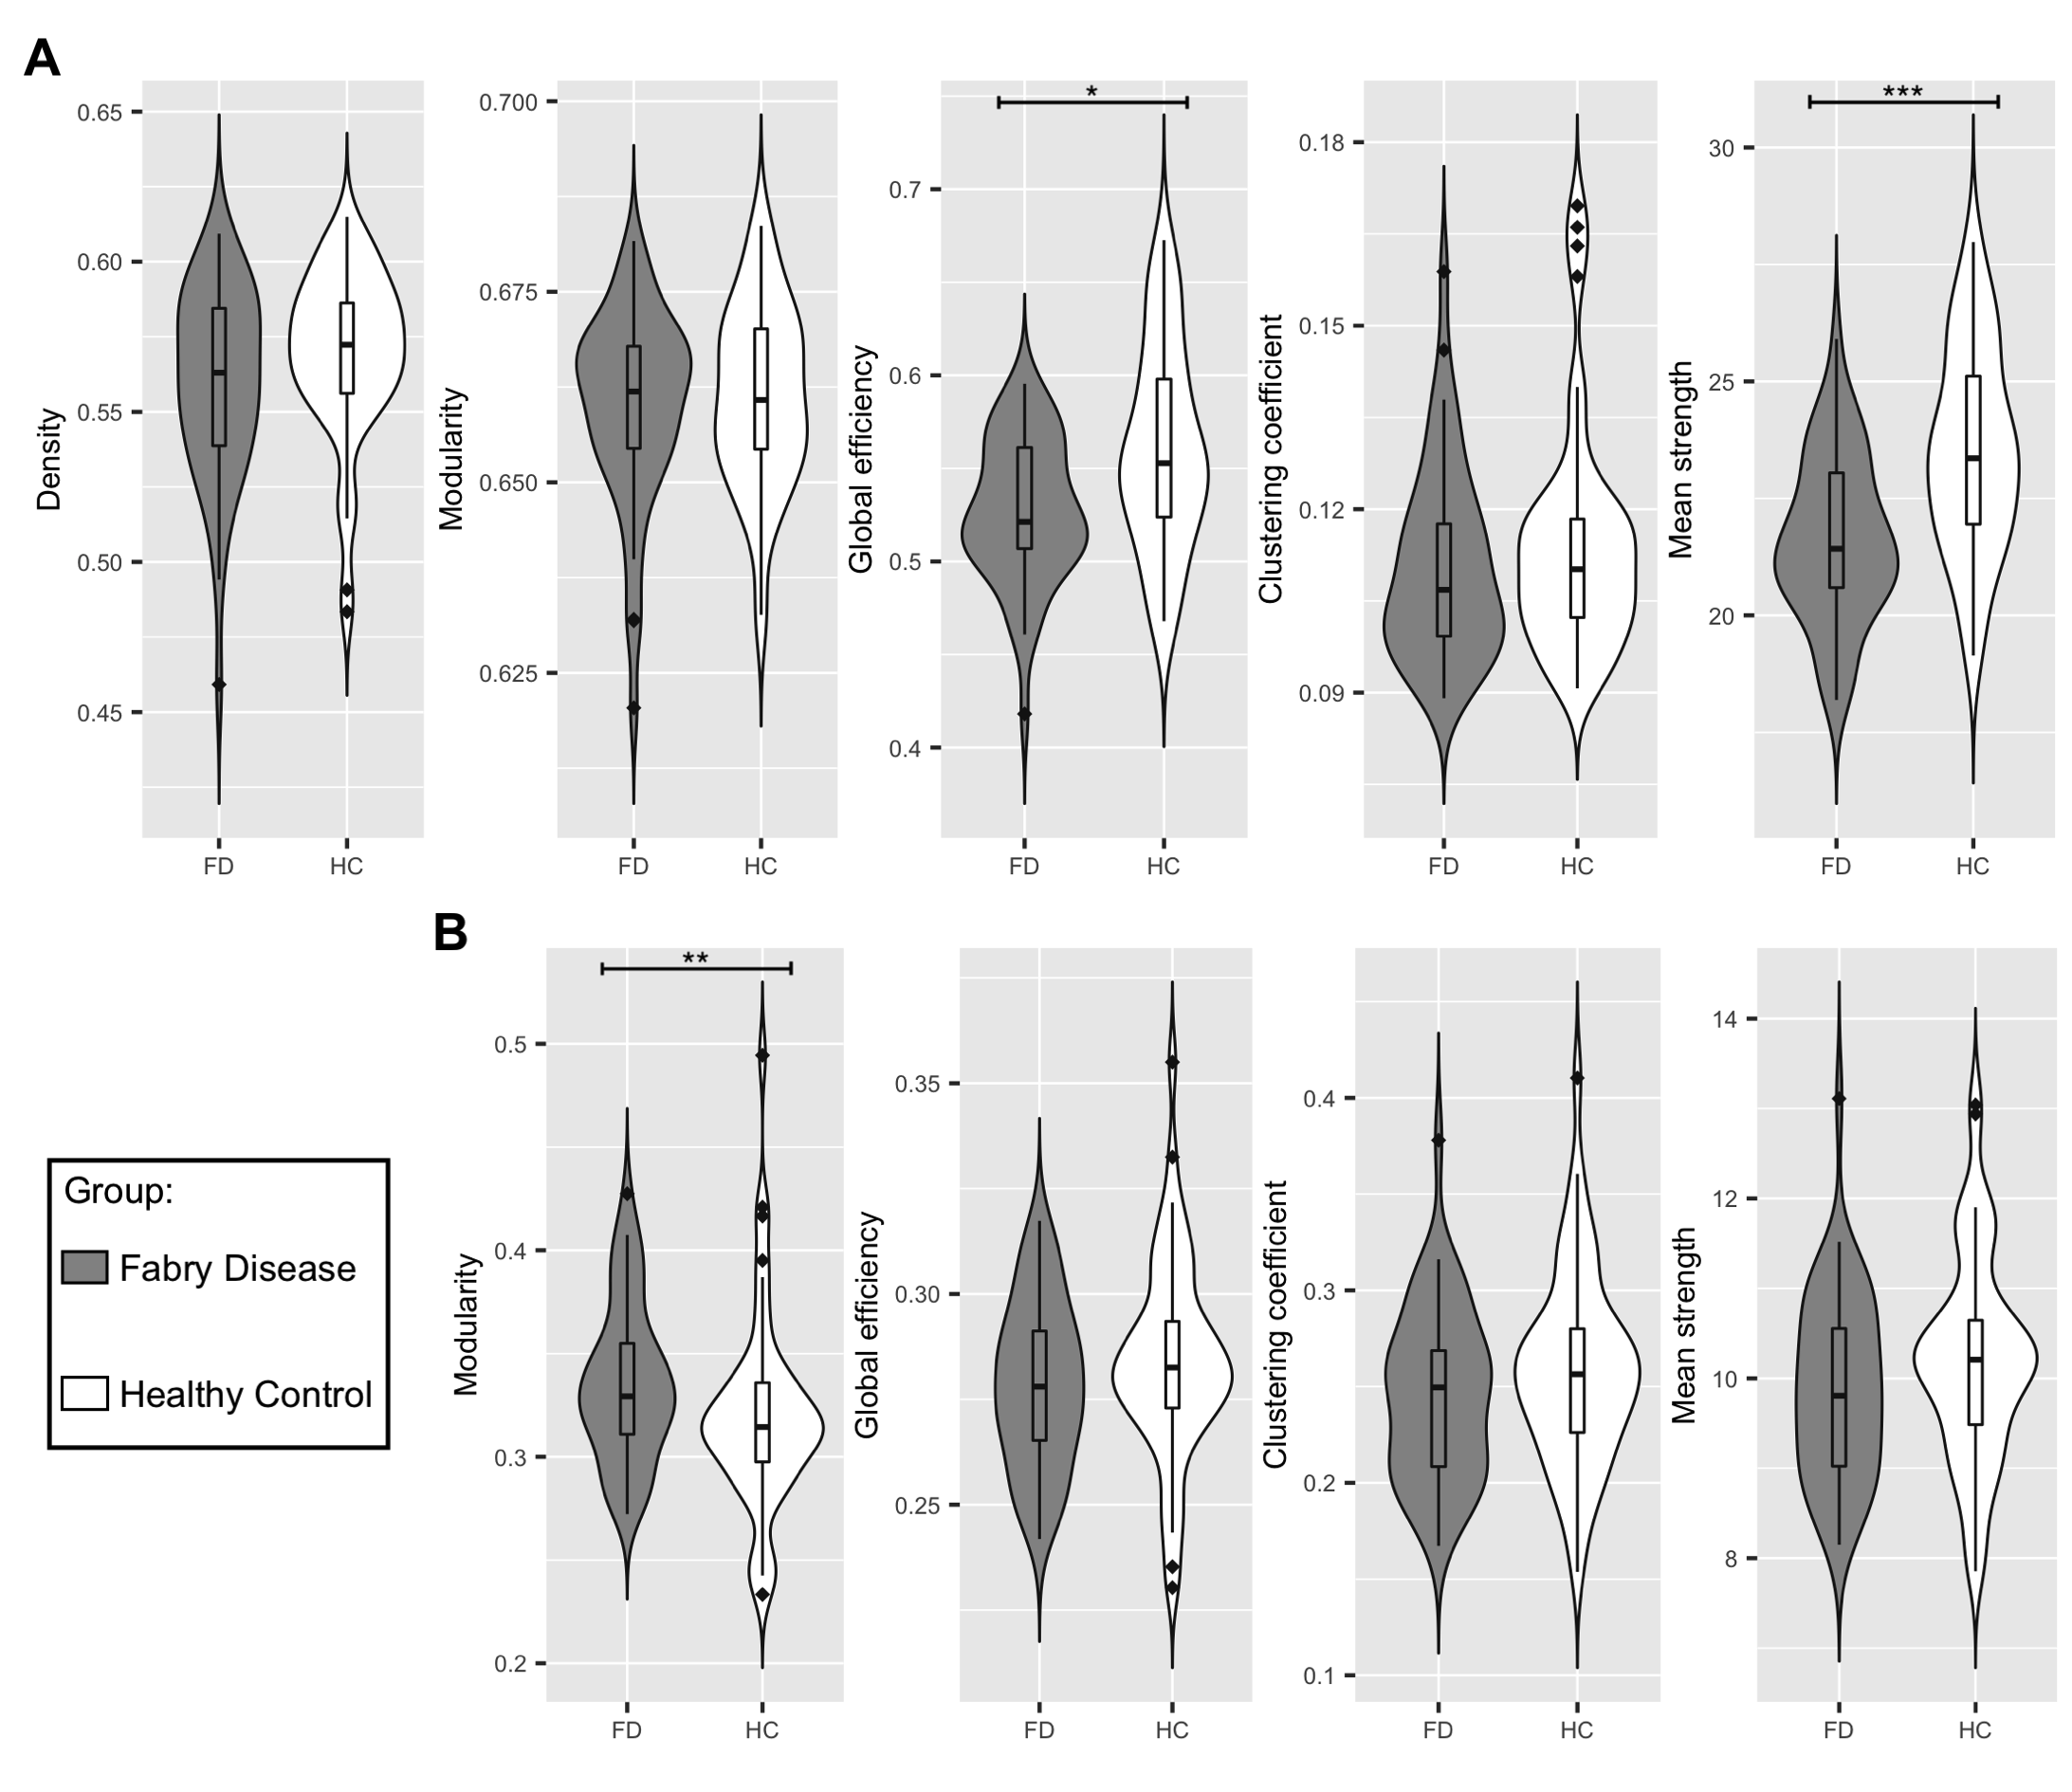
Figure 2 Between-group differences in network metrics
(A) Violin plots showing the differences in structural global network metrics (density, modularity, global efficiency, clustering coefficient and mean strength) between Fabry disease patients (FD, in grey) and healthy controls (HC, in white).
(B) Violin plots representing the distribution of the functional global network in the two groups of participants, density is not reported because it was used to threshold the functional connectomes.
Significance codes: *** 0≤p≤0.001, ** 0.001<p≤0.01, * 0.01<p≤0.05
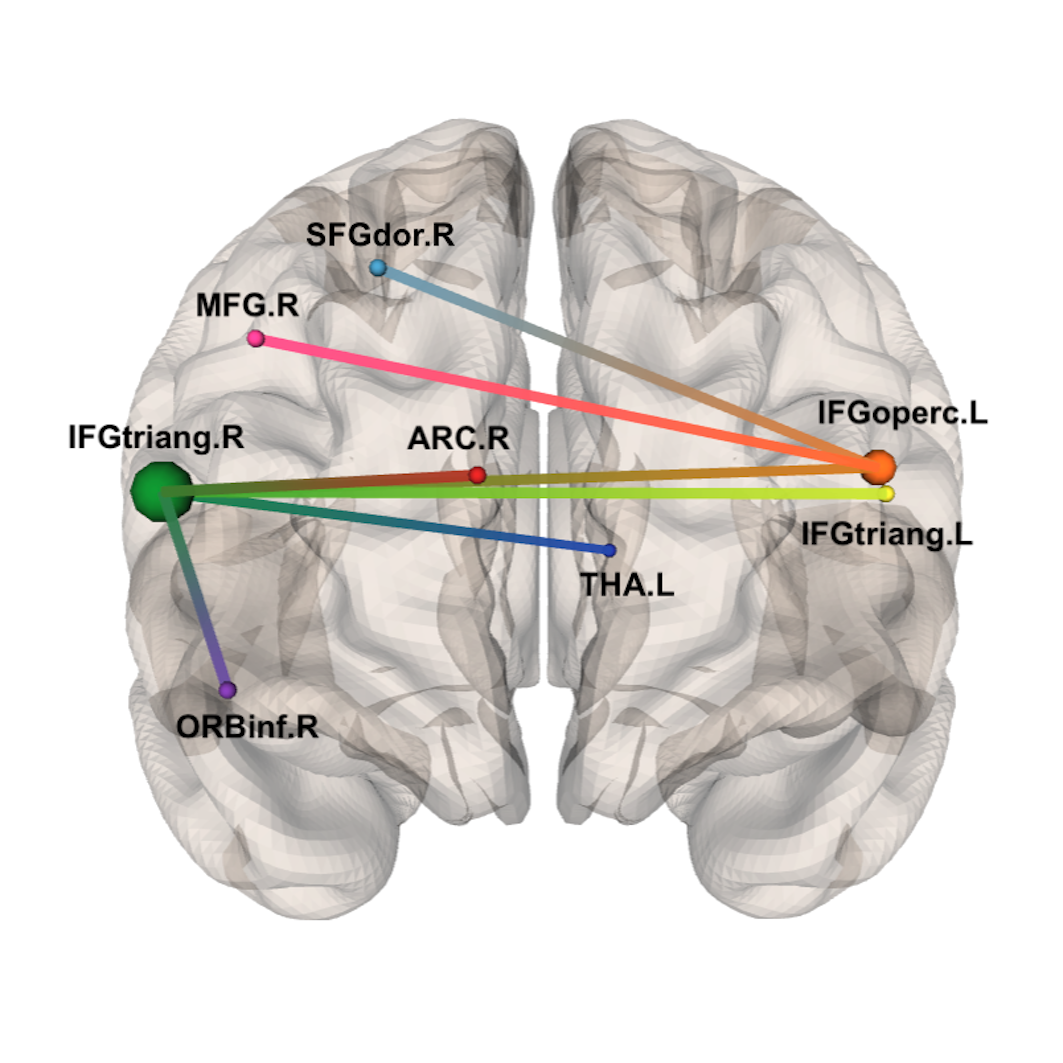
Figure 3 Subnetwork identified by NBS at primary threshold t=3.0.
Accordingly to the AAL atlas, its 8 nodes are: right superior frontal gyrus (SFGdor.R), right middle frontal gyrus (MFG.R), right inferior frontal gyrus – triangular part (IFGtriang.R), right inferior frontal gyrus – orbital part (ORBinf.R), right anterior cingulate and paracingulate gyri (ACG.R), left thalamus (THA.L), right inferior frontal gyrus – opercular part (IFGoperc.L) and left inferior frontal gyrus – triangular part (IFGtriang.L)
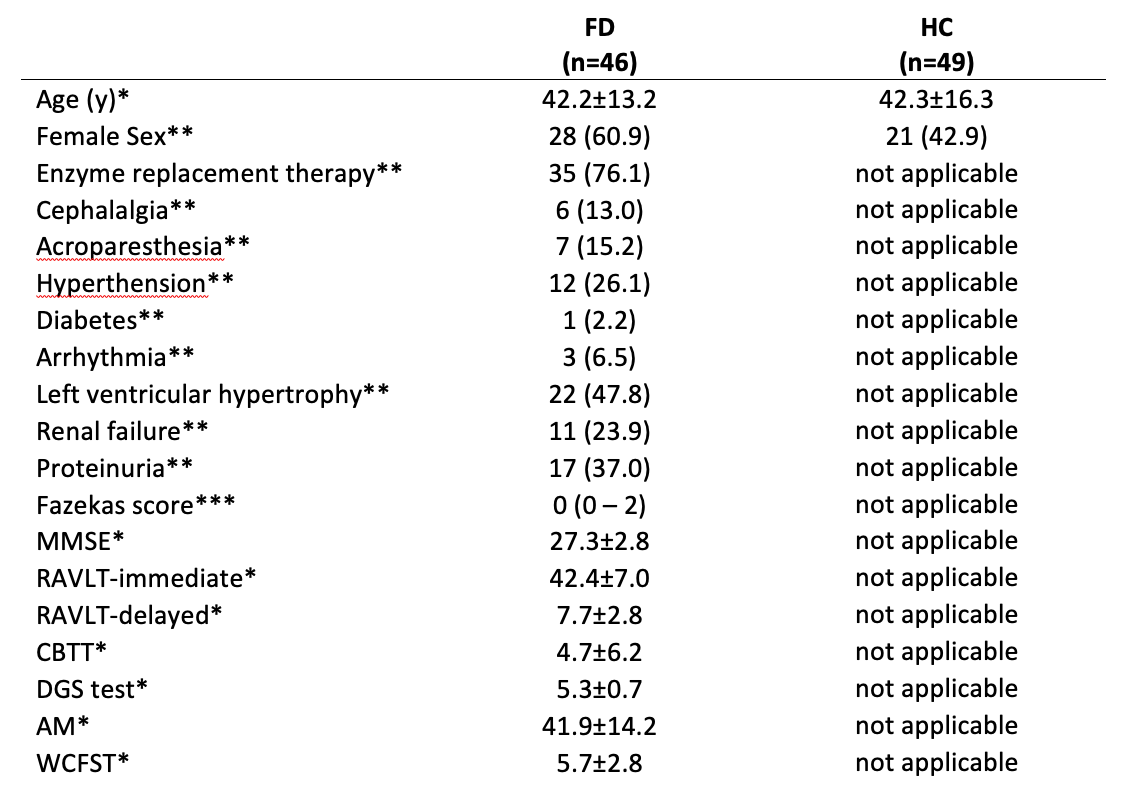
Table 1 Demographic and clinical characteristics of the population
Available neuropsychological tests: mini mental state evaluation (MMSE), Rey Auditory Verbal Learning Test (RAVLT), Corsi block-tapping test (CBTT), digit span (DGS) test, attentional matrices (AM), and Weigl color form sorting test (WCFST) as measures of general cognition, immediate and delayed verbal memory, visual memory, working memory, attention and executive function, respectively.
* mean ± standard deviation
** number of subjects, with percentages in parenthesis
*** median, with range in parentheses