4025
Differentiation of Pediatric Brain Tumor Grades Using High b-Value Diffusion MRI with a Varying Diffusion Curvature Model1Watchung Hills Regional High School, Warren, NJ, United States, 2Montgomery High School, Skillman, NJ, United States, 3Center for MR Research, University of Illinois at Chicago, Chicago, IL, United States, 4Department of Bioengineering, University of Illinois at Chicago, Chicago, IL, United States, 5Departments of Radiology and Neurosurgery, University of Illinois at Chicago, Chicago, IL, United States
Synopsis
Imaging-based determination of tumor grade is highly desirable, particularly for pediatric brain tumors where surgical biopsy carries considerable risks. We have applied a novel diffusion model – varying diffusion curvature (VDC) model, with two b-value ranges (0-2000 sec/mm2 and 0-4000 sec/mm2), to differentiate between low- and high-grade pediatric brain tumors on 70 patients. Our results showed that the combination of the VDC parameters substantially outperformed the ADC for differentiating low- from -high grade pediatric brain tumors. Increasing the maximal b-value from 2000 to 4000 sec/mm2 did not noticeably improve the performance.
Introduction
Pediatric brain tumors are the leading cause of cancer-related death among children and adolescents aged 0-19 years1. The treatment of pediatric tumors varies greatly based on the type and grade. Clinical determination of tumor grade is typically performed using invasive surgical biopsies, which pose surgical risks and is subject to sampling errors. Non-invasive tumor grading using MR has been challenging despite the availability of diffusion, perfusion, and metabolic imaging, as well as other techniques. Among these, diffusion MRI is becoming increasingly attractive because of its ability to probe tissue microstructures that can be altered differently depending on the tumor grade. To extract tissue microstructural information, diffusion models are critical. Recently, a new model – varying diffusion curvature (VDC) model – was introduced to account for non-Gaussian diffusion behavior2. Its potential clinical utility, however, is yet to be demonstrated. The purpose of this study is to investigate the feasibility of using the VDC model to differentiate low-grade and high- grade pediatric brain tumors.Methods
Patients: With approval by the local ethics committee, 70 patients with histologically-proven pediatric brain tumors (50 male and 20 female; age range: 4 months to 13 years of age) were enrolled in the study, including 30 patients with low-grade and 40 with high-grade tumors according to the WHO 2016 guidelines3. The low-grade group consisted of 16 grade I and 14 grade II tumors, while the high-grade group contained 5 grade III and 35 grade IV tumors. Overall, there were 22 different tumor subtypes, with the two most common subtypes being medulloblastoma (n = 18) and pilocytic astrocytoma (n = 10).Image acquisition and processing: All patients underwent MRI examination at 3 Tesla with an 8-channel phased-array head coil. The MRI protocol included pre-/post-contrast T1-weighted, T2-weighted, FLAIR, and diffusion-weighted scans. The set of diffusion-weighted images with 12 b-values (0-4000 sec/mm2) were used to obtain the two VDC parameters pixel-by-pixel according to Eq. [1] using a Levenberg-Marquardt nonlinear fitting algorithm in MATLAB:
$$S(b) = S_{0}exp[−\left(\frac{D_{0}}{D_{1}}\right)\left(1 − exp(−bD_{1}\right)] [1]$$
where D0 is analogous to ADC and D1 accounts for non-Gaussian diffusion behavior. The VDC model parameters were compared against the ADC from a conventional mono-exponential model. To evaluate the influence of b-values on the results, D0, D1, and ADC were obtained with a lower b-value range (0-2000 sec/mm2) and a higher (or full) b-value range (0-4000 sec/mm2), respectively.
Statistical analyses: Regions of interest (ROIs) containing the tumor were drawn on the maps of D0, D1, and ADC. The mean value of each parameter for each patient was calculated and categorized into the low- or high-grade group using histopathology as a gold standard. To use both VDC parameters conjointly for tumor grading, D0 and D1 were combined using a multinomial logistic regression, yielding a parameter P0 which represents both VDC parameters. A Student’s t-test was conducted between the low- and high-grade tumors for D0, D1, P0, and ADC with a significance threshold of P < 0.05. Receiver operating characteristic (ROC) analysis was performed based on each of the four parameters (D0, D1, P0, and ADC) for each of the two b-value ranges (0-2000 sec/mm2 and 0-4000 sec/mm2). The area under the ROC curve (AUC) was obtained to assess the performance of differentiation between the low- and high-grade pediatric brain tumors. In addition, sensitivity, specificity, and diagnostic accuracy were also evaluated.
Results
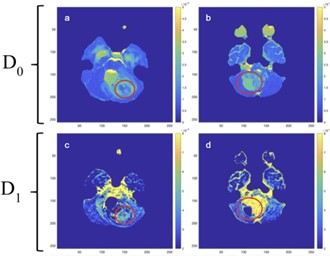
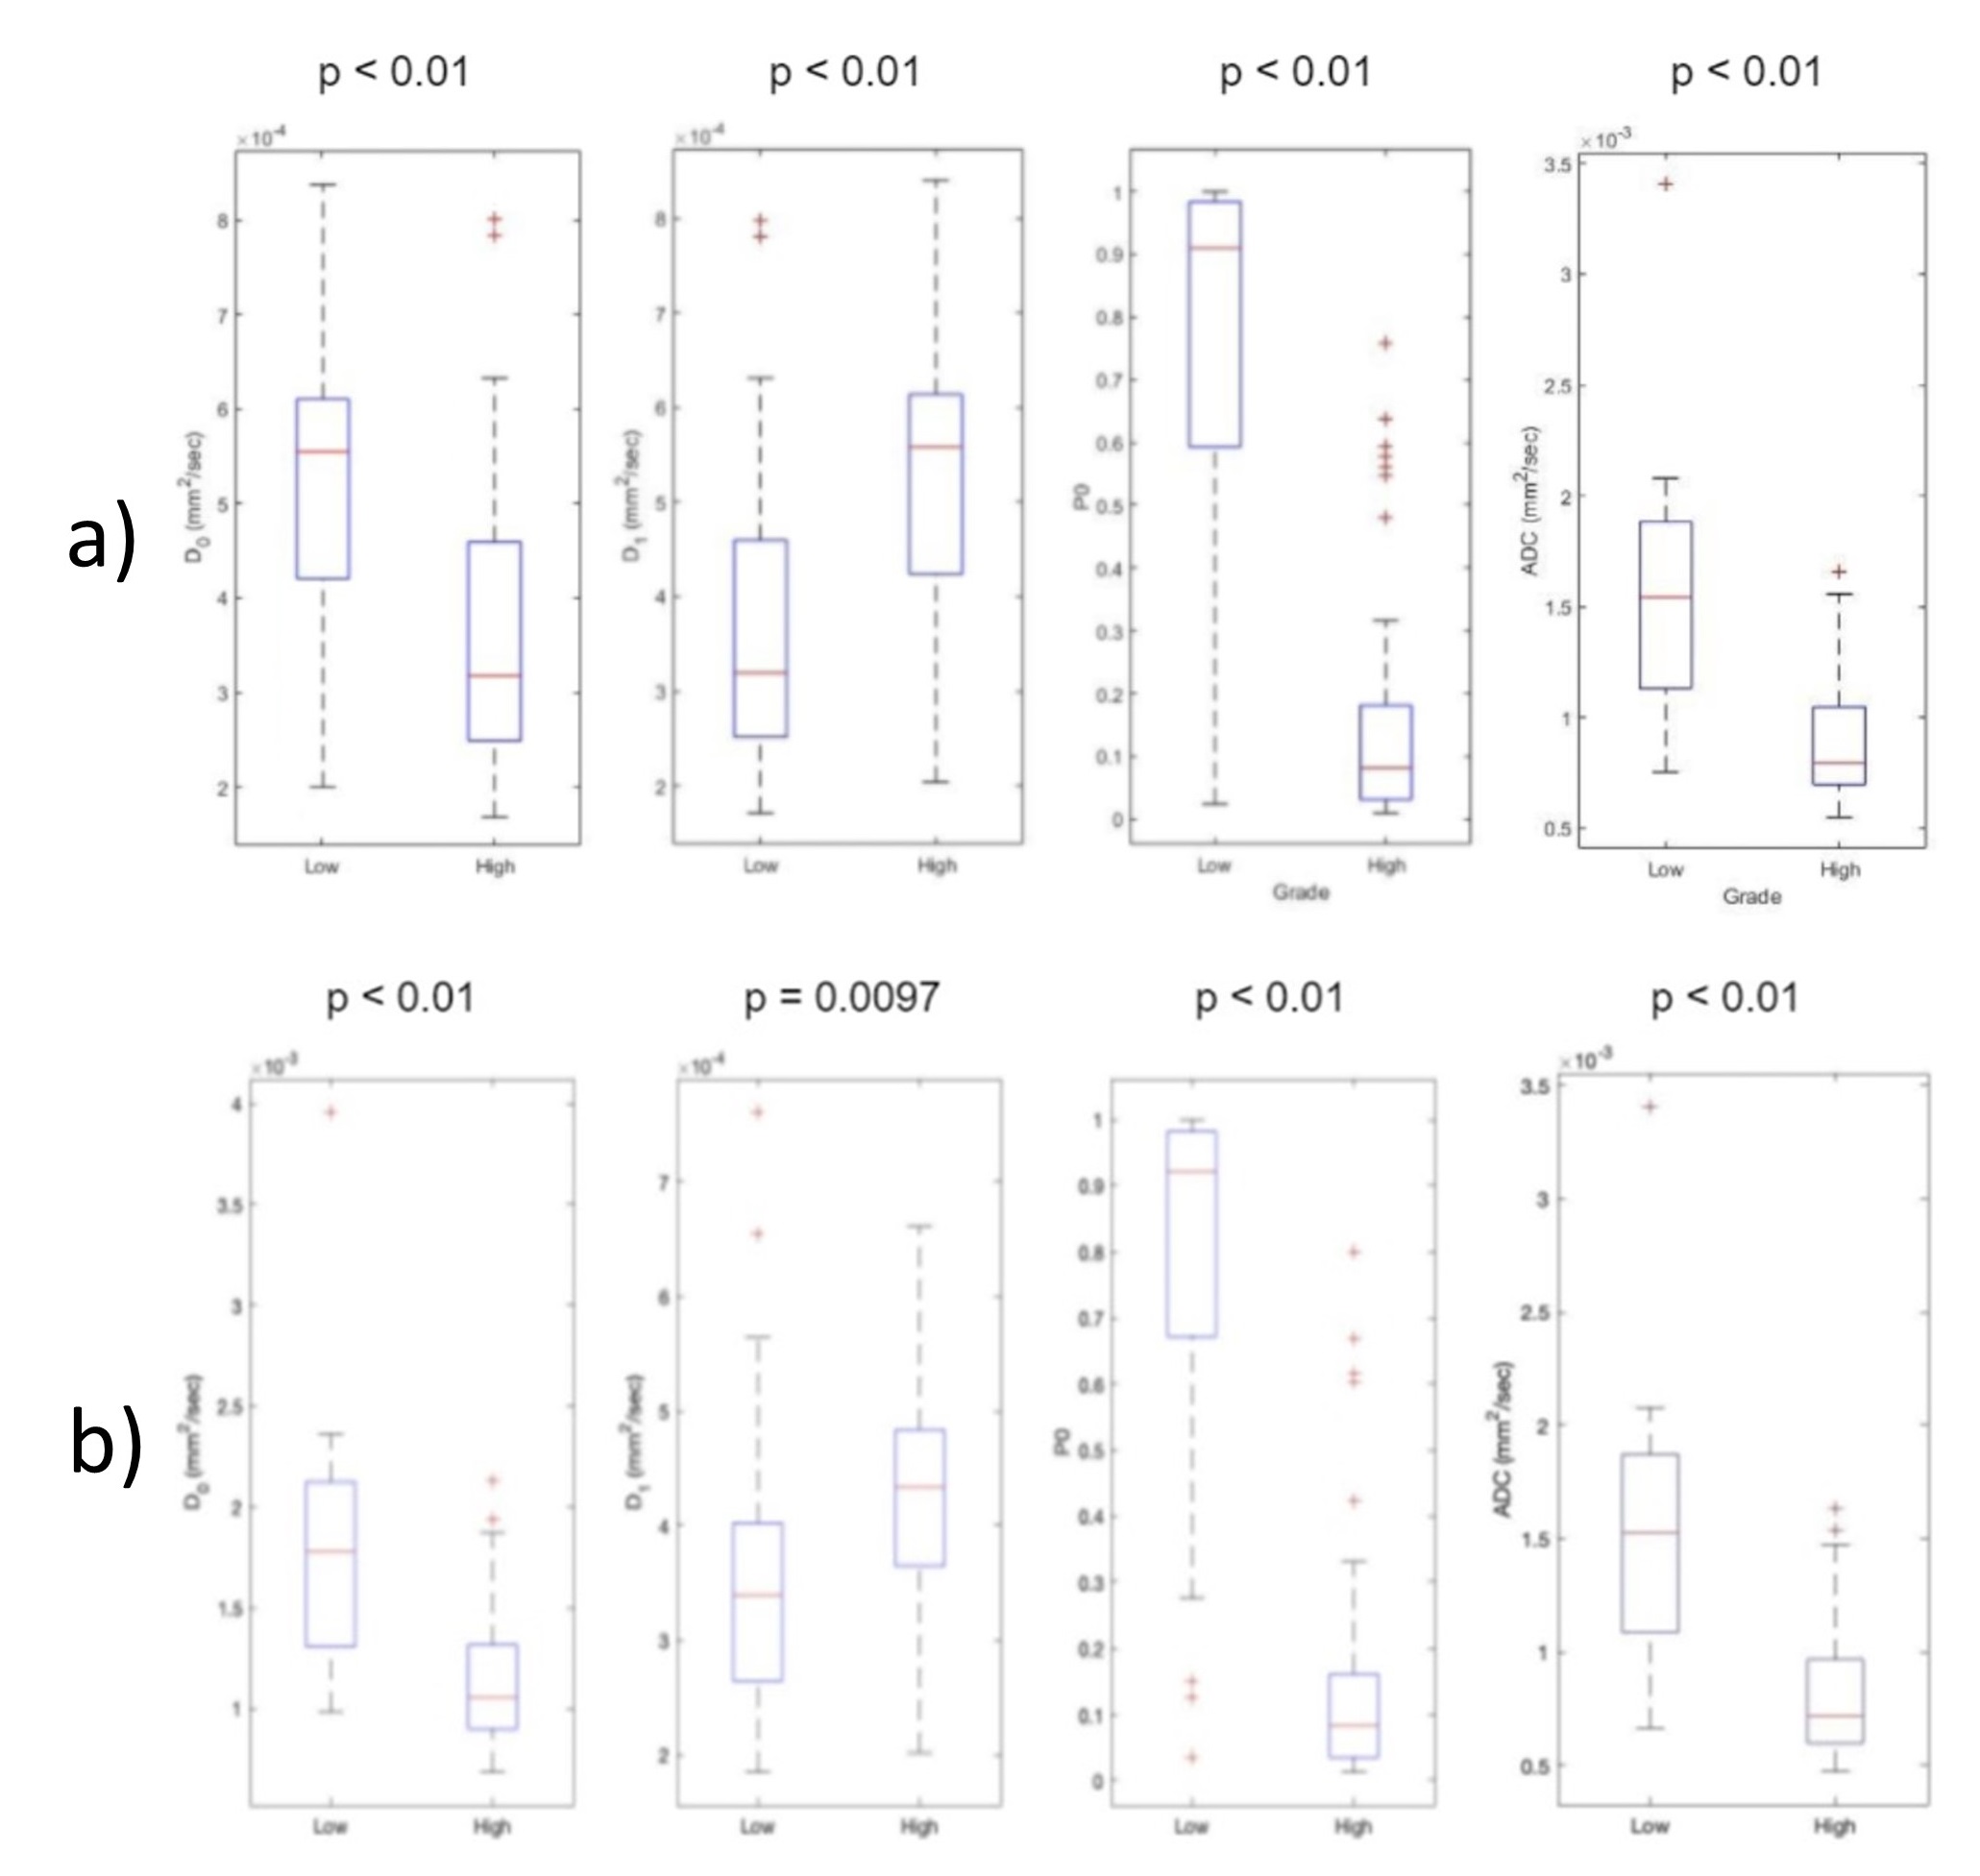
Figure 1 displays examples of VDC maps from a patient with a low-grade tumor (10-year-old boy with grade I pilocytic astrocytoma) and another patient with a high-grade tumor (2-year-old boy with grade IV medulloblastoma). D0 showed a higher value in the low-grade than in the high-grade tumor, while D1 exhibited a lower value in the same comparison.For group comparisons, D0, D1, P0, and ADC of low- and high-grade tumors are illustrated in Figure 2A-B for the two b-value ranges, respectively. There was a statistically significant difference between low- and high-grade tumors (P < 0.01) in all comparisons. Among the individual parameters, P0 produced the most striking separation between the tumor grades. Overall, no substantial difference was observed between the two b-value ranges.
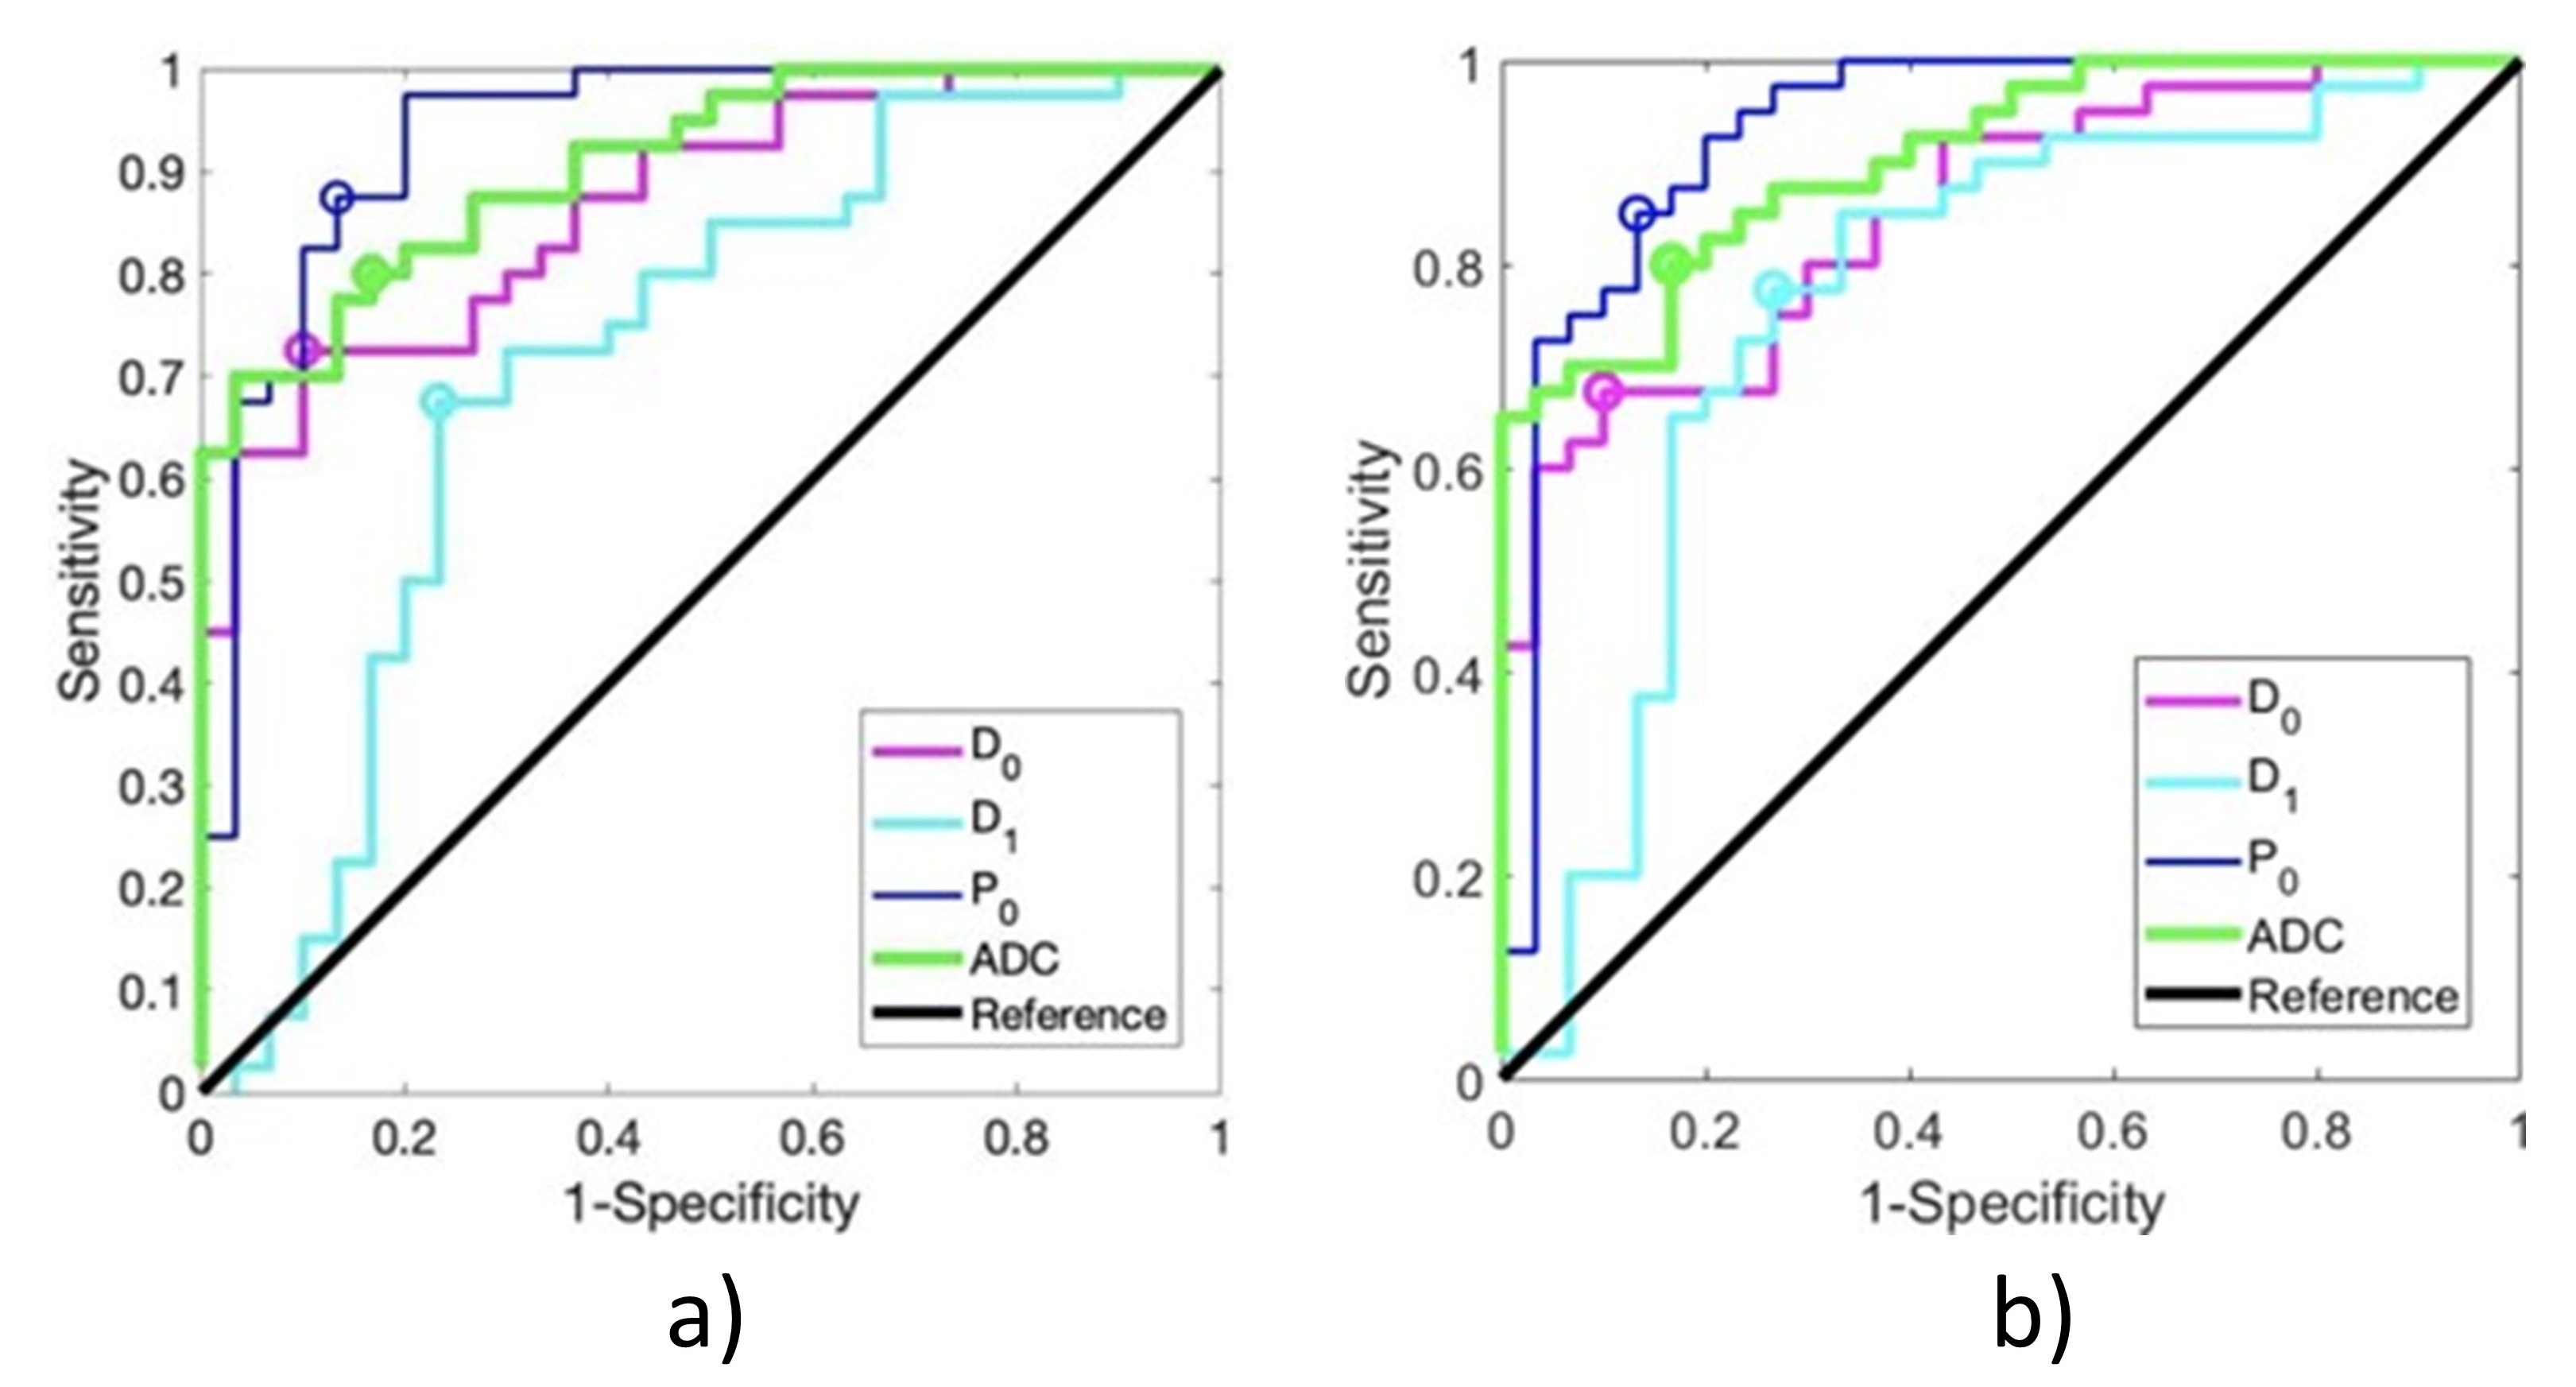
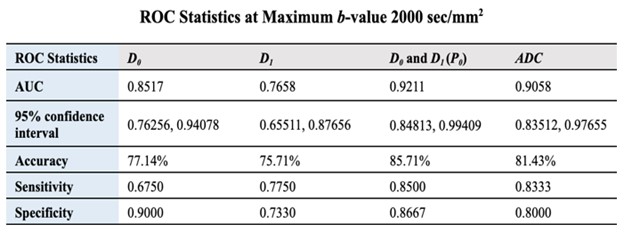
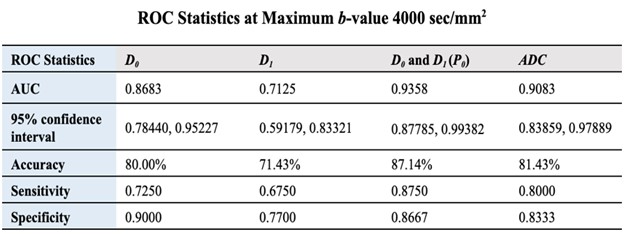
Figure 3A-B shows the ROC curves based on D0, D1, P0, and ADC for differentiating low- and high-grade pediatric brain tumors with the narrower and boarder b-value ranges, respectively. Both figures indicate that although D0 or D1 did not show noticeable improvement over ADC, the combination of D0 and D1 substantially outperformed ADC. Tables in Figures 4 and 5 summarize the quantitative results from the ROC analysis for the two b-value ranges. Overall, the broader b-value range did not exhibit a substantially better performance than the narrower b-value range.
Discussion and Conclusion
We have demonstrated that the VDC diffusion model is capable of differentiating between low- and high-grade pediatric brain tumors. Its performance can be greatly enhanced by combining the two parameters – D0 and D1, which collectively outperformed ADC. Increasing the maximal b-value from 2000 to 4000 sec/mm2 did not noticeably improve the performance. This finding can relax the need for high b-values, leading to improved signal-to-noise ratio and shorter scan times. These benefits may be extended to other applications.Acknowledgements
We thank Drs. Yuhua Li and He Wang for providing the pediatric brain tumor cases, and Drs. Xie and Wanamaker for assistance with the regions-of-interest analysis. JF and WH contributed equally and share the first authorship.References
1.Curtin SC, Minino AM, Anderson RN. Declines in cancer death rates among children and adolescents in the United States, 1999–2014. NCHS data brief, no 257. Hyattsville, MD: National Center for Health Statistics. 2016.
2. Magin RL, Karaman MM, Hall MG, Zhu W, Zhou XJ (2019). Capturing complexity of the diffusion-weighted MR signal decay. Magnetic Resonance Imaging, 56, 110-118.
3. Gupta A and Dwivedi T (2017). A simplified overview of World Health Organization classification update of central nervous system tumors 2016. Journal of Neurosciences in Rural Practice, 8(4), 629–641.
Figures