4024
Detecting schizophrenia using structural and synthetic cerebral blood volume MRI with deep learning1Department of Biomedical Engineering, Columbia University, New York, NY, United States, 2Department of Psychiatry, Columbia University, New York, NY, United States, 3Department of Neurology, Columbia University, New York, NY, United States
Synopsis
Introduction
Schizophrenia, one kind of common psychosis, is a neurological disorder characterized by progressive symptoms such as hallucinations and emotion dysregulation. Accurate and rapid detection of schizophrenia is a pressing problem as there is currently no apparent biomarker that indicates the onset of the disease. The prior research utilized deep learning to capture the schizophrenia-related pattern from structure scans but the model could not generalize well1. Additionally, functional and structural scans were fused in deep learning for schizophrenia detection but the performance could be still improved2. As a result, in this study, we aim to propose one 3D CNN-based neural network using structural and synthetic cerebral blood volume MRI to improve the detection of schizophrenia. The proposed method outperforms the current benchmark model and accurately localizes the brain regions related to schizophrenia identification.Material and Methods
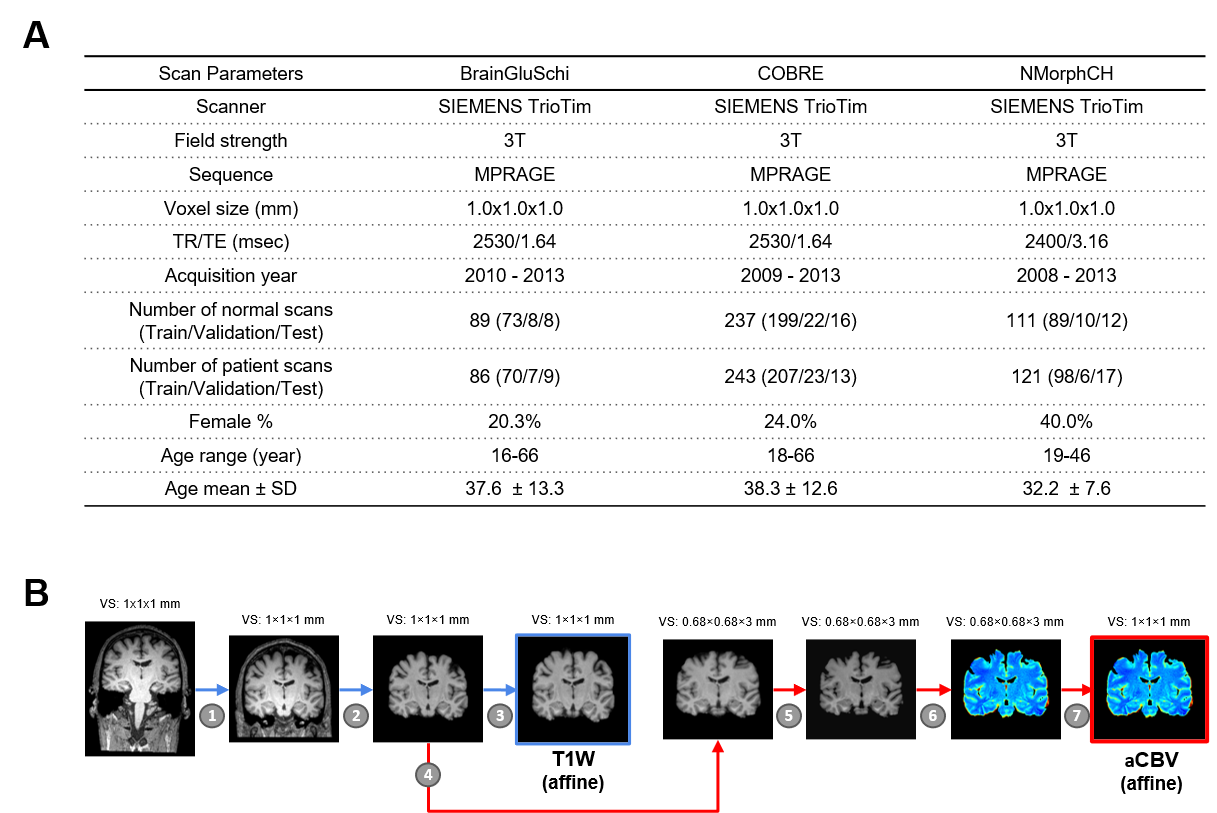
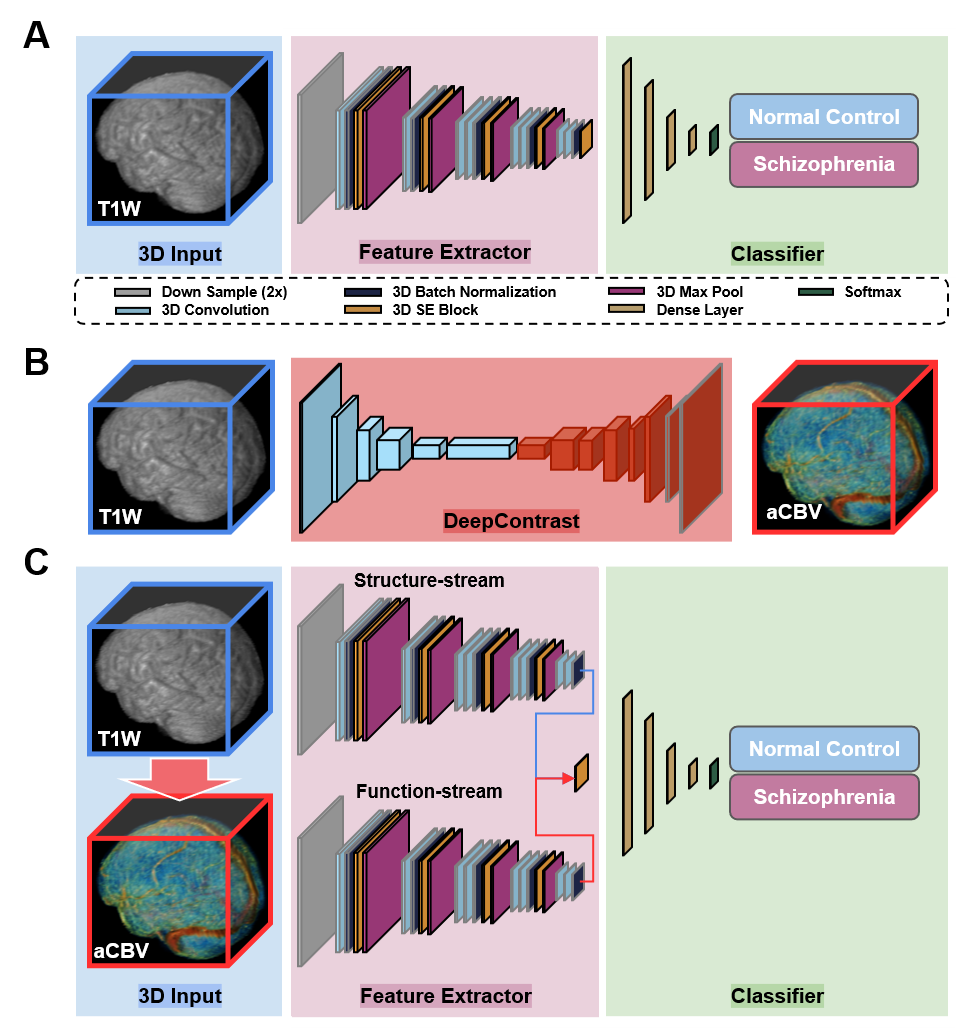
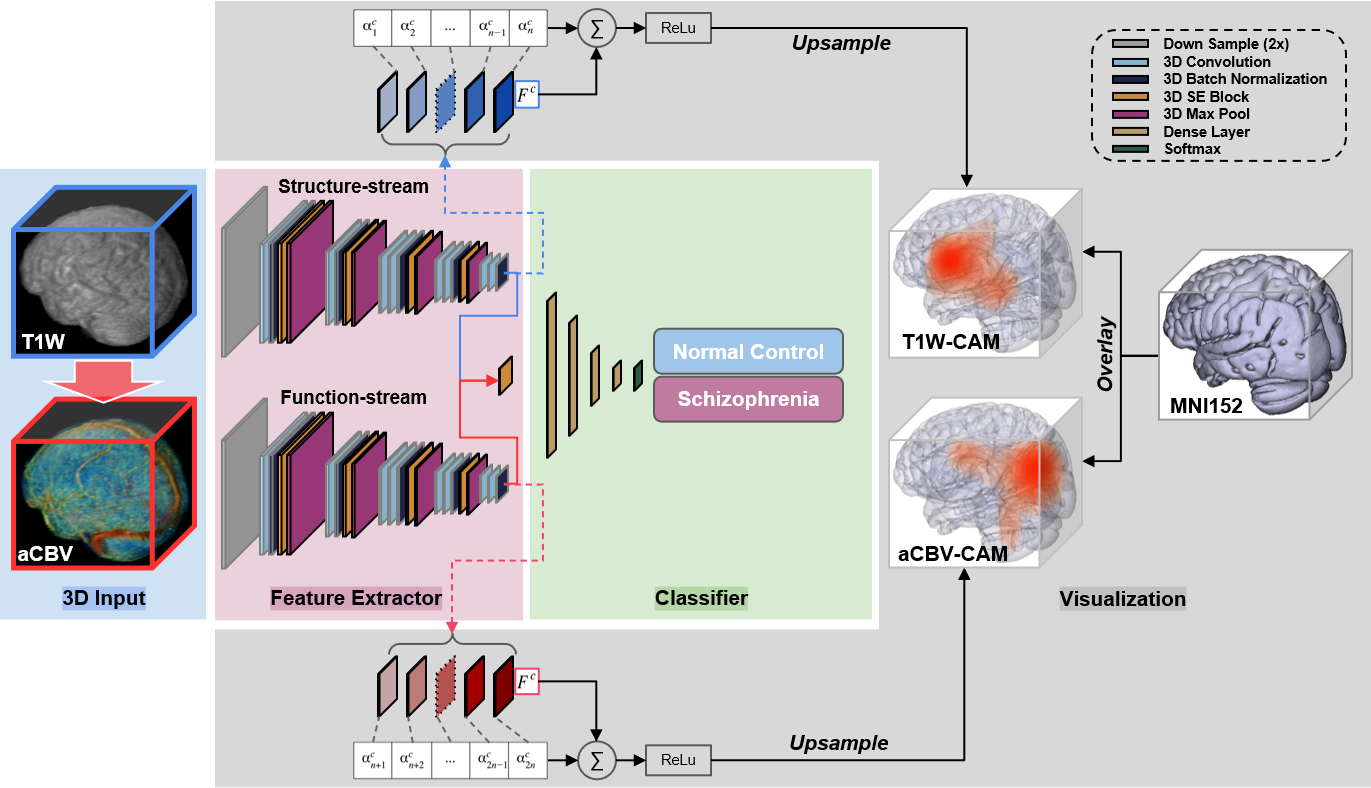
Data PreparationThe neuroimaging data used in the study was downloaded from the SchizConnect database (http://schizconnect.org/). Data from several studies like COBRE3, BrainGluSchi4 and NmorphCH5 were collected and organized in this public database. Detailed information regarding these datasets is illustrated in Fig. 1A. In our study, all of the input MRI images went through standard pre-processing operations including skull stripping6, affine registration, histogram warping7. The preprocessing pipeline is shown in Fig. 1B. One pre-trained network called DeepContrast8 was utilized to perform quantitative structural-to-functional mapping of MRI brain scans. DeepContrast takes in T1W scans and generates voxel-level predictions of the cerebral blood volume (CBV). The details of DeepContrast are illustrated in Fig. 2B. Model architecture The architecture 3D “VGG-11 with batch normalization” adapted from (VGG-19BN)9 was developed (Fig. 2A). This modified single-stream 3D VGG model with batch normalization and squeeze-and-excitation block (SE-VGG-11BN) is composed of two basic components: feature extraction and classification. In the feature extraction part, 3D squeeze-and-excitation (SE)10 operations were introduced to effectively fuse the information from different channels. When structural and synthetic functional MRI were used as input, a dual-stream SE-VGG-11BN composed of two single-stream SE-VGG-11BN was used (shown in Fig. 2C). To validate the models, gradient activation maps (Grad-CAM)11 were introduced to our study to confirm whether the model focused on task-related patterns instead of irrelevant information in the data. We further investigated the brain regions that had the most contributions to the schizophrenia classification task by visualizing the class activation maps (CAM). The details of gradient activation map generation are shown in Fig. 4.
Results
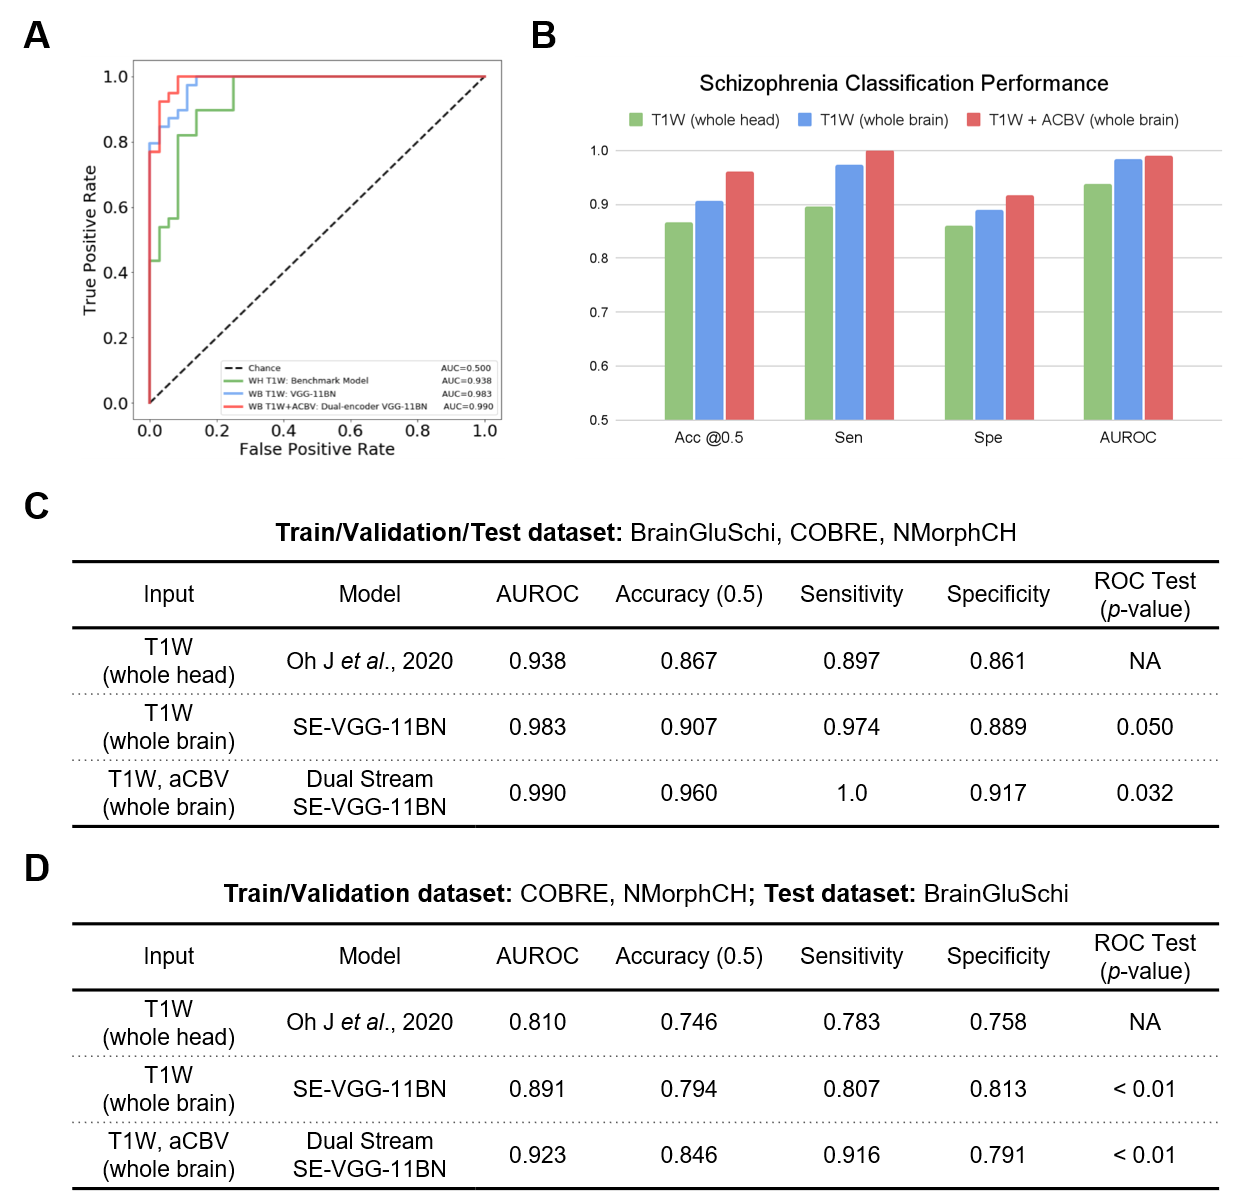
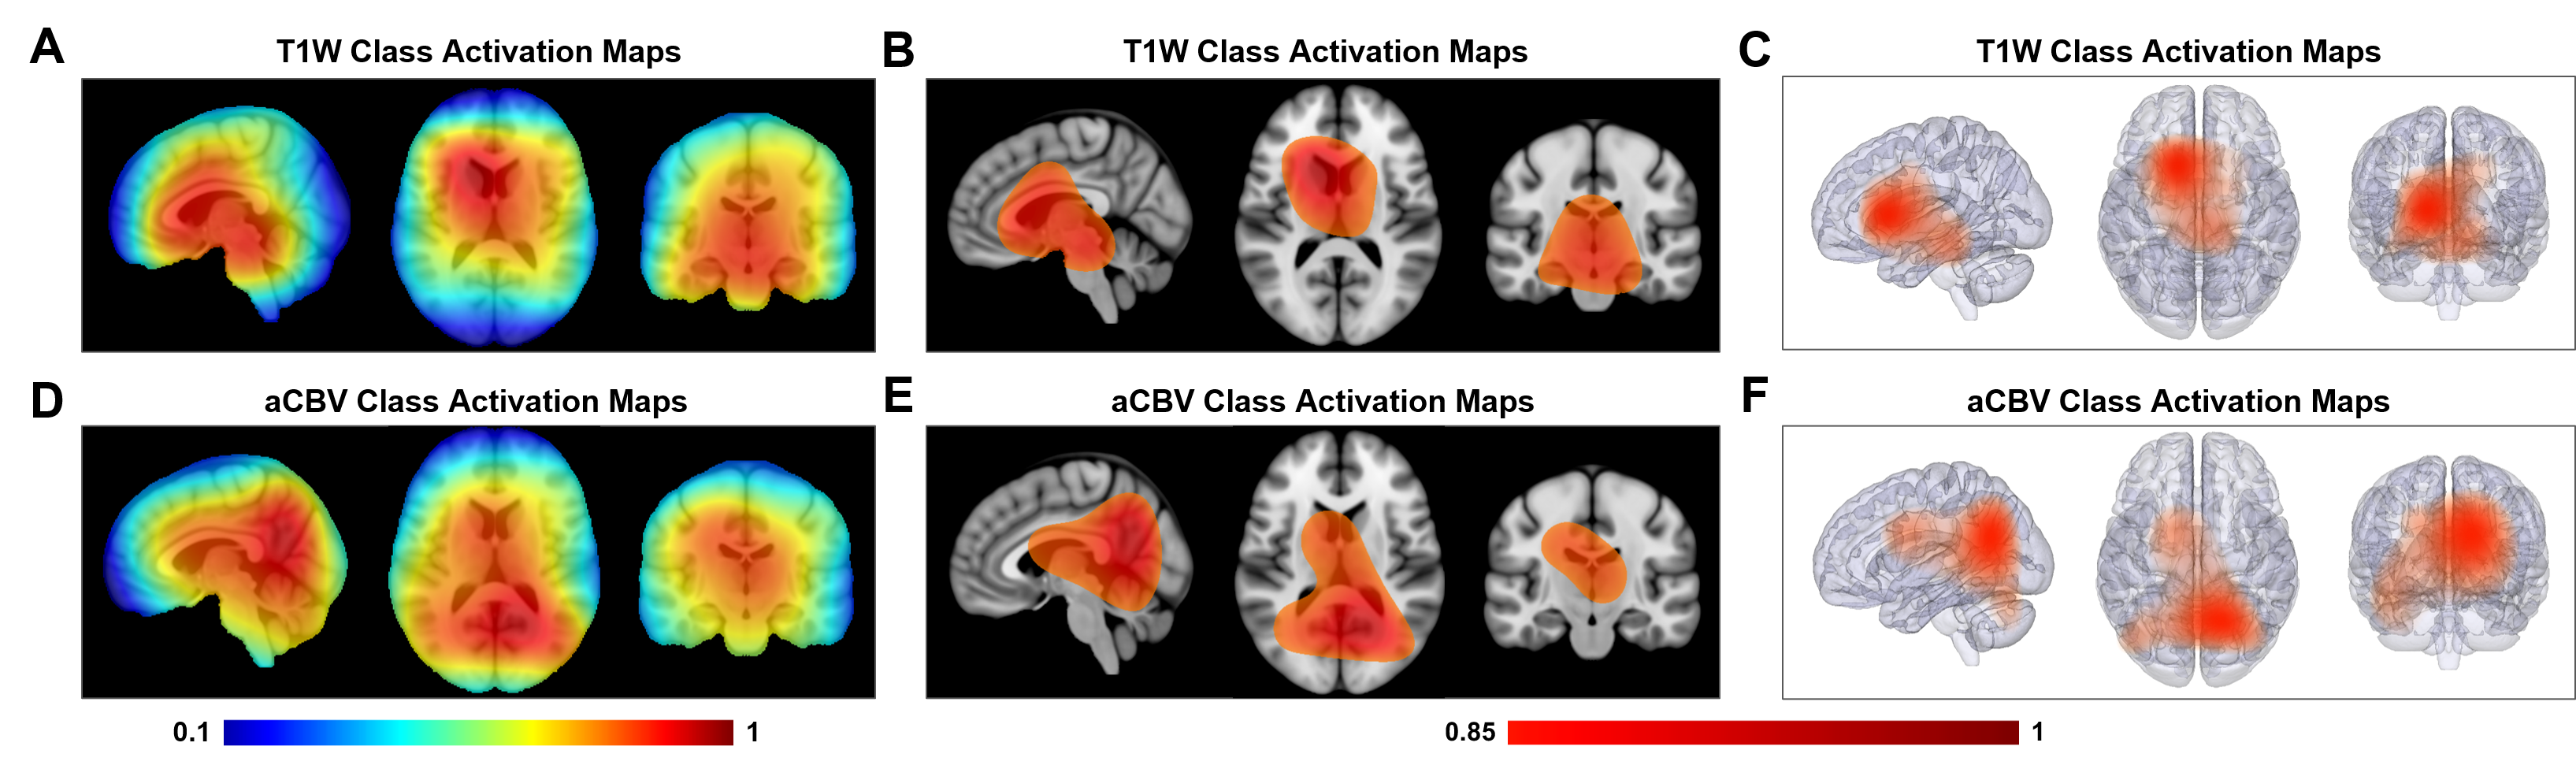
After training the models, we tested the models on the same stand-alone set of scans, 51 with schizophrenia and 49 without schizophrenia. Firstly, the SE-VGG-11BN model using structural T1 WB scans exhibited better performance than the benchmark model across all metrics. The quantitative performance metrics are summarized in Fig. 3B and Fig. 3C. Secondly, when inspecting the ROC curves (Fig. 3A), we found that the dual-stream SE-VGG-11BN model with the input of structural T1 WB scans and synthesized functional aCBV maps performed significantly better than the benchmark model only using structural T1 WH scans based in the DeLong’s test. Thirdly, we observed significantly superior AUROC performance of SE-VGG-11BN and dual-stream SE-VGG-11BN over the benchmark model when the BrainGluSchi dataset was used only for test and the COBRE and NMorphCH datasets were used for the training and validation (Fig. 3D). These results validate the generality of our model. The class activation map of the best-performing classifier is illustrated in Fig. 5. The most highly contributing structural feature information comes from the temporal and frontal lobe, while the most highly contributing functional feature information comes from the parietal and occipital lobe and the ventricle area.Discussion and Conclusion
Models, either SE-VGG-11BN or dual-stream SE-VGG-11BN exhibit better performance than the benchmark model. The introduction of attention blocks could help the model fuse the extracted information. Additionally, standard preprocessing pipelines absent in the benchmark method could help alleviate the misleading and disease-unrelated factors. The dual-stream SE-VGG11-BN integrating T1W structure data and synthesized functional aCBV data outperform the SE-VGG11-BN only using T1W structure data. Notably, the marriage of structure data and synthesized functional data greatly improved classification across all metrics. The integrated features provide information from different perspectives. Besides this, two independent streams could allow information effective extraction before information incorporation. The class activation map for the best-performing model (dual-stream SE-VGG-11BN) reveals some interesting patterns, which are closely related to brain lobes12-15.Acknowledgements
This study was funded by the Seed Grant Program for MR Studies of the Zuckerman Mind Brain Behavior Institute at Columbia University and Columbia MR Research Center site.References
[1] Oh, Jihoon, et al. "Identifying schizophrenia using structural MRI with a deep learning algorithm." Frontiers in psychiatry 11 (2020): 16.
[2] Hu, Mengjiao, et al. "Structural and diffusion MRI based schizophrenia classification using 2D pretrained and 3D naive Convolutional Neural Networks." Schizophrenia research (2021).
[3] Chyzhyk, Darya, Alexandre Savio, and Manuel Graña. "Computer aided diagnosis of schizophrenia on resting state fMRI data by ensembles of ELM." Neural Networks 68 (2015): 23-33.
[4] Bustillo, Juan R., et al. "Glutamatergic and neuronal dysfunction in gray and white matter: a spectroscopic imaging study in a large schizophrenia sample." Schizophrenia bulletin 43.3 (2017): 611-619.
[5] Alpert, Kathryn, et al. "The northwestern university neuroimaging data archive (NUNDA)." NeuroImage 124 (2016): 1131-1136.
[6] Smith, Stephen M. "Fast robust automated brain extraction." Human brain mapping 17.3 (2002): 143-155.
[7] Wagenknecht, Gudrun, et al. "Dynamic programming algorithm for contrast correction in medical images." Nonlinear Image Processing XI. Vol. 3961. International Society for Optics and Photonics, 2000.
[8] Liu, Chen, et al. "Deep learning substitutes gadolinium in detecting functional and structural brain lesions with mri." (2020).
[9] Simon, Marcel, Erik Rodner, and Joachim Denzler. "Imagenet pre-trained models with batch normalization." arXiv preprint arXiv:1612.01452 (2016).
[10] Hu, Jie, Li Shen, and Gang Sun. "Squeeze-and-excitation networks." Proceedings of the IEEE conference on computer vision and pattern recognition. 2018.
[11] Zhou, Bolei, et al. "Learning deep features for discriminative localization." Proceedings of the IEEE conference on computer vision and pattern recognition. 2016.
[12] PERUZZO, D., et al. "Schizophrenia impact on perfusion parameters: a dynamic susceptibility contrast magnetic resonance imaging study." Proc. Intl. Soc. Mag. Reson. Med. Vol. 18. 1975.
[13] Spanier, Assaf B., et al. "Schizophrenia patients differentiation based on MR vascular perfusion and volumetric imaging." Medical Imaging 2015: Image Processing. Vol. 9413. International Society for Optics and Photonics, 2015.
[14] Squarcina, Letizia, et al. "The use of dynamic susceptibility contrast (DSC) MRI to automatically classify patients with first episode psychosis." Schizophrenia research 165.1 (2015): 38-44.
[15] Gaisler-Salomon, Inna, et al. "How high-resolution basal-state functional imaging can guide the development of new pharmacotherapies for schizophrenia." Schizophrenia bulletin 35.6 (2009): 1037-1044.
Figures