4021
Assessment of SAR variability across early gestational age subjects at 3T fetal MRI1Fetal‐Neonatal Neuroimaging & Developmental Science Center, Boston Children's Hospital, Boston, MA, United States, 2Harvard Medical School, Boston, MA, United States, 3Department of Radiology, Boston Children’s Hospital, Boston, MA, United States, 4Maternal Fetal Care Center, Boston Children’s Hospital, Boston, MA, United States, 5Department of Electrical Engineering and Computer Science, Massachusetts Institute of Technology, Cambridge, MA, United States, 6Harvard-MIT Health Sciences and Technology, Massachusetts Institute of Technology, Cambridge, MA, United States, 7Institute for Medical Engineering and Science, Massachusetts Institute of Technology, Cambridge, MA, United States, 8Athinoula A. Martinos Center for Biomedical Imaging, Massachusetts General Hospital, Charlestown, MA, United States
Synopsis
Despite the clinical and research potential of fetal MRI, there is no consensus on MRI safety in the 1st and early 2nd trimesters. Prior simulation studies at early gestational ages (GA) used only a single or unrealistic pregnant body models. To address this gap, we built 2 realistic uterine models for the early 2nd trimester and placed them into 3 existing pregnant body models at a later GA to investigate differences in RF exposure. Lower pSAR10g in both the fetus and amniotic fluid was observed in the early 2nd trimester models compared to later GA models.
Introduction
Although MRI is recommended as a useful complement to ultrasound for fetal evaluations,1 there is no consensus on the safety of MRI in the 1st and early 2nd trimesters due to lack of information and experience.2–5 Earlier numerical studies investigating fetal RF safety concerns were conducted on a few pregnant body models either built by merging uterus/fetal models with existing supine nonpregnant body models or by scaling the fetus for different stages of pregnancy, poorly representing the pregnant population across gestation.6–12 Building on our previous work with realistic pregnant body models ≥27weeks gestational age (GA),13 we generated 2 realistic uterine models (1 model at 13weeks 4days GA and 1 model at 19weeks GA) and swapped out the uterine model in 28 and 29 weeks GA pregnant body models to compare local SAR exposures to the same model with the later GA uterine model.Methods
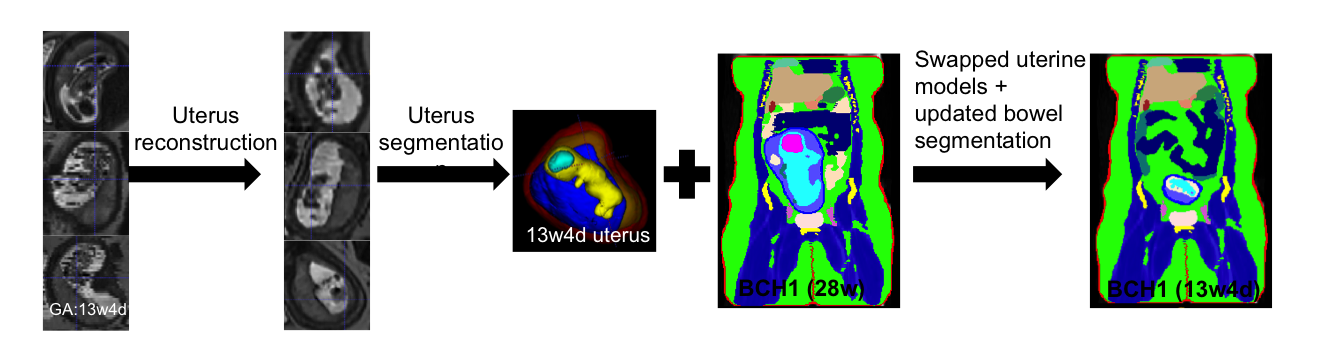
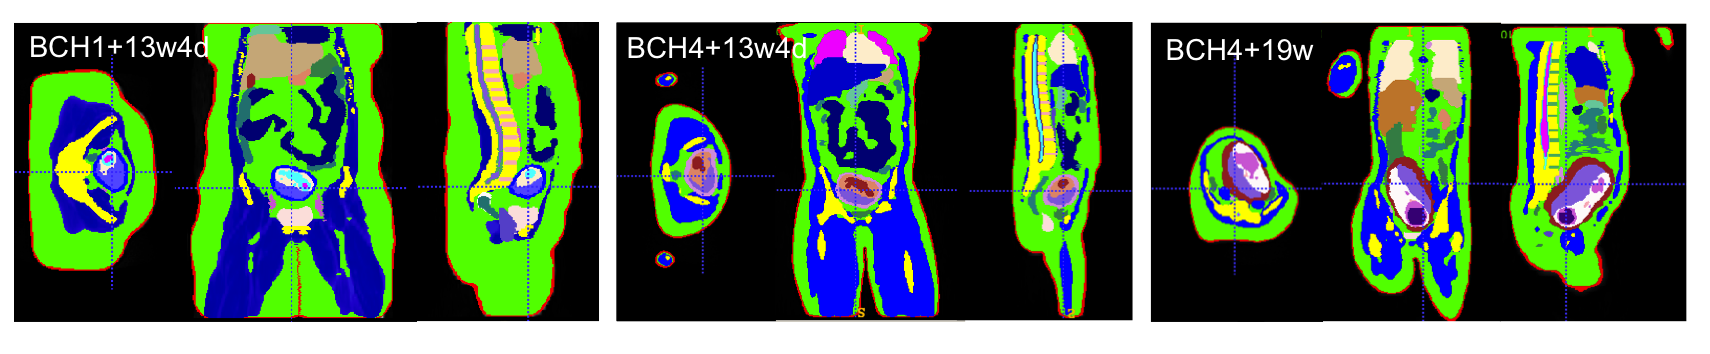
Data: Whole uterus HASTE images (resolution:1.4x1.4x4 mm3 , TR: 1600 ms, TE: 118 ms) at different orientations were collected from two pregnant subjects (one high risk pregnancy at 13weeks 4days GA with normally developed fetus and one normal pregnancy at 19weeks GA were included). Model generation: Deformable slice-to-volume registration (DSVR) reconstruction14 was applied to create motion free high resolution uterus volumes. These volumes were manually segmented in 3D Slicer15 into the following regions of interest (ROIs): uterine wall, placenta, amniotic fluid, fetus, fetal brain and umbilical cord. ROIs were interpolated to 2x2x2 mm3 resolution and then 3 pixel width smoothing was applied. Motion artifacts at ROI boundaries were smoothened manually. For maternal body models, we used 3 of our previously developed models (i.e., BCH1 at 28weeks GA, BCH4 at 29weeks GA, and BCH5 at 29weeks GA).13 The uterine models in BCH1 and BCH4 were replaced with the uterus model at 13weeks 4days GA. The uterus model in BCH5 was replaced with the uterus model at 19weeks GA. After replacing uterus models, maternal bowels and fat tissue were corrected manually using original images from lower GA subjects. Figure 1 shows the steps of the model generation for the 13weeks 4days GA uterine model inserted into the BCH1 body model. Electromagnetic (EM) simulations: Sim4Life (ZMT, Zurich, Switzerland) was used to perform EM simulations. Each segmented body model was uploaded as a raw file to Sim4life together with its associated descriptor file. The dielectric tissue properties were assigned according to our previous work.16 For comparison purposes, maternal body position of lower GA models was kept the same for higher GA versions. EM simulations were performed using two-port feed, 32 rungs, 123.2 MHz resonant shielded high-pass birdcage coil model for 2 W/kg constant maternal whole-body SAR exposure.13 Updated models with lower GA uterus models were compared with the original models. The magnitude of electric field and B1+ (i.e.,|B1+|) were calculated and 10g average peak local SAR (pSAR10g) and average SAR were reported.Results and Discussion
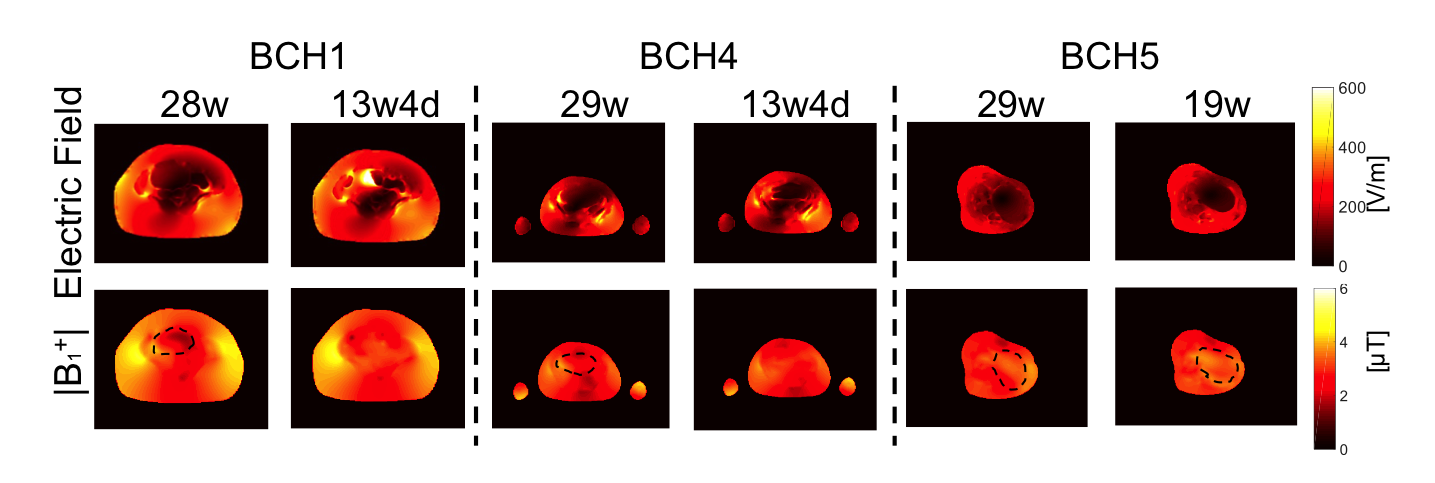
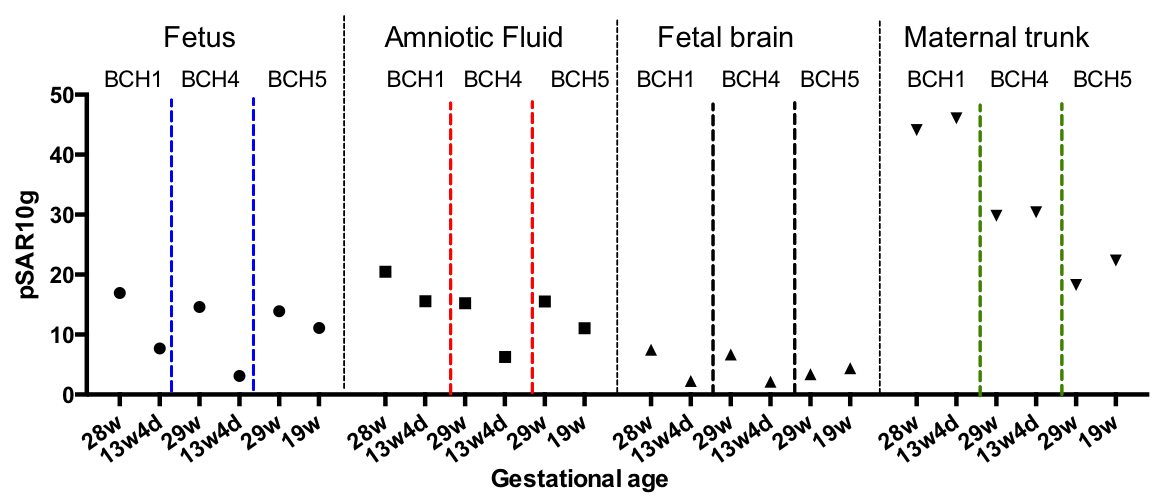
Figure 2 shows updated models with lower GA uterus. Figure 3 shows the spatial variation in the magnitude of electric field and |B1+| at isocenter. Uterus position is indicated with black dashed circle on |B1+| maps. The average |B1+| and the magnitude of electric field at isocenter in updated models with lower GA uterus were similar to the original models. Figure 4 shows the comparison of pSAR10g estimated in the fetus, amniotic fluid, fetal brain, and maternal trunk for models with two different GA uterine models. We observed lower pSAR10g and average SAR estimates in the fetus and amniotic fluid for lower GA uterine models (i.e. BCH1 pSAR10g: 16.9W/kg and 20.49W/kg (28w); 7.68W/kg and 15.58W/kg (13w4d); average SAR: 4.35W/kg and 6.42W/kg (28w); 1.07W/kg and 4.28W/kg (13w4d); BCH4 pSAR10g: 14.6W/kg and 15.58W/kg (29w); 3.12W/kg and 6.25W/kg (13w4d); average SAR: 2.70W/kg and 6.44W/kg (29w); 0.95W/kg and 1.95W/kg (13w4d); BCH5 pSAR10g: 13.9 W/kg and 15.5W/kg (29w); 11.1W/kg and 11.05W/kg (19w); average SAR: 3.99 W/kg and 5.90W/kg (29w); 2.76W/kg and 4.94W/kg (19w) for fetus and amniotic fluid, respectively). This observation is similar to what was previously reported by Murbach at el.17 and Shamsi et al.18 for 3 months (9-13weeks) models compared to 7 months (27-30weeks) models. The lower fetal SAR in lower GA might be due to the more effective shielding of the amniotic fluid around a small fetus, and the lower amniotic fluid SAR in lower GA might be due to the smaller size of the uterus and more effective shielding of the surrounding maternal tissues compared to higher GA. For maternal trunk, we observed similar pSAR10g values at similar locations.Conclusion
We built 3 realistic pregnant body models of the early 2nd trimester and compared SAR to that of the same model with late 2nd and 3rd trimester uteruses to investigate changes in MRI RF exposure and observed lower pSAR10g in both the fetus and amniotic fluid in the early 2nd trimester.Acknowledgements
This work was supported by R01HD100009, U01HD087211, R01EB017337.References
1. American College of Radiology. ACR‐SPR practice guideline forthe safe and optimal performance of fetal magnetic resonance imaging(MRI). 2015;13:4. https ://www.acr.org/-/media/ ACR/Files/Pract ice-Param eters/mr-fetal.pdf. Accessed April 12, 2016.
2. International Commission on Non-Ionizing Radiation Protection. Medical magnetic resonance (MR) procedures: protection of patients. Health Phys. 87, 197–216 (2004).
3. Expert Panel on MR Safety et al. ACR guidance document on MR safe practices: 2013. J. Magn. Reson. Imaging 37, 501–530 (2013).
4. US Department of Health and Human Services. Food and Drug Administration. Center for Devices and Radiological Health. Criteria for Significant Risk Investigations of Magnetic Resonance Diagnostic Devices - Guidance for Industry and Food and Drug Administration Staff. http://www.fda.gov/MedicalDevices/ DeviceRegulationandGuidance/GuidanceDocuments/ucm072686.htm (2014).
5. British Association of Perinatal Medicine. Fetal and Neonatal Brain Magnetic Resonance Imaging: Clinical Indications, Acquisitions and Reporting - A Framework for Practice (2016). https://www.bapm.org/resources/fetal-and-neonatal-brain-magnetic-resonance-imaging-clinical-indications-acquisitions-and.
6. Hand, J. W., Li, Y., Thomas, E. L., Rutherford, M. A. & Hajnal, J. V. Prediction of specific absorption rate in mother and fetus associated with MRI examinations during pregnancy. Magn. Reson. Med. 55, 883–893 (2006).
7. Saito, K., Kikuchi, S., Takahashi, M., Ito, K. & Ikehira, H. SAR Estimations of Pregnant Woman during MR Imaging for Abdomen by Numerical Calculations. in Proceedings 18th Int. Zurich Symposium on EMC 45–48 (2007).
8. Pediaditis, M., Leitgeb, N. & Cech, R. RF-EMF exposure of fetus and mother during magnetic resonance imaging. Phys. Med. Biol. 53, 7187–7195 (2008).
9. Hand, J. W., Li, Y. & Hajnal, J. V. Numerical study of RF exposure and the resulting temperature rise in the foetus during a magnetic resonance procedure. Phys. Med. Biol. 55, 913–930 (2010).
10. Kikuchi, S., Saito, K., Takahashi, M. & Ito, K. Temperature elevation in the fetus from electromagnetic exposure during magnetic resonance imaging. Phys. Med. Biol. 55, 2411–2426 (2010).
11. Murbach, M. et al. Local SAR enhancements in anatomically correct children and adult models as a function of position within 1.5 T MR body coil. Prog. Biophys. Mol. Biol. 107, 428–433 (2011).
12. Malik, S. J., Hand, J. W. & Hajnal, J. V. The effect of variable amniotic fluid conductivity and fetal tissues properties on B1+ and local SAR for fetal imaging at 3T. in Proc Intl Soc Mag Reson Med 5578 (2017).
13. Abaci Turk, E. et al. Safety of 3T MRI Scan for pregnant women: Effect of Maternal Size, Maternal Position and Twin Pregnancy. in Proc Intl Soc Mag Reson Med 4810 (2017).
14. Uus, A. et al. Deformable Slice-to-Volume Registration for Motion Correction of Fetal Body and Placenta MRI. IEEE Trans. Med. Imaging 39, 2750–2759 (2020).
15. Fedorov, A. et al. 3D Slicer as an image computing platform for the Quantitative Imaging Network. Magn. Reson. Imaging 30, 1323–1341 (2012).
16. Abaci Turk, E. et al. Individual variation in simulated fetal SAR assessed in multiple body models. Magn. Reson. Med. 83, 1418–1428 (2020).
17. Murbach, M. et al. Pregnant women models analyzed for RF exposure and temperature increase in 3TRF shimmed birdcages: Impact of RF Shimming on MRI Exposure of Pregnant Women. Magn. Reson. Med. 77, C1–C1 (2017).
18. Shamsi, S., g. Wu, D., Chen, J., Liu, R. & Kainz, W. SAR Evaluation of Pregnant Woman Models in 64 MHz MRI Birdcage Coil. in 2006 IEEE MTT-S International Microwave Symposium Digest 225–228 (ieeexplore.ieee.org, 2006).
Figures