4020
Whole-Abdomen Metabolic Imaging in Healthy Volunteers Using Hyperpolarized [1-13C]pyruvate MRI1Radiology & Biomedical Imaging, University of California, San Francisco, San Francisco, CA, United States, 2Radiology, Washington University in St. Louis, St. Louis, MO, United States
Synopsis
Whole-abdomen imaging with hyperpolarized 13C is challenging due to B0 and B1 inhomogeneities, respiratory motion, and broad spatial coverage. There is also little baseline data about healthy metabolism in abdominal organs. We develop and describe a reliable imaging method to overcome these challenges, enabling metabolic imaging of the entire abdomen in a series of healthy volunteers. We establish normal values for conversion of HP [1-13C]pyruvate to lactate and alanine in key organs such as the liver, kidneys, pancreas, and spleen. Methods established here set a firm foundation for investigating a broad spectrum of metabolic and neoplastic abnormalities in the liver.
Introduction
Hyperpolarized (HP) 13C MRI is a novel metabolic imaging technique enabling real-time in vivo measurements of enzyme-catalyzed pyruvate metabolism and has been applied to prostate, brain, cardiac, and kidney imaging.1–4 Of primary interest are the conversions of pyruvate to lactate via lactate dehydrogenase (LDH), which is upregulated in cancers as well as animal models of inflammation and fatty liver disease,5 and of pyruvate to alanine via alanine aminotransferase (ALT). HP 13C MRI may provide valuable metabolic biomarkers for staging and assessing treatment response in these diseases. Human clinical research studies are underway at numerous sites around the world. However, whole-abdomen imaging with HP 13C remains challenging, mainly due to B0 and B1 inhomogeneities, respiratory motion, and the need for broad spatial coverage. In addition, there is little baseline data about HP 13C metabolite levels in healthy people. To investigate baseline energetics and the feasibility of whole-abdomen coverage, we studied HP 13C-pyruvate metabolism in multiple organs of healthy volunteers.Methods
After IRB approval, six healthy subjects underwent HP 13C MRI on a clinical 3 T scanner (MR750, GE Healthcare, Milwaukee, WI) with a volumetric transmitter and an 8-channel flexible receiver array (QTAR, Clinical MR Solutions, Brookfield, WI) that covered the whole abdomen. T1- and T2-weighted 1H images were acquired for anatomic registration. A volumetric multi-echo Dixon scan was used generate B0 field maps. Localized shimming was used to correct for through-plane B0 inhomogeneities.After injecting 0.43 mL/kg of 250 mM HP [1-13C]pyruvate, signals from [1-13C]pyruvate, [1-13C]lactate and [1-13C]alanine, were acquired using a multi-slice spectrally-selective EPI acquisition2 with flip angles of 30° for pyruvate, 60° for lactate and alanine. Seven to fourteen 2 cm-thick slices (depending on coverage) were acquired every 3 s (total scan time 1 minute, in-plane voxel size 2 x 2 cm2, matrix size 16 x 16).
Data were phase corrected, Fourier transformed, pre-whitened, and coil-combined using pyruvate to estimate the coil weights.6 Data were denoised using a patch-based higher-order singular value decomposition.7 First-order conversion rates of pyruvate to lactate (kPL) and of pyruvate to alanine (kPA) were computed using an inputless two-site exchange model.8 Metabolite signals were summed over the entire time course to produce metabolite maps. Using anatomic references, 3D ROIs were drawn for the liver, kidneys, pancreas, and spleen.
Results
Figure 1 shows axial B0 maps for two slices of interest before and after localized shimming. Before B0 corrections, the liver and the kidneys had a frequency offset upwards of 143 1H Hz. After B0 corrections, they had a frequency offset no more than 84 1H Hz. Figure 2 shows the first 42 seconds of the alanine dynamics before and after denoising for three slices from a representative dataset. The fifth timepoint images (time = 12 s) before and after denoising are enlarged on the right side. Plots of the dynamic curves for each metabolite in the right kidney, liver, spleen, and pancreas are shown in Figure 3. For a representative volunteer, the metabolite AUC maps are displayed in Figure 4. The mean pyruvate, lactate, and alanine signals within each organ for this volunteer are shown in the top bar graph. Below are the averaged kPL and kPA values per organ for all six healthy volunteers.Discussion
The B0 maps shown in Figure 1 depicted in- and through-plane B0 inhomogeneities which could be reduced using a localized shim box and further manual tuning. These adjustments were necessary as the 13C RF excitation pulse bandwidth was 100 Hz, smaller than the frequency offset between organs before B0 corrections (143 1H Hz). After corrections, the frequency offset was 84 1H Hz, sufficiently low for the excitation bandwidth. The patch-based denoising method also greatly improved SNR. After denoising, metabolite signals matched organ anatomy, such as the high alanine signal in the pancreas delineating the pancreas’s anatomical structure.Each organ exhibited distinct pyruvate uptake and metabolite dynamics. Compared to other organs, the liver had a delayed and broadened pyruvate peak, with similar broadening of downstream metabolites, likely reflecting the unique dual blood-supply that feeds the liver. The summed metabolite maps (Figure 4) showed absolute metabolite signals from the kidneys and spleen were 3-6 times higher than those from liver and pancreas, likely reflecting differences in overall perfusion. Although absolute metabolite signals were lower in the liver, kPL and kPA were both higher in the liver than in other abdominal organs, indicating higher relative production of these metabolites. Right and left kidney metabolism were symmetric as expected. The pancreas showed higher levels of alanine production relative to other organs, possibly due to high levels of protein synthesis.
Conclusions
We developed a reliable method for acquiring HP 13C metabolic images of multiple organs, overcoming challenges of broad spatial coverage as well as B0 and B1 inhomogeneities. This enabled us to metabolically characterize the healthy liver, kidneys, pancreas, and spleen. To our knowledge, this is the first presentation of healthy metabolism in the liver with other abdominal organs collectively, as well as the first presentation of kPA, the conversion of pyruvate to alanine. This normative data will be valuable in further investigations of cancer as well as metabolic liver diseases.Acknowledgements
This work was supported by NIH grants NIDDK 5R01DK115987 and P41 EB013598.References
- Chen HY, Aggarwal R, Bok RA, et al. Hyperpolarized 13C-pyruvate MRI detects real-time metabolic flux in prostate cancer metastases to bone and liver: a clinical feasibility study. Prostate Cancer Prostatic Dis. 2020;23(2):269-276. doi:10.1038/s41391-019-0180-z
- Gordon JW, Chen HY, Autry A, et al. Translation of Carbon-13 EPI for hyperpolarized MR molecular imaging of prostate and brain cancer patients. Magn Reson Med. 2019;81(4):2702-2709. doi:10.1002/mrm.27549
- Cunningham CH, Lau JYC, Chen AP, et al. Hyperpolarized 13C Metabolic MRI of the Human Heart: Initial Experience. Circ Res. 2016;119(11):1177-1182. doi:10.1161/CIRCRESAHA.116.309769
- Tang S, Bok R, Qin H, et al. A metabolite-specific 3D stack-of-spiral bSSFP sequence for improved lactate imaging in hyperpolarized [1-13C]pyruvate studies on a 3T clinical scanner. Magn Reson Med. 2020;84(3):1113-1125. doi:10.1002/mrm.28204
- Kurhanewicz J, Vigneron DB, Ardenkjaer-Larsen JH, et al. Hyperpolarized 13C MRI: Path to Clinical Translation in Oncology. Neoplasia (United States). 2019;21(1):1-16. doi:10.1016/j.neo.2018.09.006
- Zhu Z, Zhu X, Ohliger MA, et al. Coil combination methods for multi-channel hyperpolarized 13 C imaging data from human studies. J Magn Reson. 2019;301:73-79. doi:10.1016/j.jmr.2019.01.015
- Kim Y, Chen HY, Autry AW, et al. Denoising of hyperpolarized 13C MR images of the human brain using patch-based higher-order singular value decomposition. Magn Reson Med.:Epub ahead of print. doi:10.1002/mrm.28887
- Larson PEZ, Chen HY, Gordon JW, et al. Investigation of analysis methods for hyperpolarized 13C-pyruvate metabolic MRI in prostate cancer patients. NMR Biomed. 2018;31(11):e3997. doi:10.1002/nbm.3997
Figures
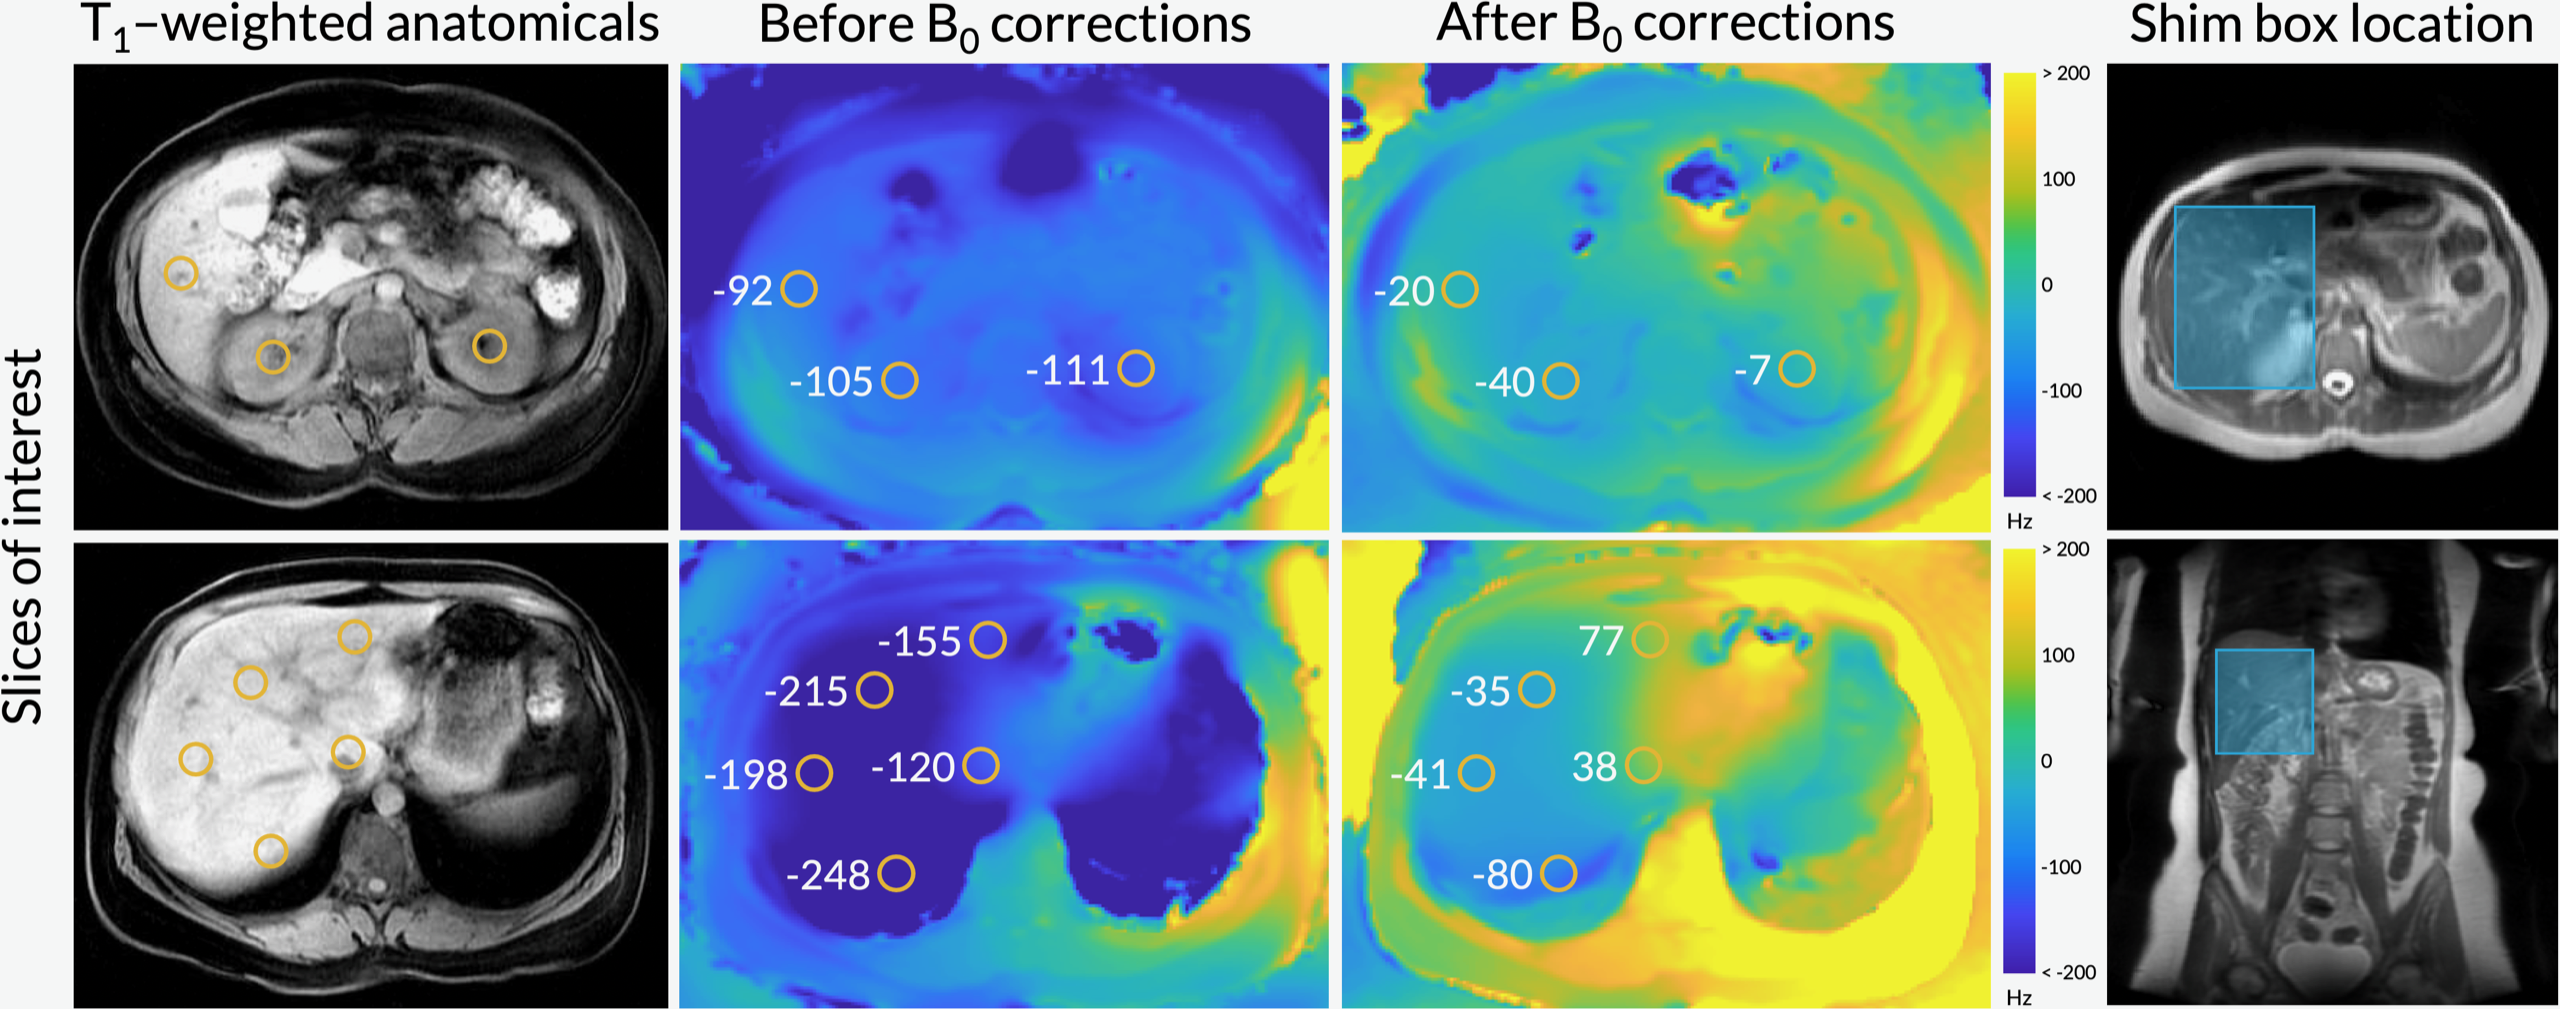
Figure 1. Axial B0 maps (acquired using a volumetric multi-echo Dixon scan) before and after B0 corrections using a localized shim box and further manual tuning. The orange circles indicate B0 field map values (in Hz) for regions of interest, namely the liver and the kidneys.
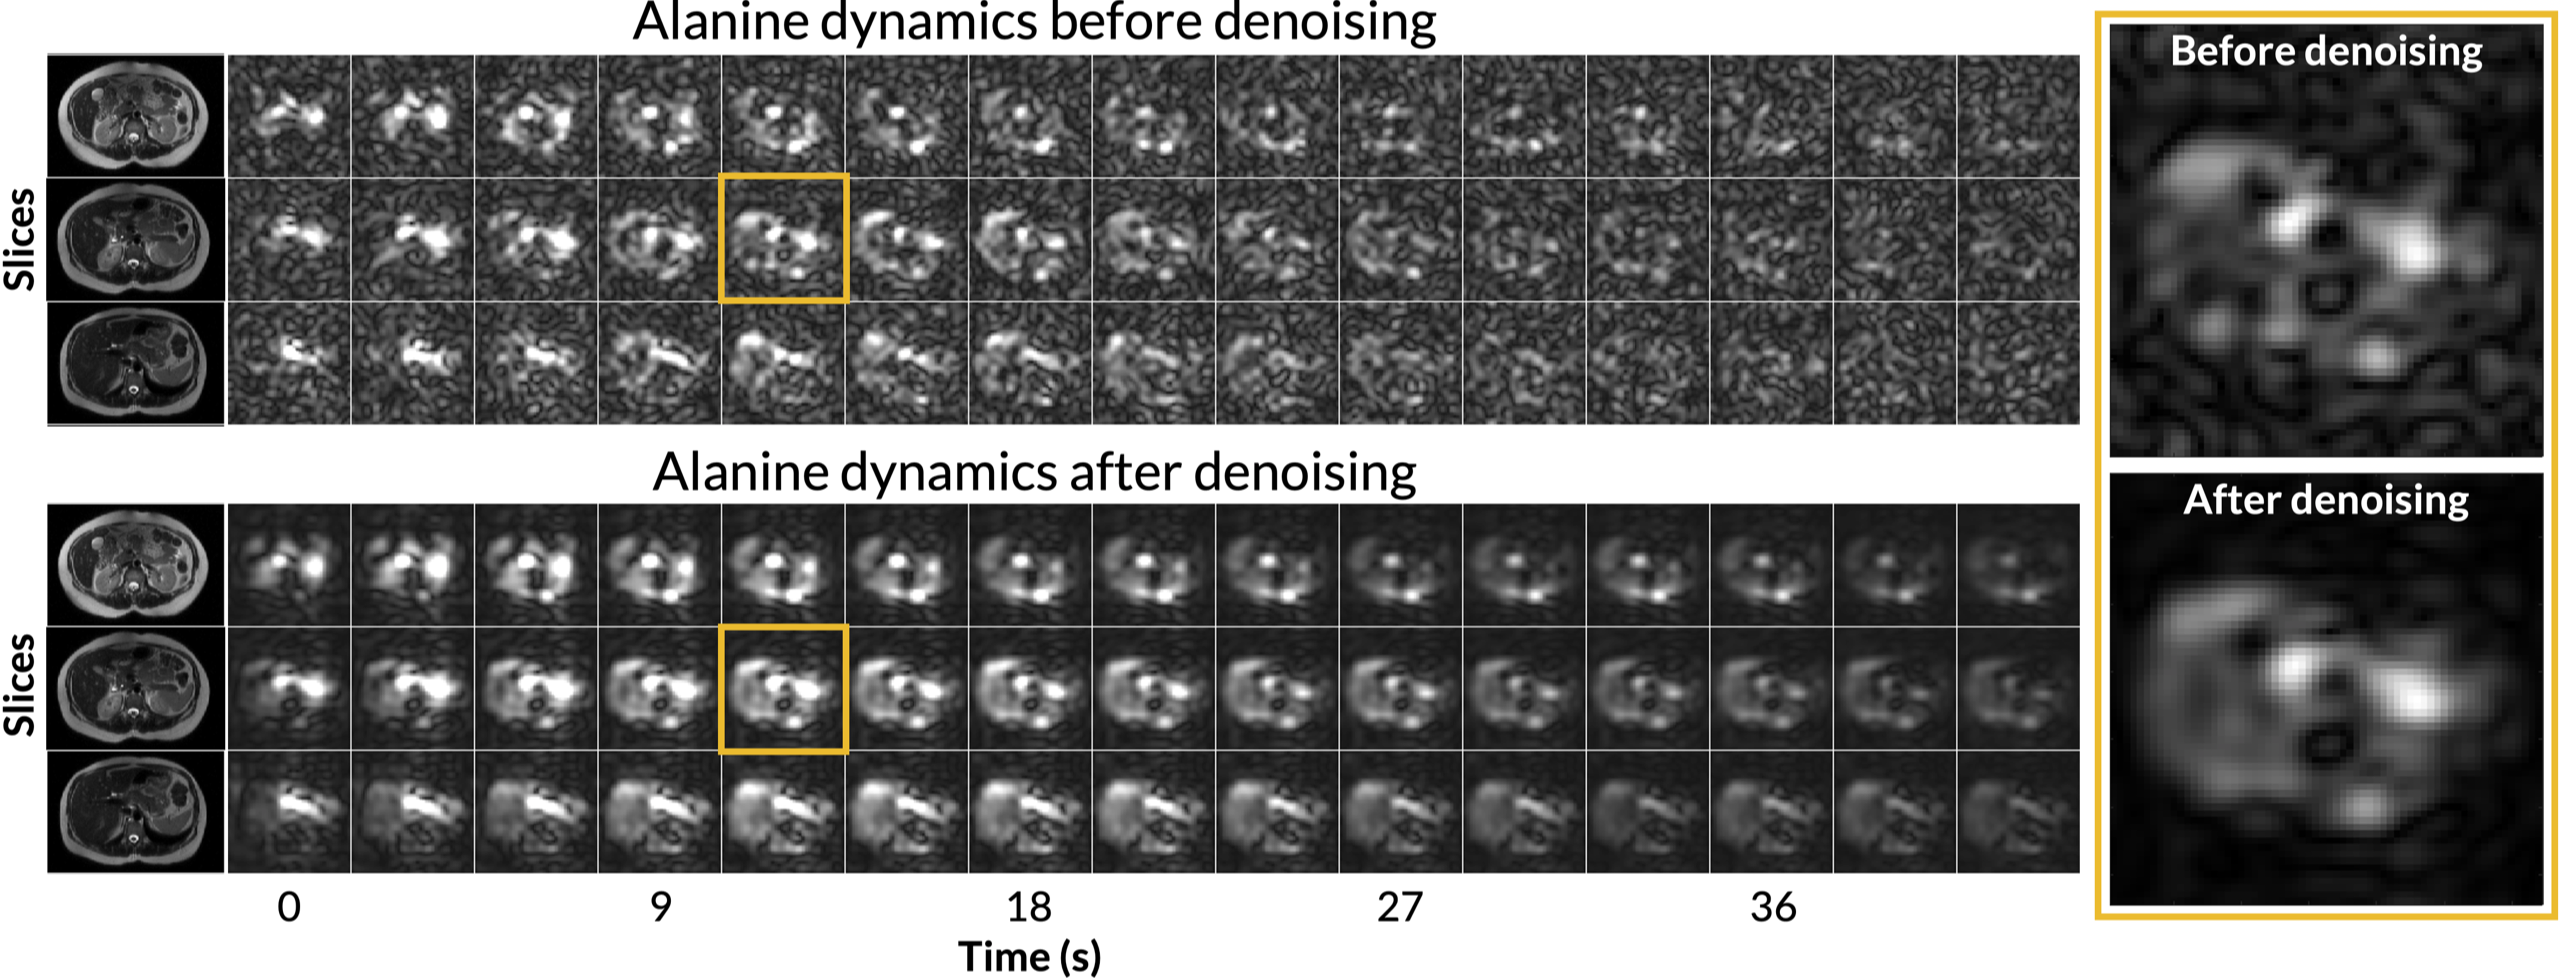
Figure 2. The first 42 seconds of the alanine dynamics before and after patch-based denoising. The fifth timepoint images (time = 12 s) is enlarged on the right side. After denoising, metabolite signals matched organ anatomy, such as the high alanine signal in the pancreas delineating the pancreas’s anatomical structure.
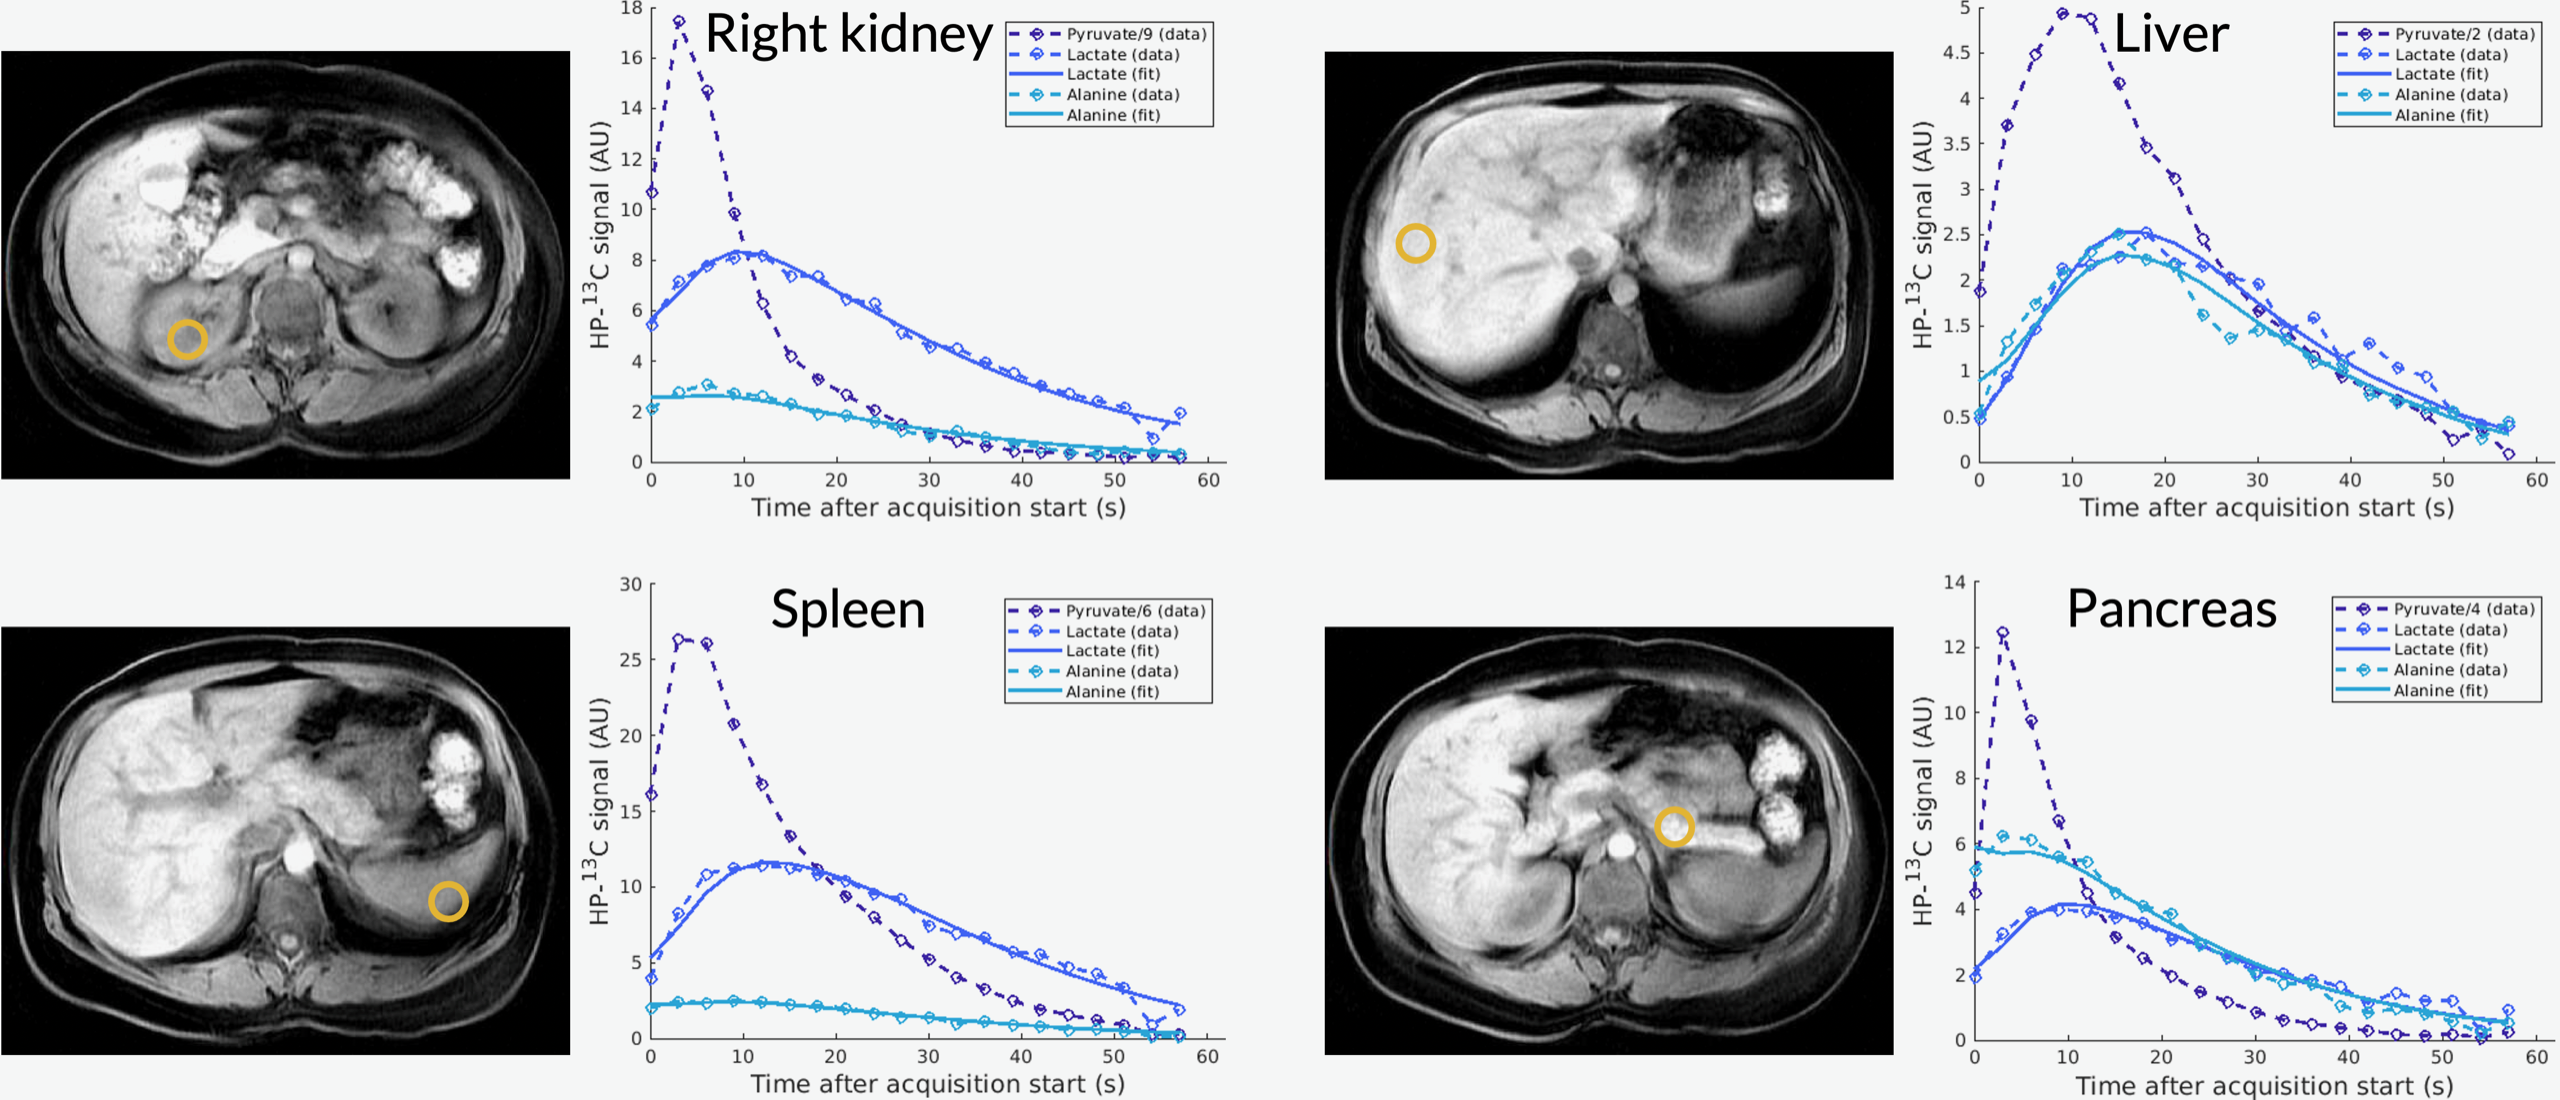
Figure 3. Plots of the dynamic curves for each metabolite in the right kidney, liver, spleen, and pancreas from a representative dataset.
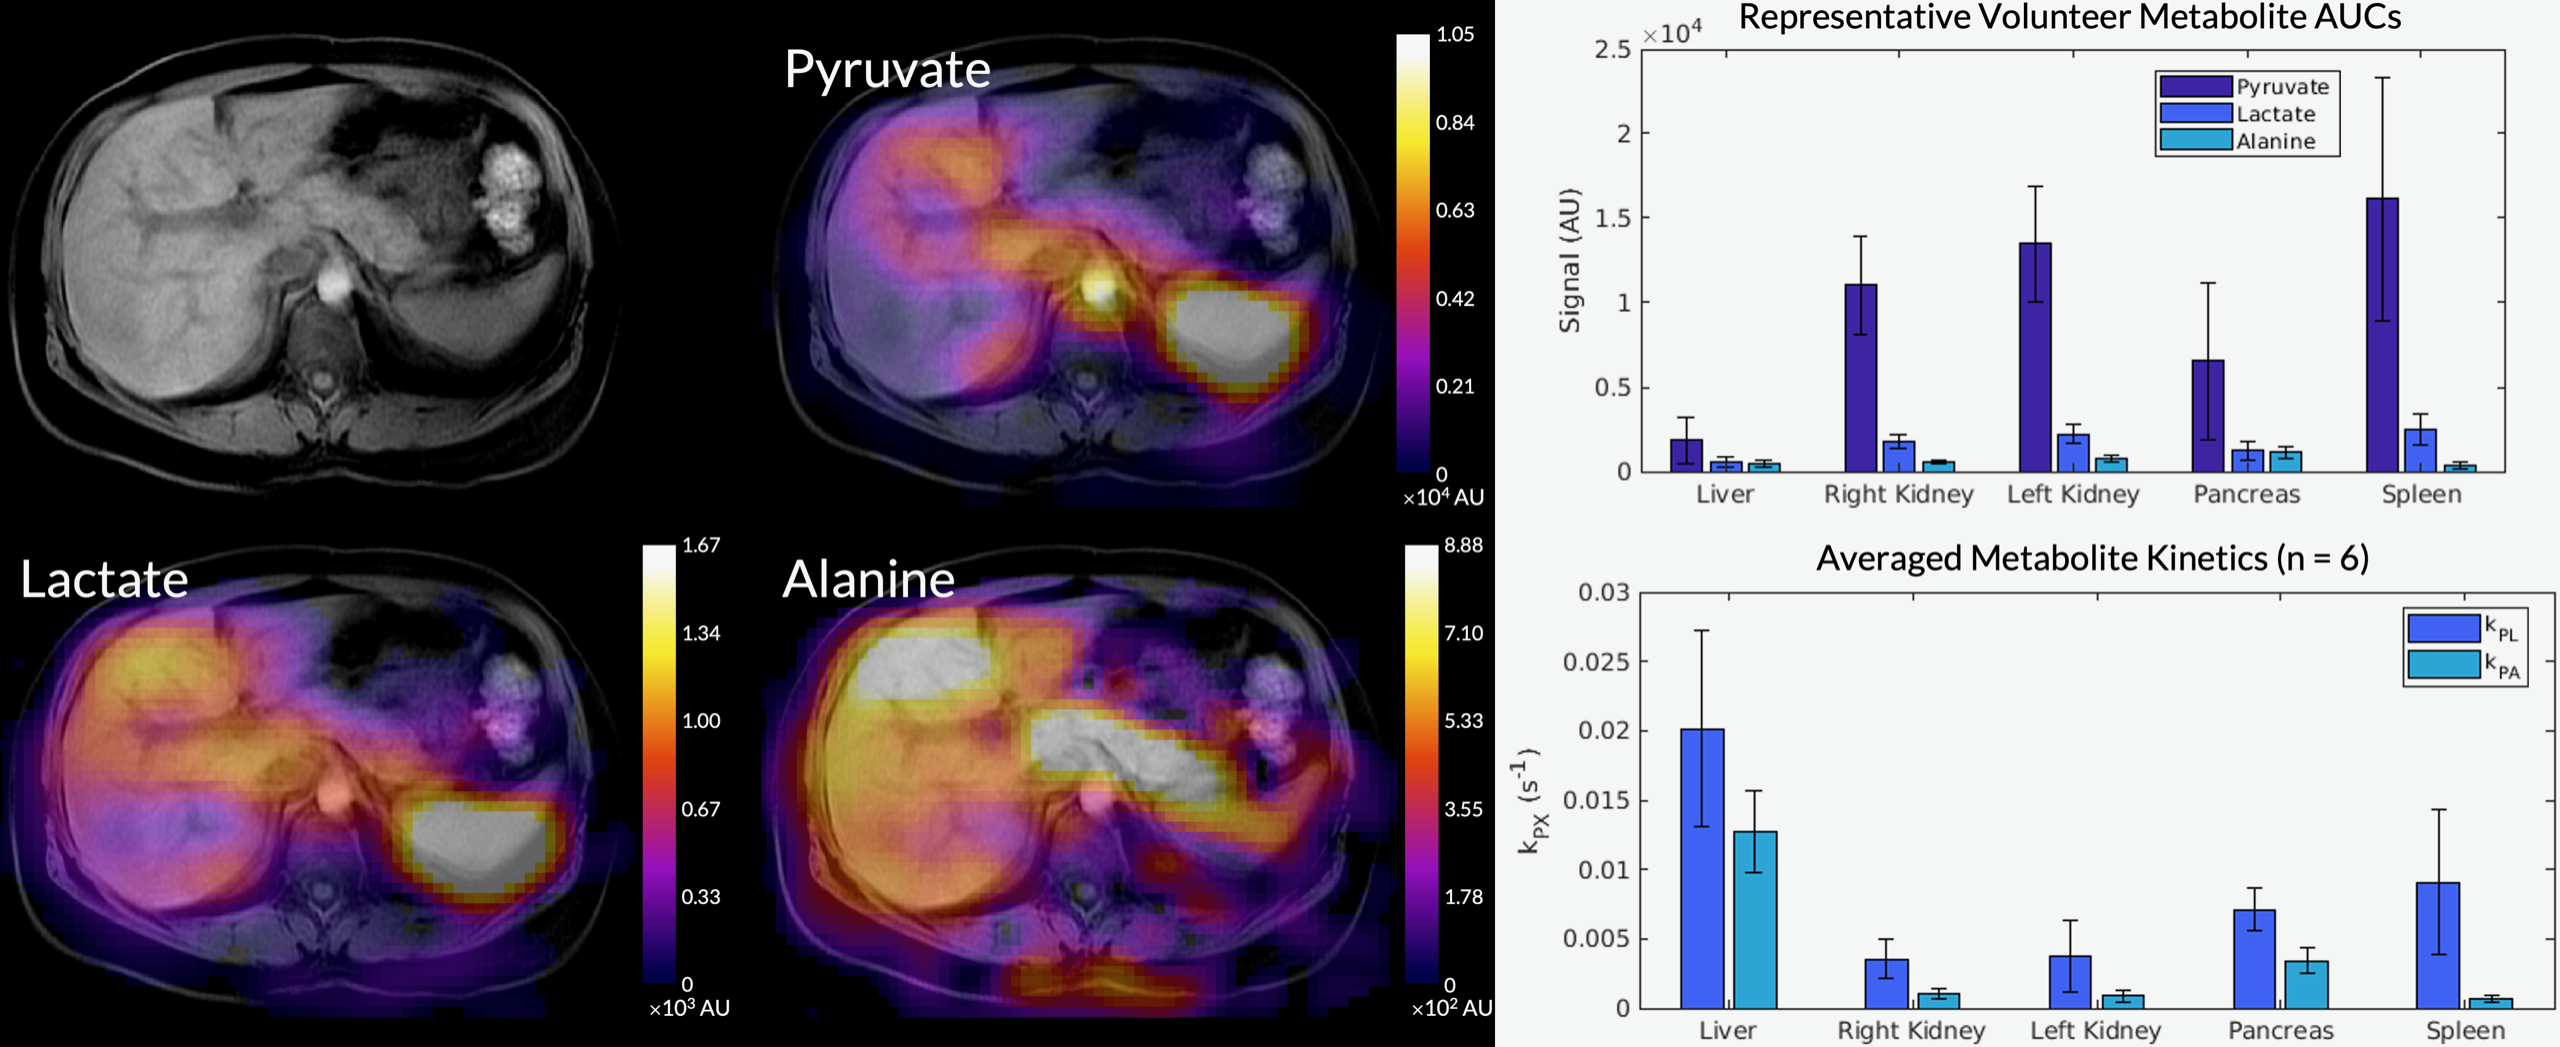
Figure 4. The metabolite AUC maps overlaid on a T1-weighted anatomical image from the same representative dataset. The mean pyruvate, lactate, and alanine signals within each organ for this volunteer are shown in the top bar graph. Below are the averaged kPL and kPA values per organ for all six healthy volunteers.