4018
Change in T2* measurements of placenta during Braxton Hicks contractions1Fetal‐Neonatal Neuroimaging & Developmental Science Center, Boston Children's Hospital, Boston, MA, United States, 2Harvard Medical School, Boston, MA, United States, 3Department of Radiology, Cincinnati Children's Hospital Medical Center, Cincinnati, OH, United States, 4Department of Electrical Engineering and Computer Science, Massachusetts Institute of Technology, Cambridge, MA, United States, 5Harvard-MIT Health Sciences and Technology, Massachusetts Institute of Technology, Cambridge, MA, United States, 6Institute for Medical Engineering and Science, Massachusetts Institute of Technology, Cambridge, MA, United States, 7Computer Science and Artificial Intelligence Laboratory (CSAIL), Massachusetts Institute of Technology, Cambridge, MA, United States, 8Department of Pathology, Massachusetts General Hospital, Boston, MA, United States, 9Maternal-Fetal Medicine, Obstetrics and Gynecology, Massachusetts General Hospital, Boston, MA, United States
Synopsis
Maternal-placental perfusion can be temporarily compromised by Braxton Hicks uterine contractions. The effect of Braxton Hicks contractions on placental function has not been well characterized or understood. In this study, we investigated the effect of Braxton Hicks contractions on placental T2* values across gestation together with the outcome measures. We observed positive correlation between the change in T2* during contraction, gestational age at delivery, and fetal birth weight. Additionally we observed differences in the placental T2* response in the regions closer to the maternal surface compared to regions closer to the fetal surface.
Purpose
Robust placental function is essential for fetal development. Maternal-placental perfusion can be temporarily altered by spontaneous (Braxton Hicks) uterine contractions, which occur throughout pregnancy.1–3 To date, the effects of Braxton Hicks (BH) contractions on placental function have only been extensively studied in animal models.1,5–7 The effect of BH contractions on human pregnancies has not been well characterized. Although no long-term disruption of placental function is expected for normally growing fetuses,4 pregnancies complicated by poor baseline placental function could be further compromised by uterine contractions.3,4 Several prior studies employing T2* maps to investigate the effect of BH contractions reported a decrease in T2* values, but without providing any quantitative evaluations.8,9 In this study, we investigated the effect of BH contractions on placental T2* values across gestation together with gestational age at birth and birth weight.Methods
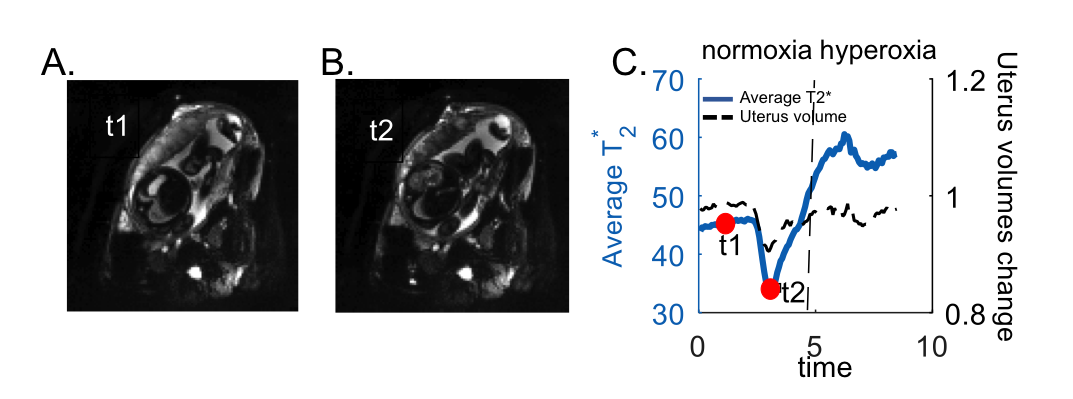
Subjects: 38 subjects, 29 with normal singleton pregnancies and 9 with high-risk for preeclampsia (gestational age (GA):24-38weeks). Acquisition: Scans were performed on a 3T Skyra scanner (Siemens Healthcare, Erlangen, Germany) while subjects were in the left lateral position. We collected T2* time courses (GE EPI, TR=4.2s, no breath-hold, multi-echo TE=18.0, 46.82, 75.64ms, in-plane resolution of 3mm×3mm, slice thickness of 3mm, 70 slices, GRAPPA 2, SMS 2) during an initial normoxic episode (room air, 21% O2, 5min), followed by a hyperoxic episode (100% FiO2, 3min). Processing and analysis: After signal non-uniformities and motion correction,10 we generated T2* maps by fitting a monoexponential decay model to the measured intensities and their corresponding echo times. Voxel-wise deformation was quantified by computing the determinant of the Jacobian of the transformation generated during inter-volume motion correction. The overall uterus volume change was calculated by averaging of the voxel-wise deformations in the uterus over time. Regions of interest (ROIs) for the placenta and the uterus in the reference frame were manually delineated using ITK-SNAP.11 Datasets with simultaneous drops in uterine volume (i.e., more than 4% of the overall uterine volume) and placental BOLD signal were marked as uterine contractions (Figure 1). For the subjects with identified uterine contraction during normoxia episode, average T2* estimates were computed for three different periods (1. normoxia period without BOLD signal drop (T2*normoxia); 2. normoxia period when the deepest BOLD signal drop was observed (T2*contraction); 3. 2 minutes at the end of hyperoxia period (T2*hyperoxia)). The ratio between the average T2* estimates during period 1 and 2 (i.e., T2*contraction/T2*normoxia) was computed. Linear mixed model analysis was used to examine the relation of this ratio to GA at the time of imaging (GAi), GA at the time of delivery (GAd) and fetal birth weight (BW). The impact of uterus volume change was a fixed variable in the model. Additionally, placental ROIs were divided into two sub-ROIs as closer to the fetal and maternal surfaces to investigate the regional differences. We employed the Student t-test to compare T2*hyperoxia/T2*normoxia and T2*contraction/T2*normoxia estimates between these sub-ROIs.Results and Discussion
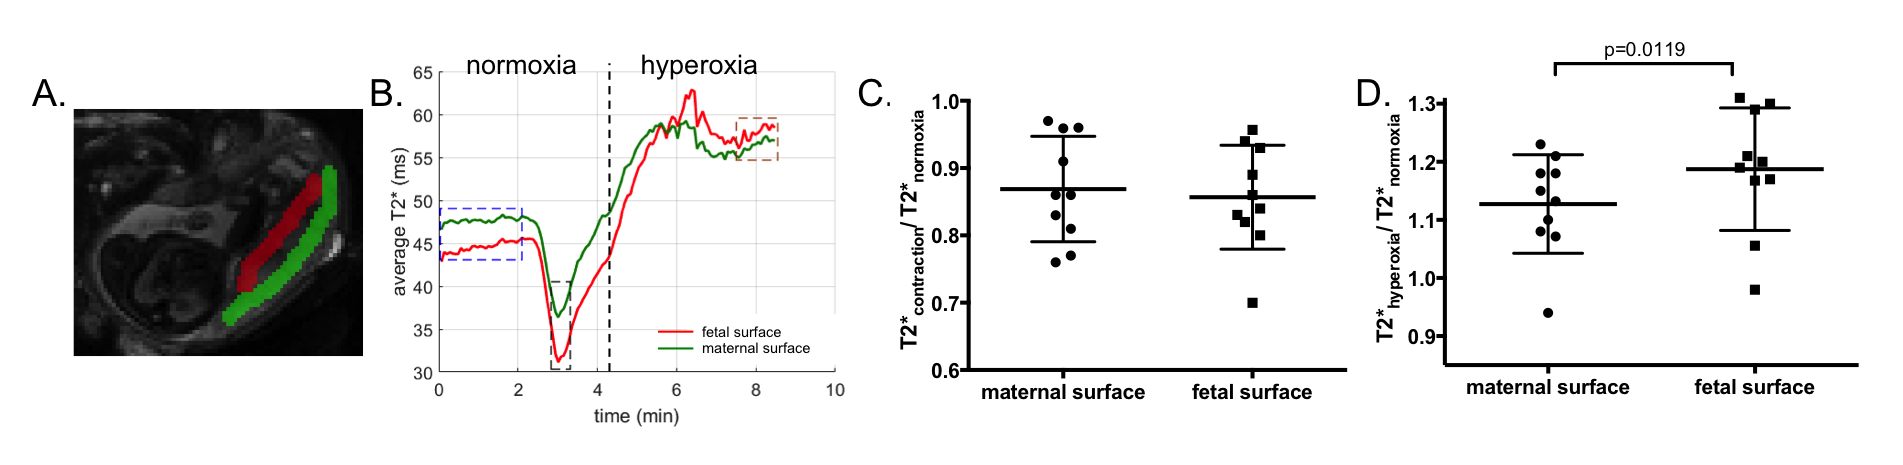
We observed contractions during the normoxia period in 12 out of 38 subjects. We performed the linear mixed model analysis for 9 subjects with the records of GAd and BW. There was no significant correlation between T2*contraction/T2*normoxia and GAi (p=0.67). When GAd and BW were both added to the mixed model, positive correlation was observed between T2*contraction/T2*normoxia and these parameters (p=0.016, and p=0.043, respectively). Adding uterus volume change as a fixed variable improved the correlation between T2*contraction/T2*normoxia and GAd and BW (p=0.008, and p=0.018, respectively) (Table 1). This might be explained as the strength of the contractions (i.e, the drop in placental oxygenation during contraction) increases when the delivery time gets closer. Additionally, placental oxygenation directly affects BW. Figures 2A and 2B demonstrate differences in T2* estimates averaged in regions closer to the fetal compared to the maternal surface. Higher T2* values were estimated for the maternal side during normoxia (p=0.0008), which might be related to higher SO2 levels in intervillous spaces with maternal blood compared to villi with fetal blood.12 When we compared T2*hyperoxia/T2*normoxia, we observed significantly lower values in the maternal side (p=0.0119) which might also be due to the initial higher SO2 levels in maternal blood. (Figure 2D) When we compared T2*contraction/T2*normoxia, we observed slightly but not significantly higher values in the region closer to the maternal surface (p=0.358), which indicates that the region closer to the fetal surface might be more affected by decreases in oxygenation during a contraction. (Figure 2C)Conclusion
We show that BH contractions contribute to placental T2* changes and these changes are correlated with fetal GA at delivery and birth weight. Additionally we observe differences in the placental oxygenation response in regions closer to the maternal surface compared to regions closer to the fetal surface.Acknowledgements
This work was supported by NIH R01HD100009, U01HD087211, R01EB017337, P41EB015902.References
1. Ramsey, E. M., Corner, G. W., Jr & Donner, M. W. Serial and cineradioangiographic visualization of maternal circulation in the primate (hemochorial) placenta. Am. J. Obstet. Gynecol. 86, 213–225 (1963).
2. Oosterhof, H., Dijkstra, K. & Aarnoudse, J. G. Uteroplacental Doppler velocimetry during Braxton Hicks’ contractions. Gynecol. Obstet. Invest. 34, 155–158 (1992).
3. Bower, S., Campbell, S., Vyas, S. & McGirr, C. Braxton-Hicks contractions can alter uteroplacental perfusion. Ultrasound Obstet. Gynecol. 1, 46–49 (1991).
4. Olofsson, P., Thuring-Jönsson, A. & Marsál, K. Uterine and umbilical circulation during the oxytocin challenge test. Ultrasound Obstet. Gynecol. 8, 247–251 (1996).
5. Brace, R. A. & Brittingham, D. S. Fetal vascular pressure and heart rate responses to nonlabor uterine contractions. Am. J. Physiol. 251, R409–16 (1986).
6. Llanos, A. J., Block, B. S., Court, D. J., Germain, A. M. & Parer, J. T. Fetal oxygen uptake during uterine contractures. J. Dev. Physiol. 10, 525–529 (1988).
7. Shields, L. E. & Brace, R. A. Fetal vascular pressure responses to nonlabor uterine contractions: dependence on amniotic fluid volume in the ovine fetus. Am. J. Obstet. Gynecol. 171, 84–89 (1994).
8. Sinding, M. et al. Reduced placental oxygenation during subclinical uterine contractions as assessed by BOLD MRI. Placenta 39, 16–20 (2016).
9. Abaci Turk, E. et al. Placental MRI: Effect of maternal position and uterine contractions on placental BOLD MRI measurements. Placenta 95, 69–77 (2020).
10. Abaci Turk, E. et al. Individual variation in simulated fetal SAR assessed in multiple body models. Magn. Reson. Med. 83, 1418–1428 (2020).
11. Yushkevich, P. A. et al. User-guided 3D active contour segmentation of anatomical structures: significantly improved efficiency and reliability. Neuroimage 31, 1116–1128 (2006).
12. Meschia, G. Placental respiratory gas exchange and fetal oxygenation. Creasy RK, Resnik R, Iams JD, et al 181–191 (1994).
Figures