4016
A Propensity Score Matched Analysis of Quantitative Background Parenchymal Enhancement on MRI for Improved Breast Cancer Risk Stratification
Ran Yan1,2, Wakana Murakami1, Shabnam Mortazavi1, Tiffany Yu1, Stephanie Lee-Felker1, and Kyunghyun Sung1,3
1Department of Radiological Sciences, David Geffen School of Medicine, University of California, Los Angeles, Los Angeles, CA, United States, 2Department of Bioengineering, University of California, Los Angeles, Los Angeles, CA, United States, 3Physics and Biology in Medicine IDP, David Geffen School of Medicine, University of California, Los Angeles, Los Angeles, CA, United States
1Department of Radiological Sciences, David Geffen School of Medicine, University of California, Los Angeles, Los Angeles, CA, United States, 2Department of Bioengineering, University of California, Los Angeles, Los Angeles, CA, United States, 3Physics and Biology in Medicine IDP, David Geffen School of Medicine, University of California, Los Angeles, Los Angeles, CA, United States
Synopsis
High background parenchymal enhancement (BPE) on breast MRI is related to increased breast cancer risk. In this study, we investigate possible differences in BPE among different breast cancer risk groups stratified based on BRCA 1/2 mutation status and lifetime risks. We use propensity score matching to adjust for potential confounders. We performed a quantitative BPE analysis on the 3D volume of the breast and fibroglandular tissue based on the enhancement maps and principal component analysis. The results showed a significant difference in BPE among different risk groups, indicating that BPE may improve breast cancer risk stratification.
Introduction
Background parenchymal enhancement (BPE) is defined as the normal uptake of contrast in fibroglandular tissue (FGT) in breast dynamic contrast-enhanced (DCE)-MRI1. High BPE has been recognized as a breast cancer risk factor in high-risk women2,3. However, the inter-reader variability in radiologist-assigned BPE categories suggests that quantitative analysis of BPE might be helpful, especially if BPE merits integration into existing risk prediction models in the future. Here, we aim to investigate the association between risk stratification and BPE using quantitative assessment, which we hypothesize, is a more reliable and comparable method when compared to qualitative evaluation. The breast cancer risk was stratified into groups with and without BRCA mutation and different lifetime risks using Tyrer-Cuzick model, and both menopausal and hormonal status have been matched between risk groups for the analysis of quantitative BPE.Methods
After institutional review board approval, a Health Insurance Portability and Accountability Act-compliant retrospective study of 661 subjects without a history of breast cancer who underwent a bilateral breast screening MRI between 2017 and 2019 was included in the study. All premenopausal women underwent MRI screening ideally during the second week of the menstrual cycle, as studies have shown that the least amount of BPE is seen in this time period4. Cases that image quality or other factors had a considerable impact on BPE quantification were excluded (Figure 1). The study cohort was then stratified into three groups based on breast cancer risk: (1) subjects with BRCA 1 or 2 mutation, (2) subjects without known high-risk germline mutation with 20% or more lifetime risk using Tyrer-Cuzick model, and (3) subjects with “average-risk” having lifetime risk less than 20%. After propensity score matching (PSM) using covariates including age, ethnicity, menopause status, and hormonal treatment history, 60 subjects in each group were selected.Figure 2 shows an overview of the BPE quantification process. For each subject, the breast and FGT three-dimensional volume segmentation using the fuzzy c-means clustering method was performed on T1-weighted non-fat-suppressed (T1-NFS) images after the bias field correction. After rigid image registration, the segmented masks were then transferred to the pre- and post-contrast T1-weighted fat-suppressed (T1-FS) series. The segmentation task was initially performed by a student researcher, and the results were confirmed and corrected by two breast radiologists. Voxel-wise percent enhancement (PE) map, which represented wash-in enhancement characteristics, and signal enhancement ratio (SER) map, which represented delayed enhancement characteristics, were measured as follows: PE% = (Iearly-Ipre)/Ipre×100, where Ipre is pre-contrast image intensity, and Iearly is 95-second early-phase post-contrast image intensity. SER% = (Iearly-Ipre)/(Idelayed-Ipre)×100, where Idelayed is 380-second delayed-phase post-contrast image intensity. From PE map and SER map, percentage-based FGT-wise and breast-wise BPE measures were computed as follows: PEFGT% = |PE|/|FGT| ×100, PEBreast% = |PE|/|Breast| ×100, SERFGT%= |SER|/|FGT| ×100, and SERBreast%= |SER|/|Breast| ×100, where |PE| and |SER| were summarized as the total volume of enhancing voxels within FGT whose enhancement ratios (PE% and SER%) ≥ Rcutoff of 30% referring to a previous study5, and |FGT| and |Breast| were computed as the total volume of FGT and the breast, respectively. We also measured the initial enhancement ratio (IER) and delayed enhancement ratio (DER) of the BPE based on the 3D volume of FGT with the principal component analysis (PCA) method used in earlier studies4,6. Corresponding to the data distribution, a two-sided Mann-Whitney U-test was used at a significance level of 0.05 to compare the BPE measures of each group of subjects.
Results
The clinical and radiographic characteristics of study subjects are summarized in Table 1. After PSM, age, ethnicity, menopause status, and hormonal treatment history were not significantly different in the pairwise comparison of the three groups of subjects. Comparisons of quantitative BPE measures are shown in Table 2. Non-mutation carriers with lifetime risk ≥ 20% demonstrated significantly higher BPE than the other groups in terms of PEBreast% and SERBreast% (BRCA group: P = 0.006, P = 0.007, respectively; average-risk: P = 0.018, P = 0.031, respectively; see Table 2 for details). Figure 3 provides a detailed illustration of data distribution of significantly different BPE. The BRCA group also showed significantly lower IER% and DER% than non-mutation carriers with lifetime risk ≥ 20% (P =0.041, P =0.039, respectively).Discussion and Conclusion
Our study demonstrated a difference in quantitative BPE among different breast cancer risk groups, stratified by subjects with and without BRCA mutation and varying lifetime risks. Specifically, BPE was significantly higher in non-mutation carriers with higher lifetime risk than other groups (P<0.05). The results are consistent with previous studies, which found that BRCA mutation carriers had lower BPE than non-carriers6,7. In our study, we also stratified non-mutation carriers into two groups based on lifetime risk, and the results showed that subjects at higher lifetime risk had higher levels of BPE. One other major difference in our study is that since BPE levels are affected by sex hormones and other factors8,9, we adjusted for potential confounding factors and balanced each group using the PSM method. Our study suggests that BPE level may be important in investigating critical differences among different breast cancer risk groups. These findings imply that BPE might be used as a biomarker to improve risk stratification for breast cancer.Acknowledgements
No acknowledgement found.References
1. Liao GJ, Henze Bancroft LC, Strigel RM, et al. Background parenchymal enhancement on breast MRI: A comprehensive review. J Magn Reson Imaging. 2020;51(1):43-61. doi:10.1002/jmri.267622. Dontchos BN, Rahbar H, Partridge SC, et al. Are qualitative assessments of background parenchymal enhancement, amount of fibroglandular tissue on MR images, and mammographic density associated with breast cancer risk? Radiology. 2015;276(2):371-380. doi:10.1148/radiol.2015142304
3. Grimm LJ, Saha A, Ghate S V., et al. Relationship between Background Parenchymal Enhancement on High-risk Screening MRI and Future Breast Cancer Risk. Acad Radiol. 2019;26(1):69-75. doi:10.1016/j.acra.2018.03.013
4. Amarosa AR, McKellop J, Leite APK, et al. Evaluation of the kinetic properties of background parenchymal enhancement throughout the phases of the menstrual cycle. Radiology. 2013;268(2):356-365. doi:10.1148/radiol.13121101
5. Wu S, Weinstein SP, DeLeo MJ, et al. Quantitative assessment of background parenchymal enhancement in breast MRI predicts response to risk-reducing salpingo-oophorectomy: Preliminary evaluation in a cohort of BRCA1/2 mutation carriers. Breast Cancer Res. 2015;17(1). doi:10.1186/s13058-015-0577-0
6. Lewin AA, Gene Kim S, Babb JS, et al. Assessment of Background Parenchymal Enhancement and Lesion Kinetics in Breast MRI of BRCA 1/2 Mutation Carriers Compared to Matched Controls Using Quantitative Kinetic Analysis. Acad Radiol. 2016;23(3):358-367. doi:10.1016/j.acra.2015.11.011
7. Grubstein A, Rapson Y, Benzaquen O, et al. Comparison of background parenchymal enhancement and fibroglandular density at breast magnetic resonance imaging between BRCA gene mutation carriers and non-carriers. Clin Imaging. 2018;51(June):347-351. doi:10.1016/j.clinimag.2018.06.010
8. King V, Gu Y, Kaplan JB, Brooks JD, Pike MC, Morris EA. Impact of menopausal status on background parenchymal enhancement and fibroglandular tissue on breast MRI. Eur Radiol. 2012;22(12):2641-2647. doi:10.1007/S00330-012-2553-8
9. Brooks JD, Sung JS, Pike MC, et al. MRI background parenchymal enhancement, breast density and serum hormones in postmenopausal women. Int J Cancer. 2018;143(4):823. doi:10.1002/IJC.31370
Figures
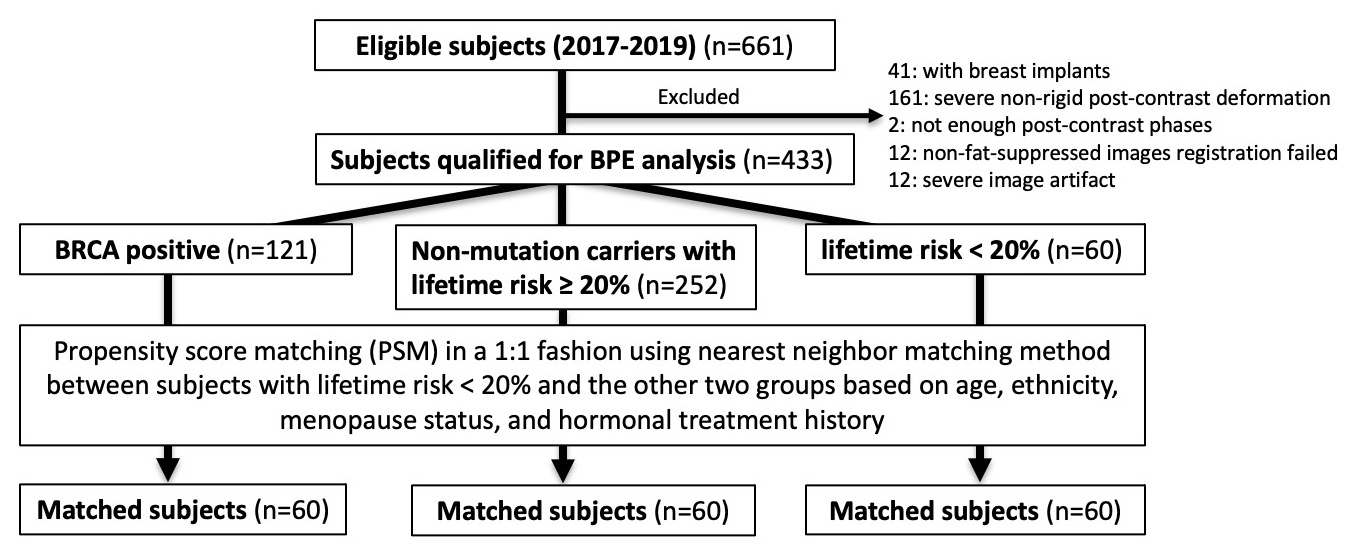
Figure 1. Flow chart of study sample selection.
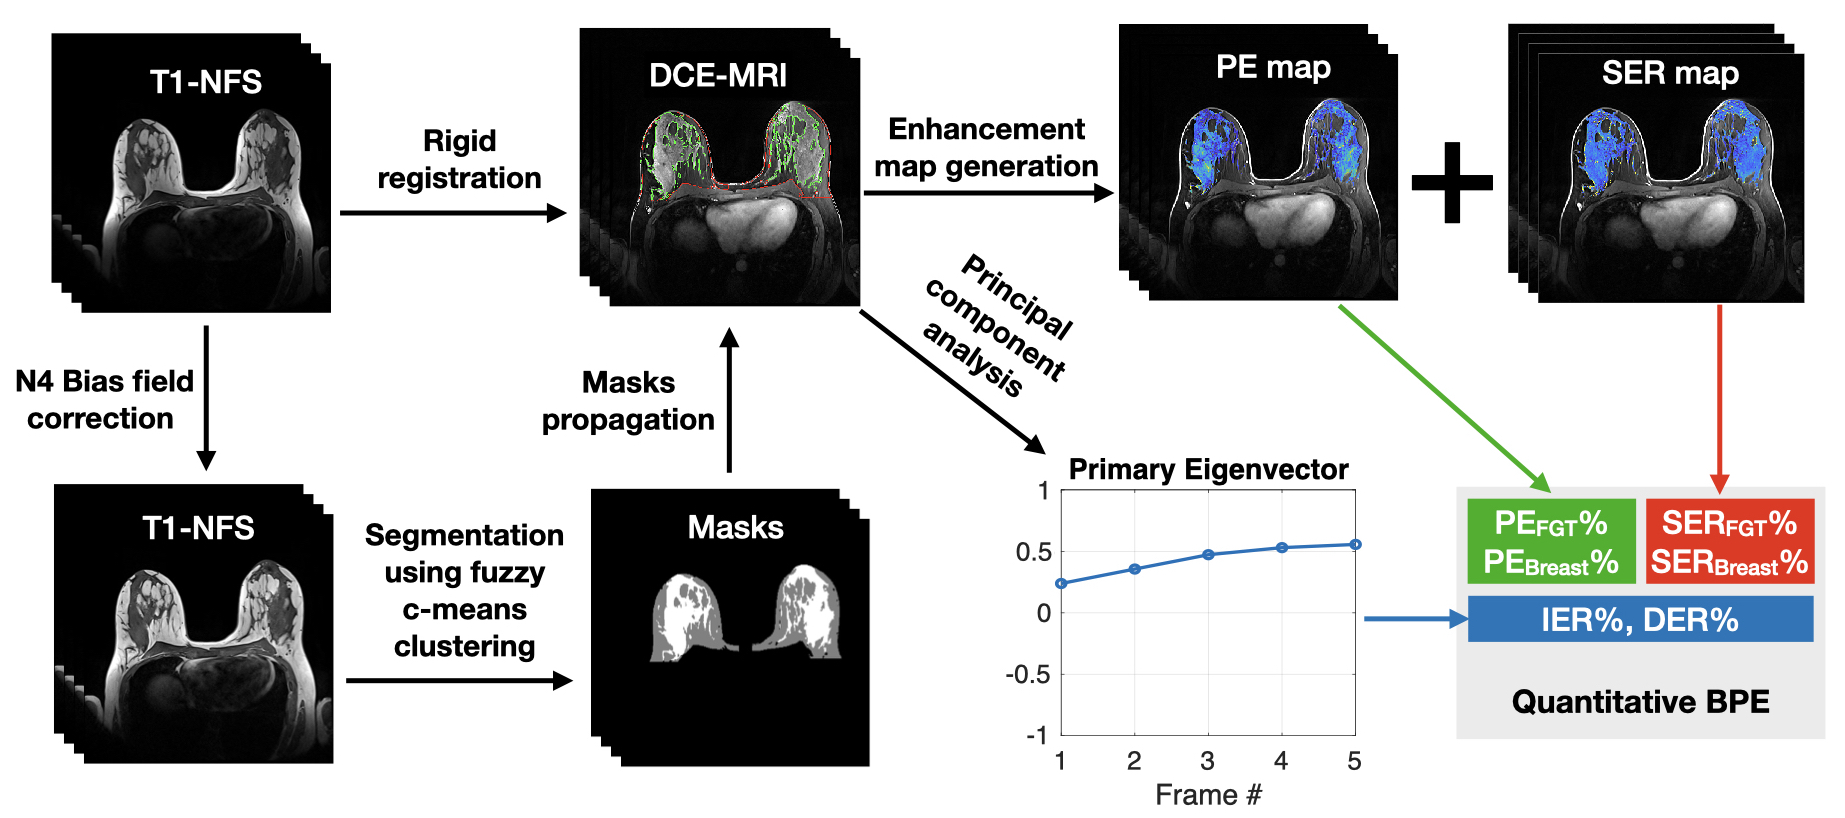
Figure 2. Overview of BPE quantification process. The 3D volumes of breast and FGT were segmented using the fuzzy c-means clustering method on T1-NFS images after N4 bias-field correction. The segmented 3D masks were propagated to the DCE-MRI after rigid registration. Enhancement maps, including PE and SER maps, were generated based on the masks, from which PEFGT%, PEBreast%, SERFGT%, and SERBreast% were derived. The primary eigenvector derived from principal component analysis of DCE-MRI was used to calculate another two BPE measures, i.e., IER% and DER%.
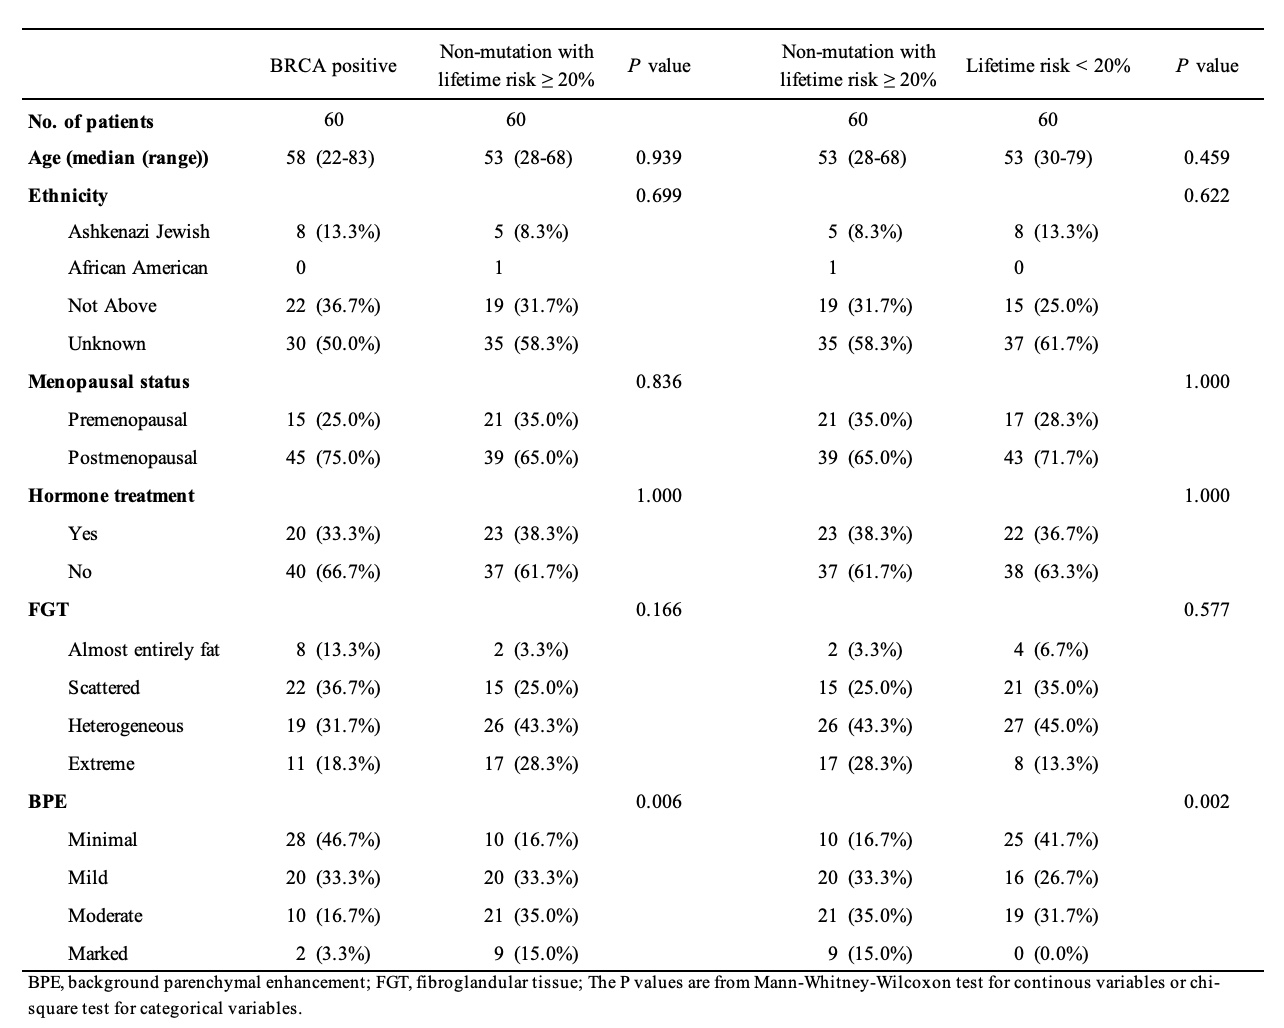
Table 1. Characteristics of study subjects after propensity score matching.
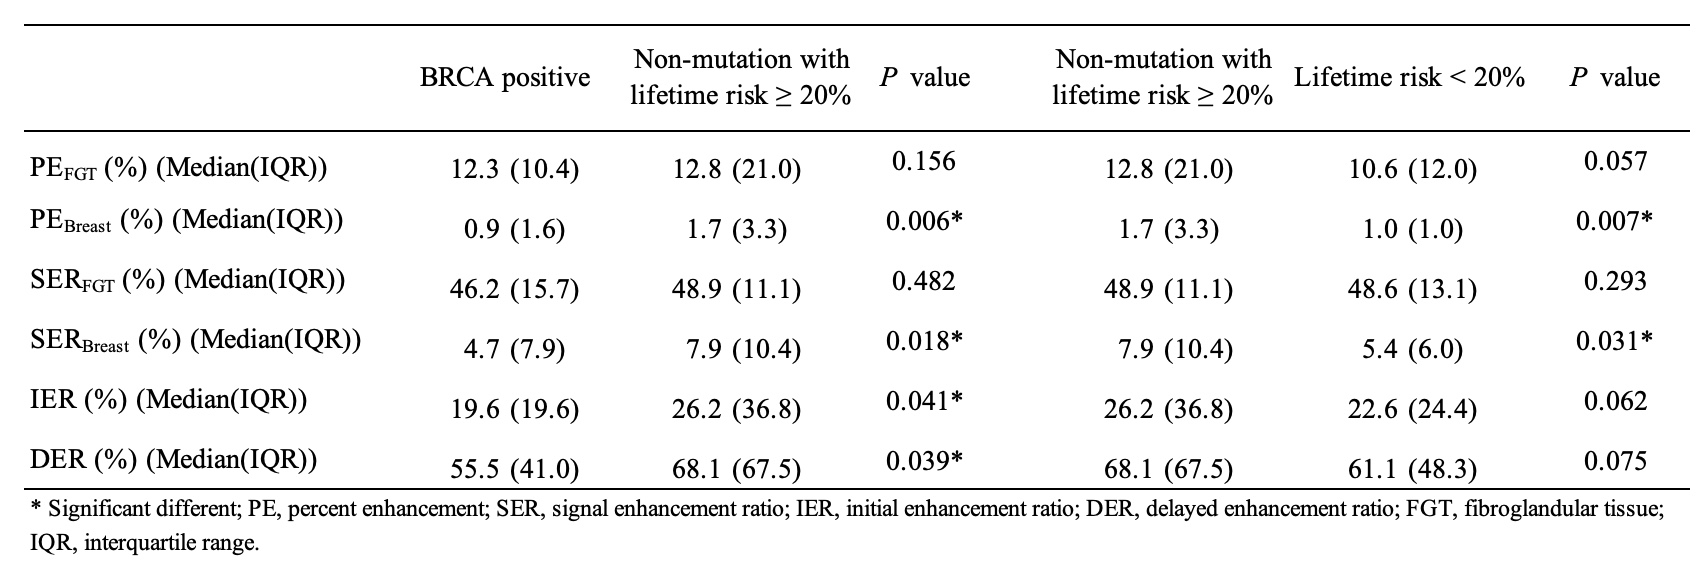
Table 2. BPE comparison using Mann–Whitney U-test.
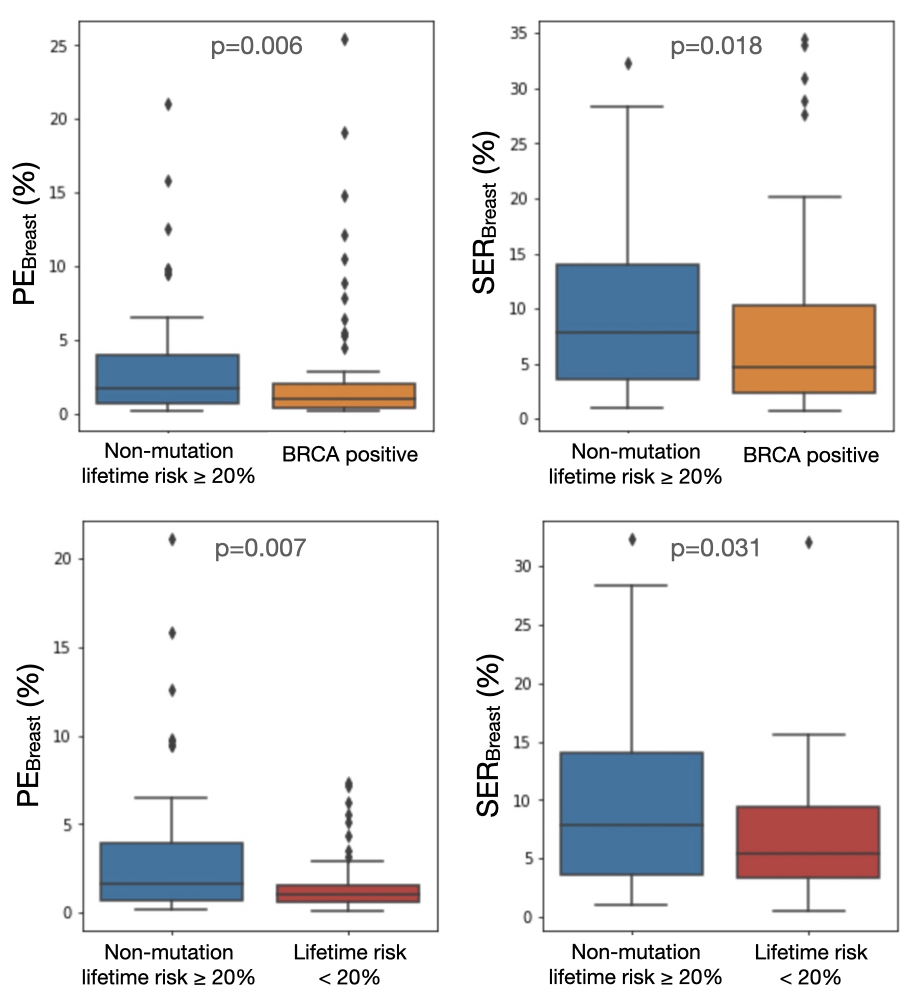
Figure 3. Boxplots of representative quantitative BPE comparison with significant differences (P<0.05) using Mann-Whitney U-test. PEBreast% and SERBreast% of the non-mutation group with lifetime risk ≥ 20% were significantly higher than the BRCA mutation group and non-mutation group with lifetime risk < 20%. PE, percent enhancement; SER, signal enhancement ratio.
DOI: https://doi.org/10.58530/2022/4016