4014
Integrated DWI for Pre-treatment Prediction of Response to Neoadjuvant Chemotherapy in Breast Cancer1Center for MR Research, University of Illinois at Chicago, Chicago, IL, United States, 2Department of Bioengineering, University of Illinois at Chicago, Chicago, IL, United States, 3Department of Radiology, Cancer Hospital, Chinese Academy of Medical Sciences, Beijing, China, 4Departments of Radiology and Neurosurgery, University of Illinois at Chicago, Chicago, IL, United States
Synopsis
Neoadjuvant chemotherapy (NAC) has been shown to improve the outcome in patients with locally advanced inoperable or operable breast cancer. An early imaging assessment of response to NAC is critical for managing breast cancer to minimize the toxic side effects of ineffective chemotherapy. In this study, we have used an integrated diffusion-weighted imaging approach for simultaneous assessment of tissue cellularity, vascularity, and heterogeneity – DISMANTLE – from a full b-value spectrum to predict breast cancer’s response to NAC. Histogram features of pre-treatment DISMANTLE parameters were evaluated for predicting tumor response to NAC in terms of pathological complete response.
Introduction
Neoadjuvant chemotherapy (NAC) has become the standard of care for locally advanced breast cancer as favorable response to NAC correlates to improved disease-free survival. However, variable tumor responses have been shown in patients receiving NAC with the rate of achievement of pathological complete response (pCR) is as low as 30%1. Thus, an early clinical marker of pCR can guide treatment decisions to avoid potentially ineffective chemotherapy. Factors related to physiology, tissue structure, and microenvironment can have a profound influence on breast tumor’s sensitivity to treatment2. Multiple microstructural tissue characteristics, such as cellularity, vascularity, and heterogeneity, can contribute to tumor characterization. Recent publications indicated that these tissue properties can be investigated using specific b-value ranges of diffusion-weighted signal attenuation3,4. Diffusion-weighted imaging (DWI) with apparent diffusion coefficient has become a pillar of clinical MRI for probing tissue callularity5,6. On the other hand, intravoxel incoherent motion (IVIM) model7 with low-b-values can characterize micro-vascularity while high-b-value non-Gaussian models can probe microstructures as in the case with continuous-time random walk (CTRW) model8,9 which can reflect microstructural heterogeneity. In this study, we use an integrated DWI approach for simultaneous assessment of tissue cellularity, vascularity, and heterogeneity (DISMANTLE) based on IVIM and CTRW diffusion models to predict breast cancer’s response to NAC in terms of pCR. We investigate whether the histogram features of DISMANTLE parameters can be used as markers for response to NAC prior to any treatment.Methods
Patients: 26 histologically confirmed breast cancer patients with scheduled NAC were recruited. Patients with Miller-Payne grade 4 or 5 were categorized as having a pathologic complete response (pCR, n=10), and with grades 1-3 as not having a pCR (npCR, n=16).Image Acquisition: All patients were scanned on a General Electric MR750 3T scanner before receiving NAC. The DWI was performed with 12 b-values (0 to 3000s/mm2) and the following imaging parameters: TR/TE=3500/80ms, slice thickness=5.5mm, FOV=34cm×34cm, and matrix=256×256.
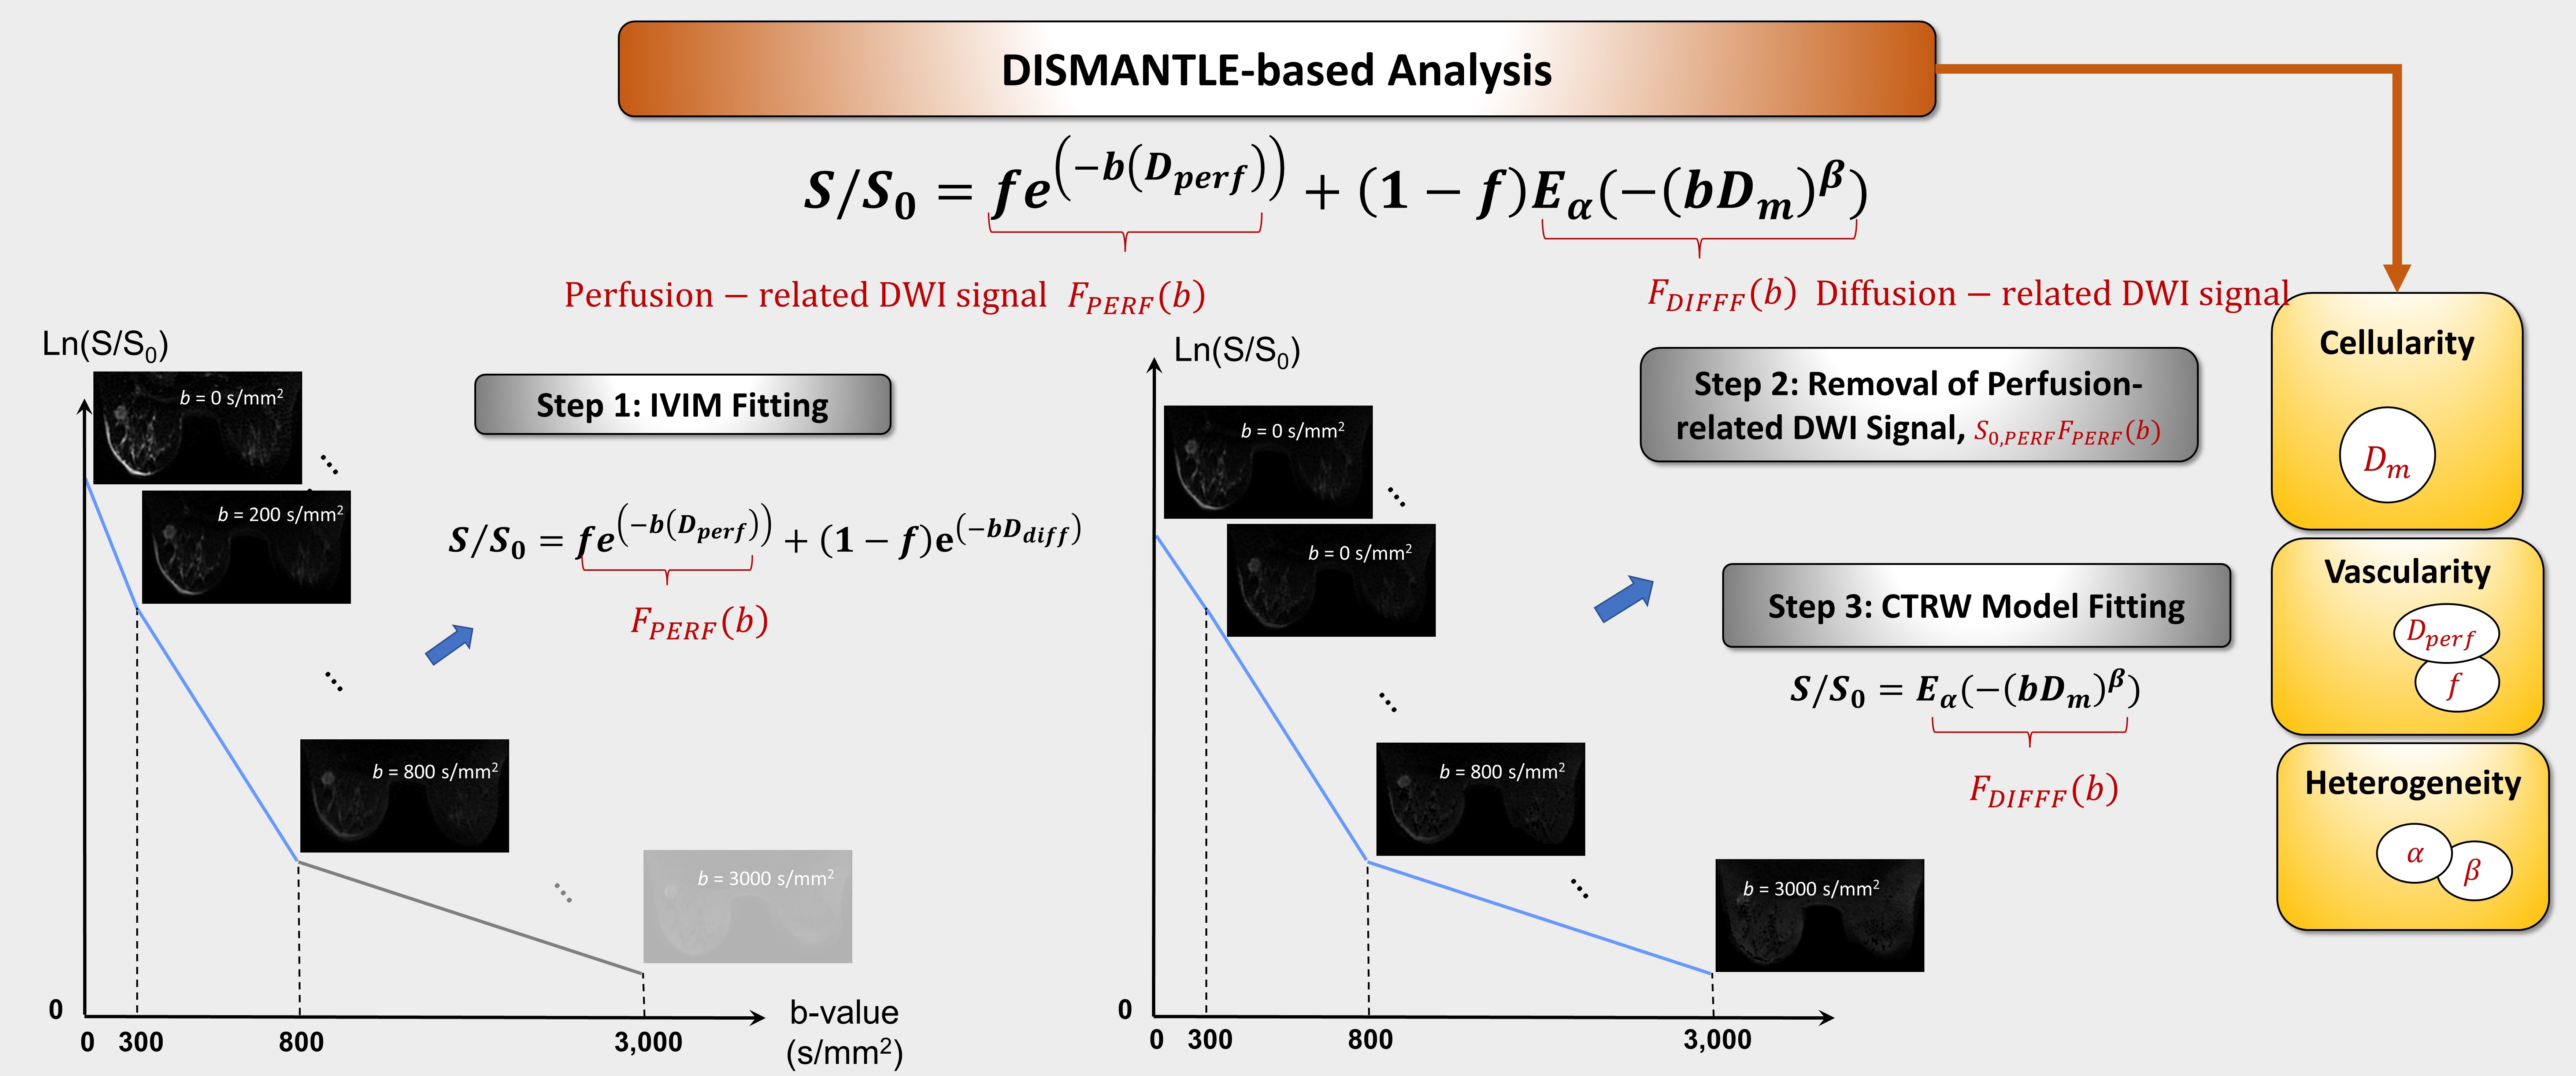
DWI Analysis: The diffusion-weighted images were analyzed using an integrated approach, which we call DISMANTLE10. It characterizes the diffusion-weighted signal attenuation based on IVIM11,12 and CTRW9 models, respectively, as follows
$$S/S_0=fe^{(-bD_{perf} )}+(1-f) E_α (-(bD_m )^β), (1)$$
where Eα is a Mittag-Leffler function. DISMANTLE in Eq.(1) produces three sets of parameters with a unified formulism: vascularity-related (IVIM’s perfusion fraction, f and pseudo-diffusion coefficient, Dperf), cellularity-related (CTRW’s diffusion coefficient, Dm), and heterogeneity-related (CTRW’s temporal and spatial diffusion heterogeneity, α and β) parameters. DISMANTLE was implemented through a multi-step approach by first analyzing the images in the low-b-value range (0-800 s/mm2) with an IVIM model12 using segmented fitting13, then removing the perfusion-related signal from the diffusion-weighted signal, and finally analyzing the remaining diffusion-related signal component over the entire-b-value range (0-3000 s/mm2) with a CTRW model9 as illustrated in Fig. 1.
Histogram-based Statistical Analysis: Nine histogram features were generated from each DISMANTLE parameter over tumor ROIs: mean, median, minimum, maximum, variance, kurtosis, skewness, first quartile, and third quartile. The DISMANTLE-based histogram features were compared for significant differences between pCR and npCR patients by using a Mann-Whitney U test. The predictive value of DISMANTLE features was analyzed by a receiver operating characteristic (ROC) analysis. The ROC analysis was performed with the use of the features that yielded statistically significant differences among the pCR and npCR groups both individually and collectively with a multivariate logistic regression algorithm.
Results
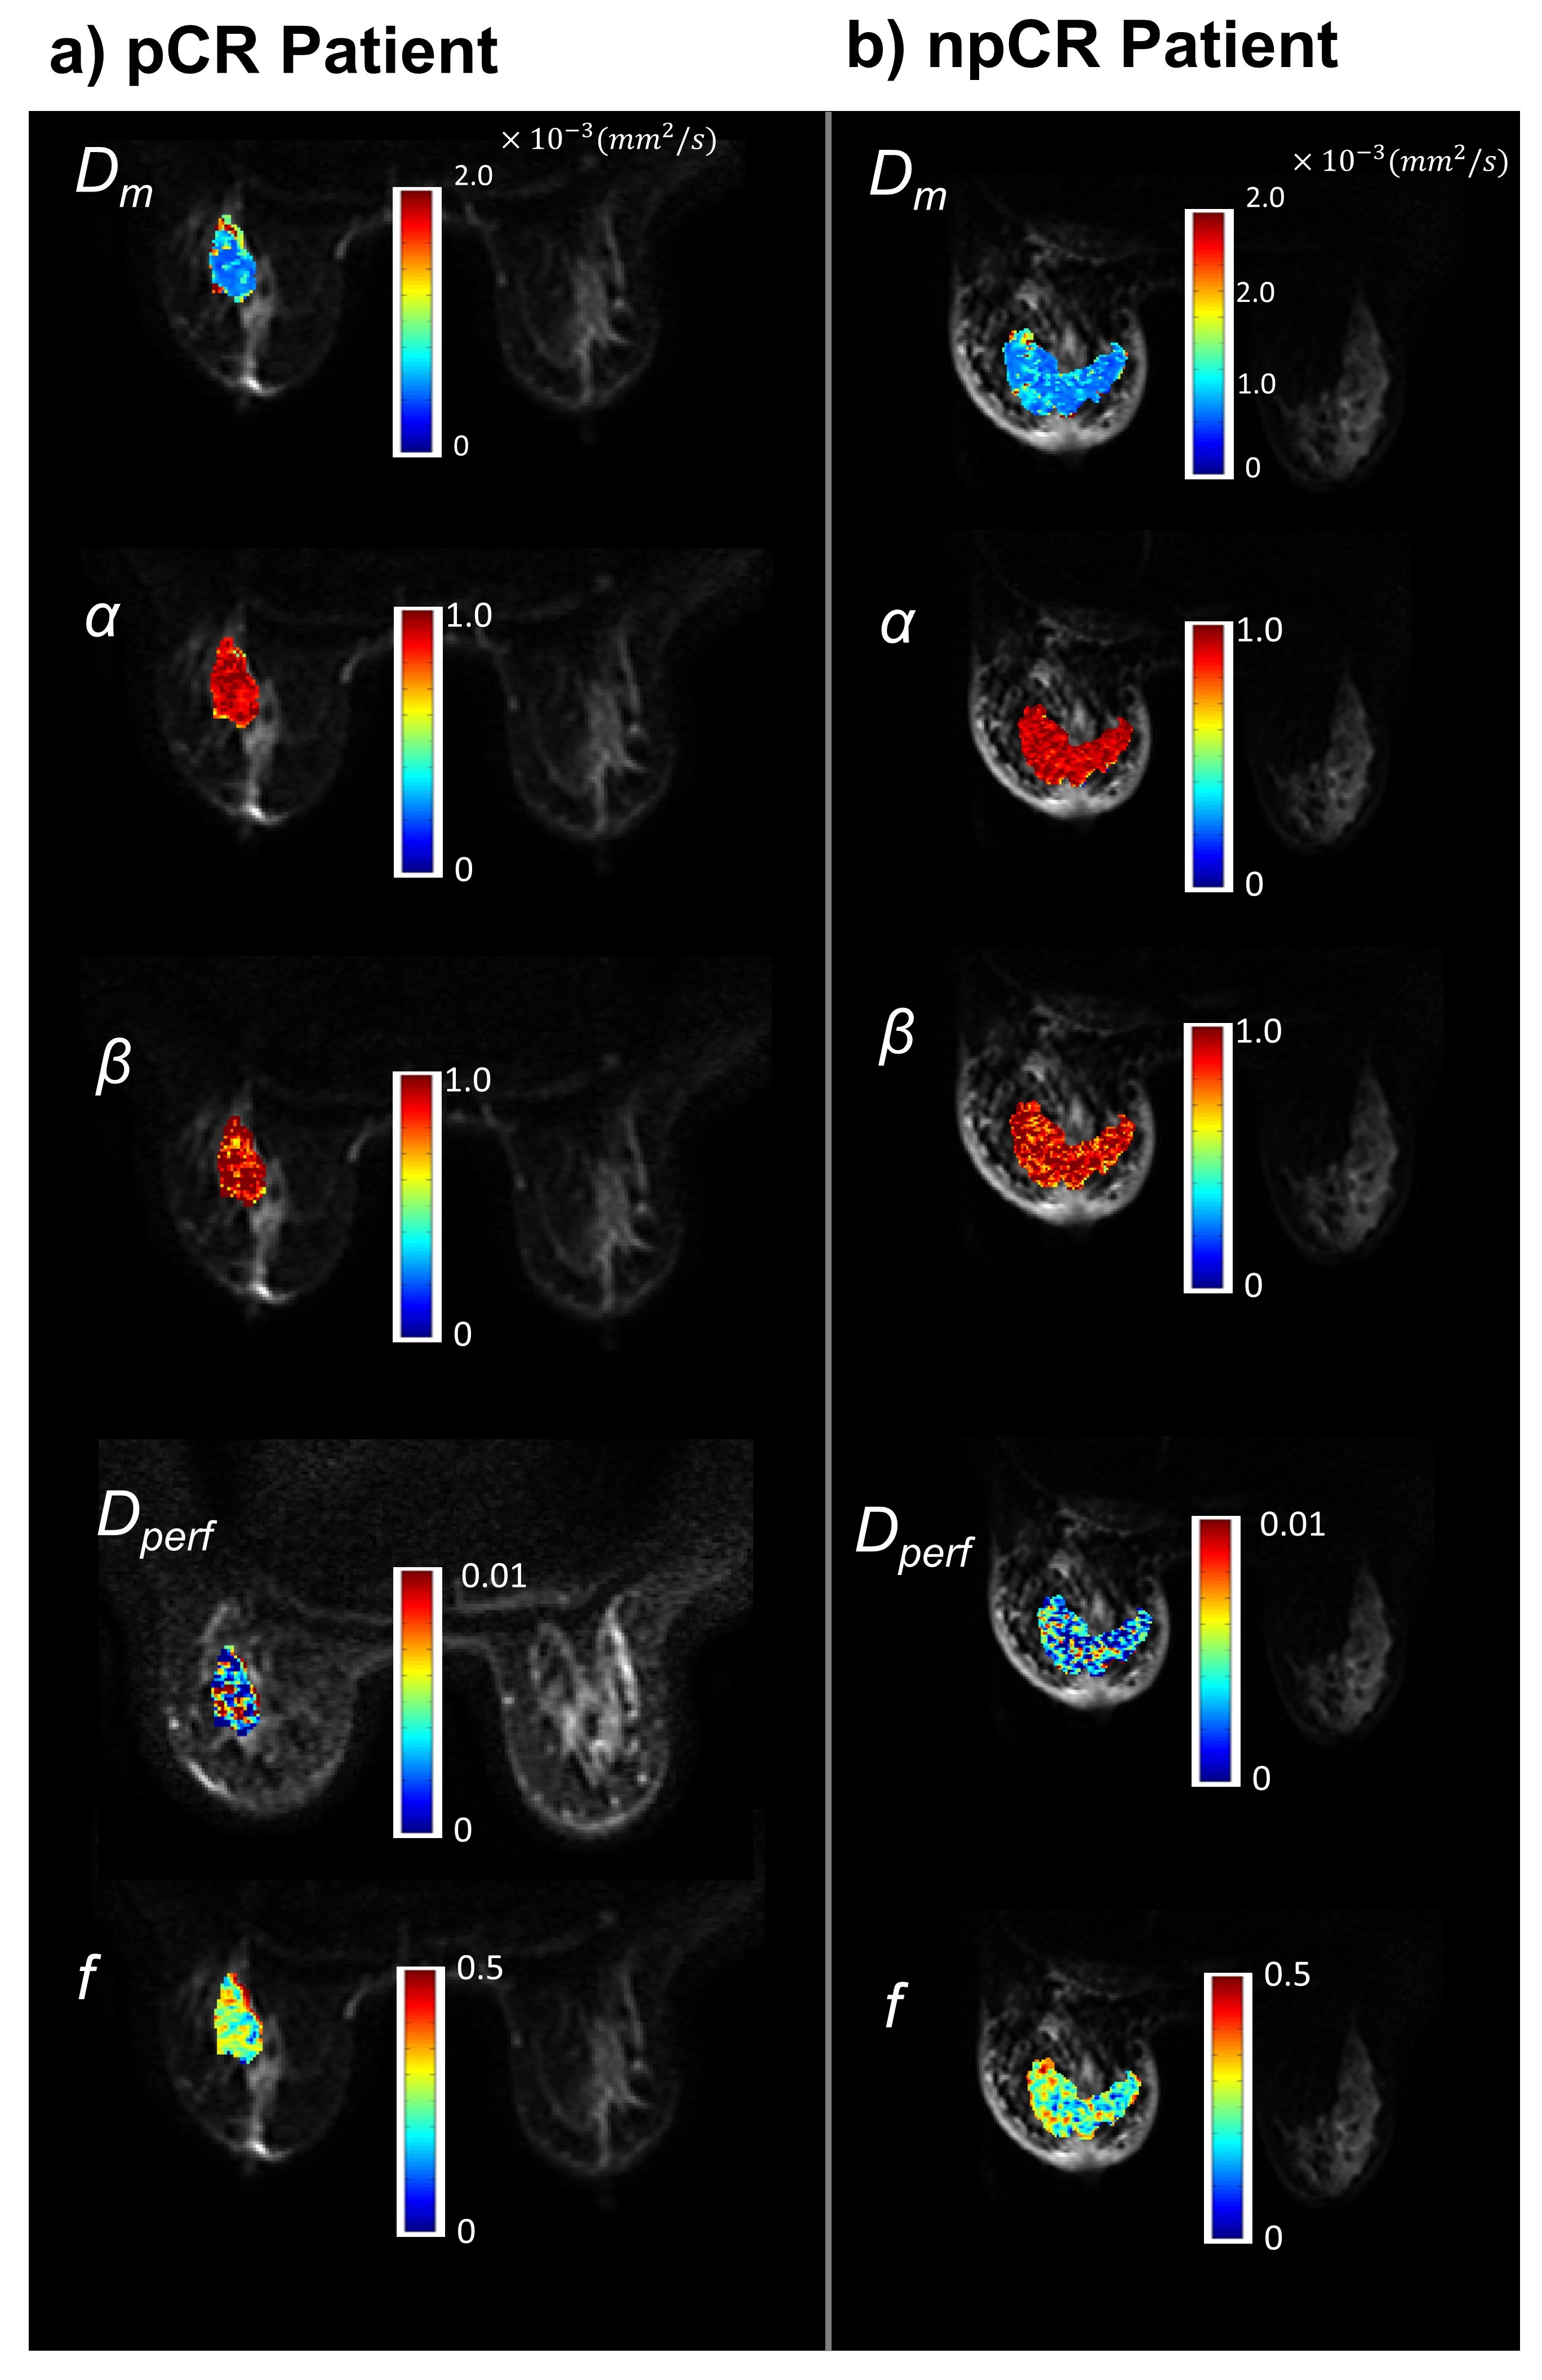
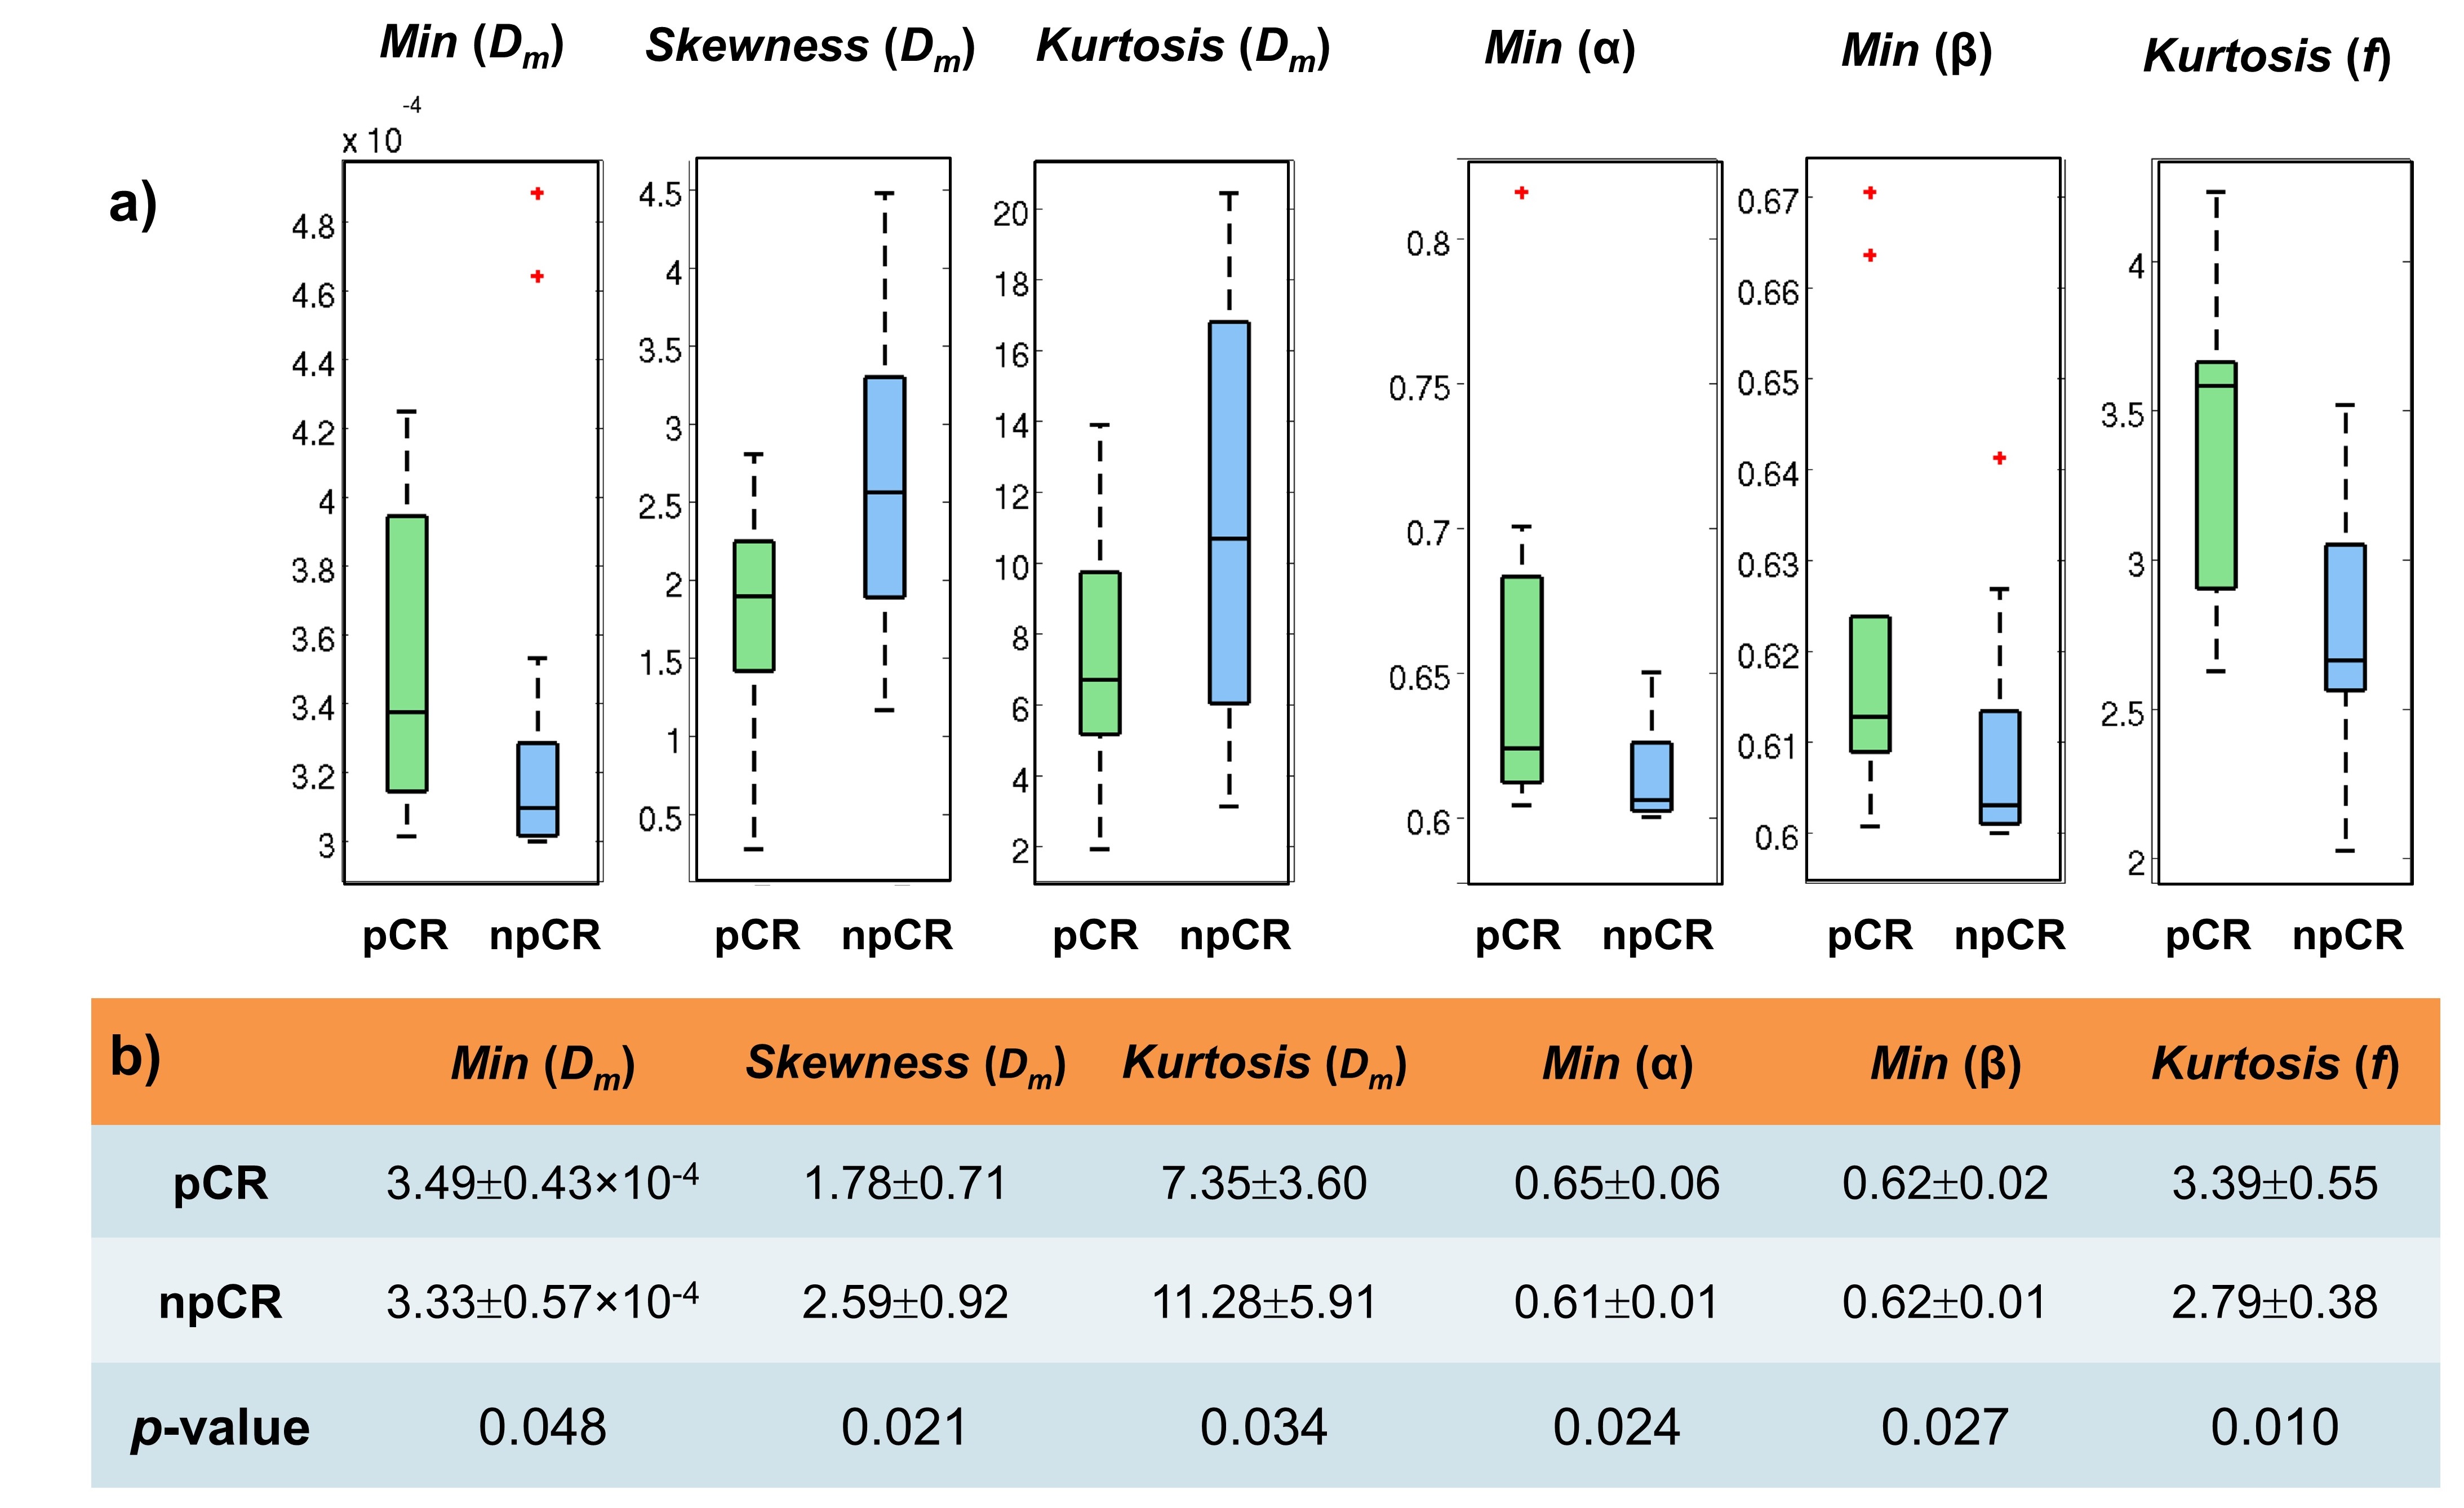
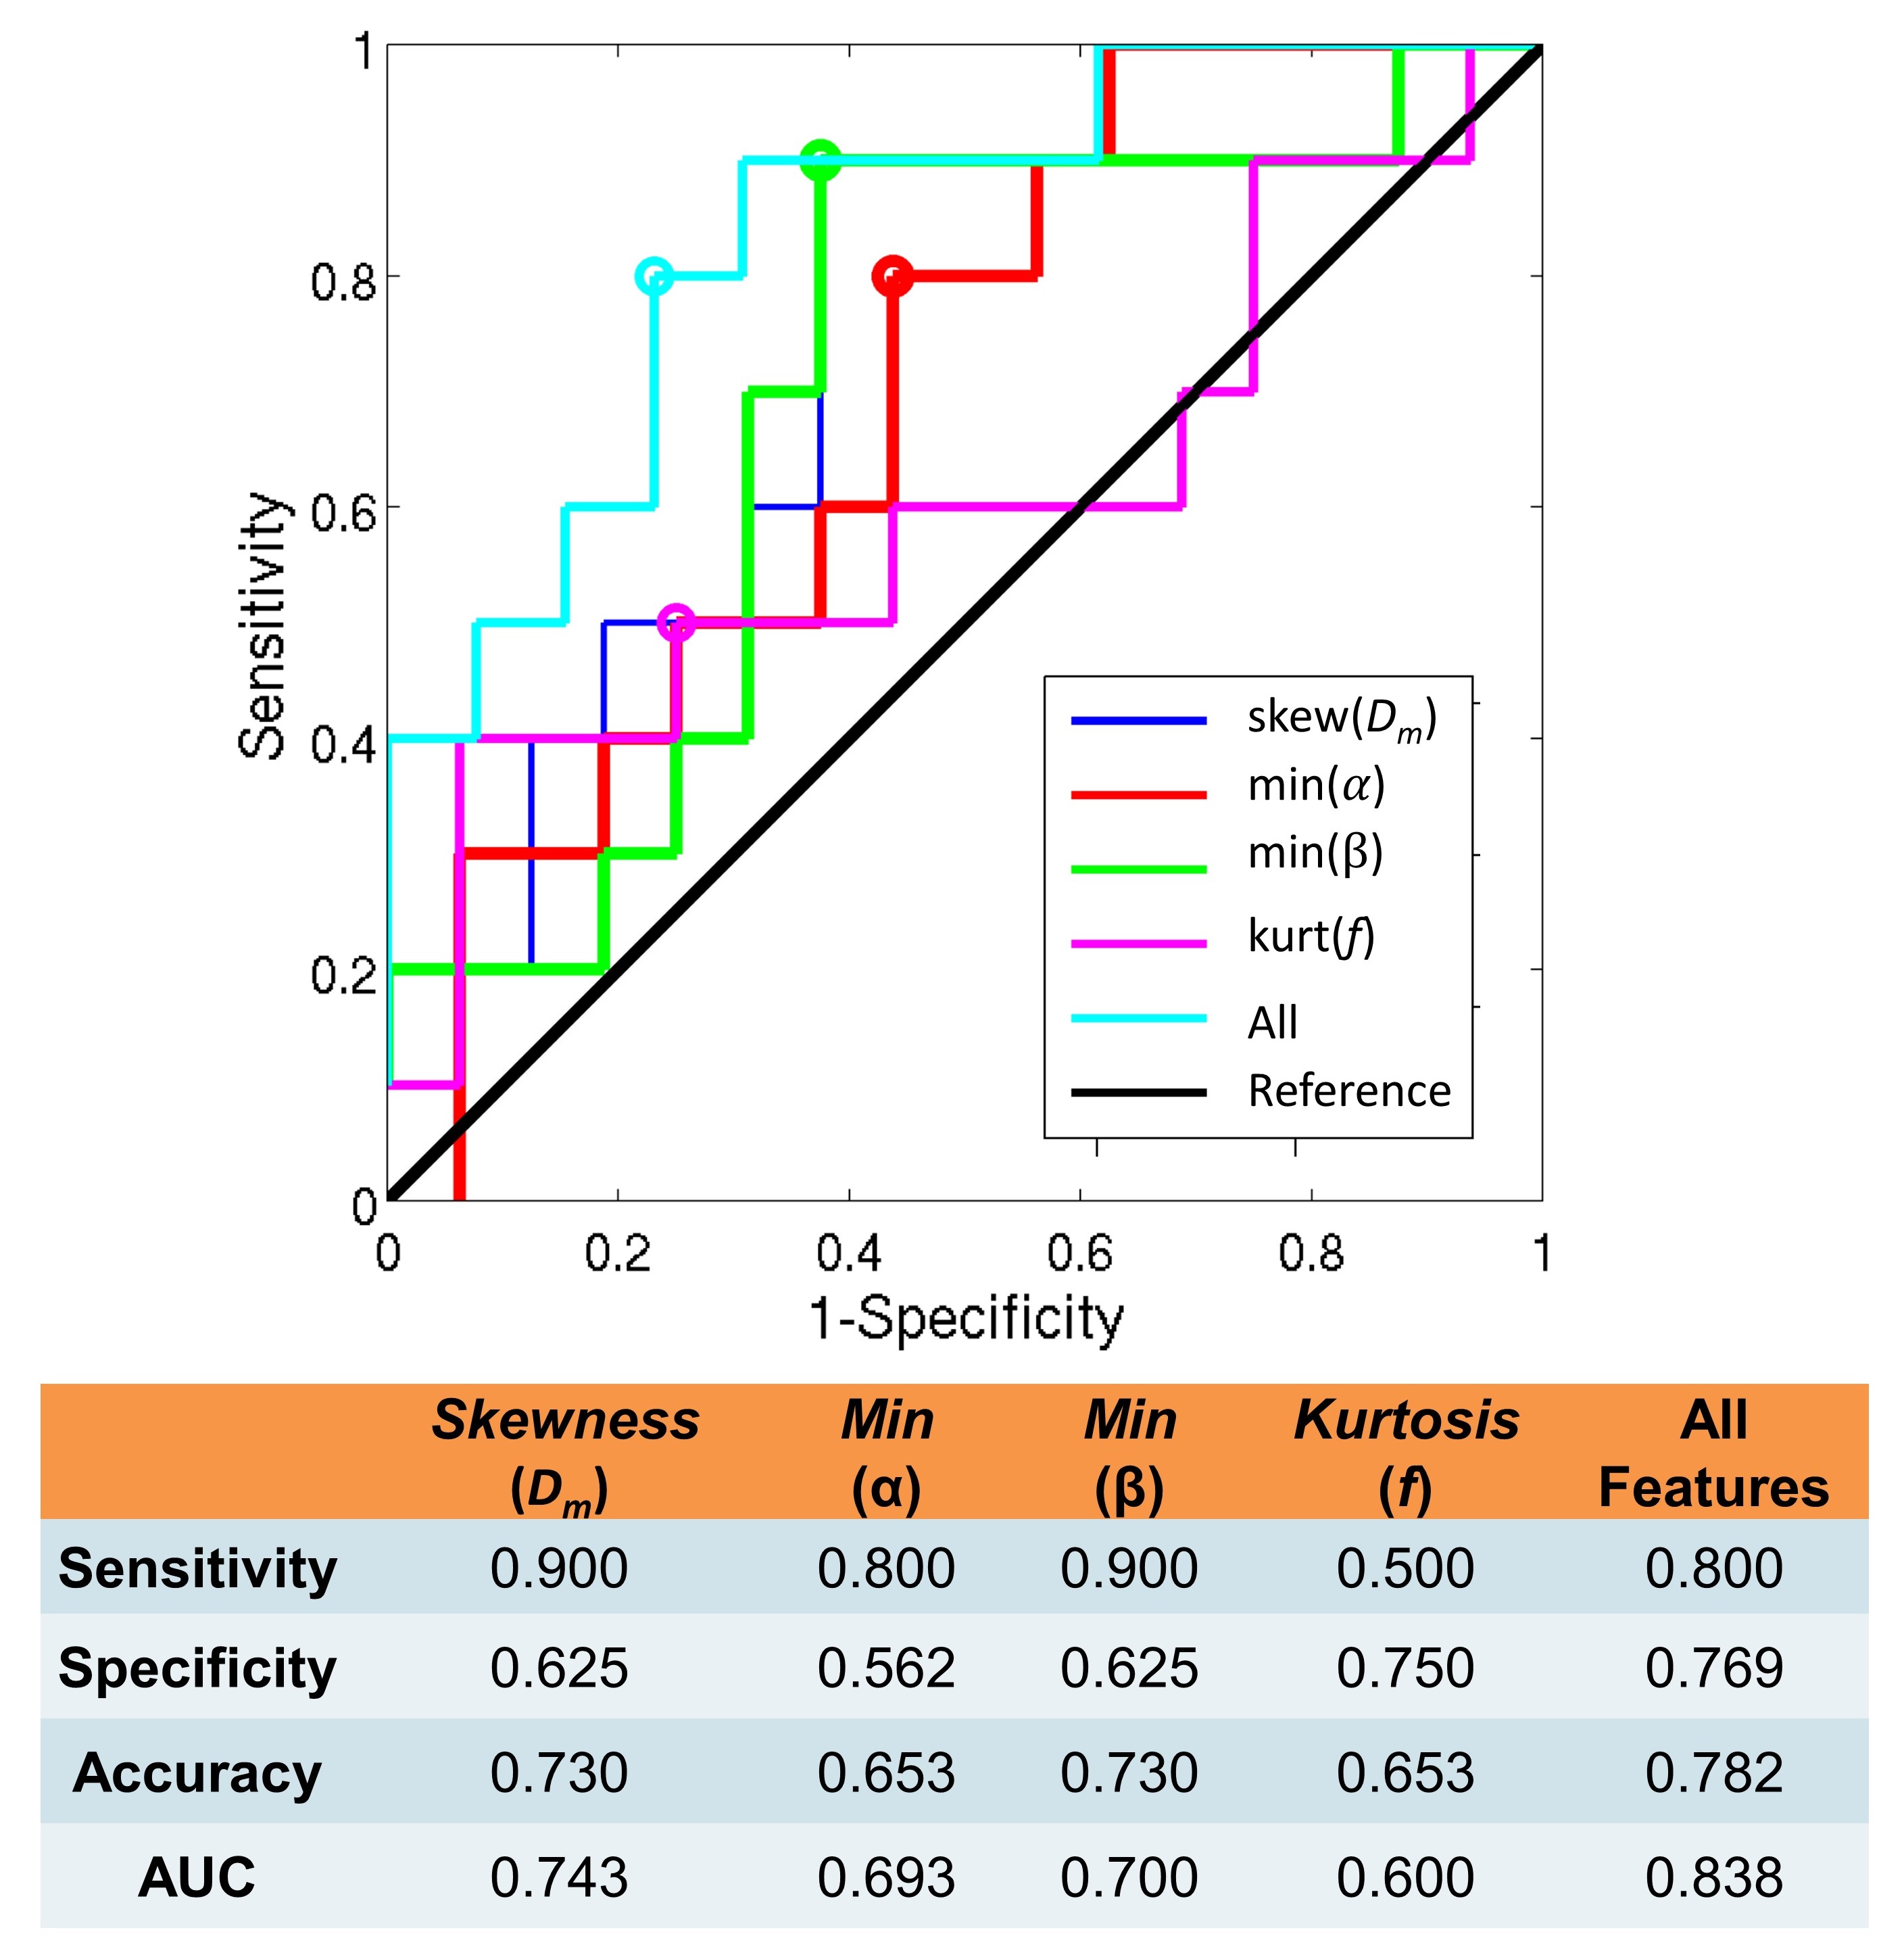
Figure 2 shows DISMANTLE parameters for a representative pCR (Figure 2a) and a npCR (Figure 2b) patient. Overall, no striking difference was seen between the DISMANTLE parameter maps of the pCR and npCR patients. However, multiple DISMANTLE-based histogram features, which cannot be observed visually, were found to be statistically significantly different among pCR and npCR groups (p<0.05) as seen in the boxplots and the corresponding summary statistics in Figure 3. Minimum, kurtosis, and skewness values of Dm (min[Dm], kurtosis[Dm], skewness[Dm], respectively), minimum values of α (min[α]) and β (min[β]), and kurtosis of f (kurtosis[f]) revealed statistically significant differences among the groups while none of the features from Dperf showed significance. As illustrated in the ROC curves and the corresponding performance metrics in Figure 4, the combination of skewness[Dm], min[α], min[β], and kurtosis[f] produced a larger area-under-the-curve (AUC; 0.838) and accuracy (0.782), and a more balanced sensitivity (0.800) and specificity (0.769) compared to the individual features in predicting breast cancer’s response to NAC.Discussion and Conclusion
We have investigated the pre-treatment DISMANTLE parameter maps using histogram features to classify tumor response to NAC in breast cancer. This study serves as an example to probe tissue complexity by characterizing cellularity, vascularity, and heterogeneity from a full b-value spectrum with a unified mathematical representation. In particular, tissue heterogeneity was integrated into the battery of histogram features as a possible marker. Our results indicated that DISMANTLE-based histogram features can differentiate between response groups prior to the start of treatment with high sensitivity and specificity. Although further investigations with a larger cohort are required, this study demonstrates promising potential of using an integrated diffusion MRI approach to evaluate pre-treatment tumor cellularity, vascularity, and heterogeneity for predicting treatment response.Acknowledgements
No acknowledgement found.References
[1] Smith IC, Heys SD, Hutcheon AW, et al. Neoadjuvant chemotherapy in breast cancer: Significantly enhanced response with docetaxel. J. Clin. Oncol. 2002, 20, 1456–1466.
[2] Tannock IF. Tumor physiology and drug resistance. Cancer Metastasis Rev. 2001;20(1-2):123-32.
[3] Le Bihan D. Apparent diffusion coefficient and beyond: What diffusion MR imaging can tell us about tissue structure. Radiology. 2013;268(2):318-322.
[4] Tang L, Zhou XJ. Diffusion MRI of cancer: From low to high b-values. J Magn Reson Imaging. 2019;49(1):23-40.
[5] Chen L, Liu M, Bao J, et al. The correlation between apparent diffusion coefficient and tumor cellularity in patients: A meta-analysis. PLoS One. 2013;8(11).
[6] Jiang R, Ma Z, Dong H, et al. Diffusion tensor imaging of breast lesions: Evaluation of apparent diffusion coefficient and fractional anisotropy and tissue cellularity. Br J Radiol. 2016;89(1064).
[7] Le Bihan D, Breton E, Lallemand D, et al. MR imaging of intravoxel incoherent motions: application to diffusion and perfusion in neurologic disorders. Radiology. 1986;161(2):401-407.
[8] Ingo C, Magin RL, Colon-Perez L, Triplett W, Mareci TH. On random walks and entropy in diffusion‐weighted magnetic resonance imaging studies of neural tissue. Magn Reson Med. 2014;71:617–627.
[9] Karaman MM, Sui Y, Wang H, et al. Differentiating low- and high-grade pediatric brain tumors using a continuous-time random-walk diffusion model at high b-values. Magn Reson Med. 2016;76(4):1149-1157
[10] Karaman MM, Bu Y, Dan G, et al. A hybrid DWI approach for simultaneous assessment of cellularity, vascularity, and heterogeneity of breast lesions. International Society for Magnetic Resonance in Medicine 28th Scientific Meeting, Virtual Meeting, 2021; 0139.
[11] Le Bihan D, Breton E, Lallemand D, et al. Separation of diffusion and perfusion in intravoxel incoherent motion MR imaging. Radiology. 1988: 168(2):497-505.
[12] Sigmund EE, Cho GY, Kim S, et al. Intravoxel incoherent motion imaging of tumor microenvironment in locally advanced breast cancer. Magn Reson Med. 2011;65:1437-1447.
[13] Cho GY, Moy L, Zhang JL, et al. Comparison of fitting methods and b-value sampling strategies for intravoxel incoherent motion in breast cancer. Magn Reson Med. 2015;74(4):1077-1085.
Figures