4012
Quantitative analysis of ultrafast DCE-MRI to distinguish benign and malignant breast lesions in a clinical setting
Anum S. Kazerouni1, Yun An Chen1, Callie Lind2, Inyoung Youn3, Savannah C. Partridge1, and Habib Rahbar1
1Radiology, University of Washington, Seattle, WA, United States, 2Bioengineering, University of Washington, Seattle, WA, United States, 3Radiology, Sungkyunkwan University School of Medicine, Seoul, Korea, Republic of
1Radiology, University of Washington, Seattle, WA, United States, 2Bioengineering, University of Washington, Seattle, WA, United States, 3Radiology, Sungkyunkwan University School of Medicine, Seoul, Korea, Republic of
Synopsis
We investigate the ability of quantitative measures derived from ultrafast DCE-MRI to improve breast MRI specificity for lesion diagnosis in a clinical setting. Sixty-nine women with BI-RADS 3, 4, or 5 lesions identified on clinical breast MRI exam, with subsequent diagnostic biopsy, were retrospectively identified. Ultrafast DCE-MRI was used to calculate semi-quantitative (bolus arrival time, max slope) and quantitative (Ktrans, vp) features for each lesion visible on the ultrafast series. Malignant lesions showed significantly higher vp compared to benign lesions. Combined with qualitative assessment of visibility on ultrafast DCE-MRI (“yes”/“no”), vp showed an AUC=0.73 for lesion diagnosis.
Introduction
Although conventional dynamic contrast-enhanced (DCE-) breast MRI, which involves a high spatial resolution and low temporal resolution acquisition, offers high sensitivity for lesion detection, its intermediate specificity results in unnecessary biopsies and limits its use for breast cancer screening. Ultrafast DCE-MRI acquires T1-weighted images at a high temporal resolution immediately after initial injection of contrast. This enables quantitative assessment of contrast uptake, providing measures of lesion vascular characteristics that could potentially supplement or replace conventional kinetic enhancement features. In this study, we investigated whether quantitative assessment of ultrafast DCE-MRI, integrated into a routine clinical breast MRI protocol, could increase the specificity of breast MRI for lesion diagnosis.Methods
Subjects and MRI acquisition:Women who underwent a breast MRI at our institution (March 2019 to August 2020) with a BI-RADS 3, 4, or 5 lesion and subsequent diagnostic biopsy were retrospectively identified for this study. Patients with known breast cancer (i.e., BI-RADS category 6 lesion) were excluded. Imaging was performed on a 3T clinical scanner (Achieva, Philips Healthcare) with a dedicated 16-channel breast coil. Breast MRI exams included two DCE-MRI protocols: 1) a conventional (high spatial resolution) DCE-MRI and 2) an ultrafast DCE-MRI series acquired over the first ~45s after contrast injection (0.1mmol/kg-body-weight delivered at 2cc/sec followed by a 15cc saline flush) (Figure 1). Conventional DCE-MRI, which was only used for lesion localization, was acquired using a fat suppressed, 3D fast gradient echo sequence with one pre-contrast and at least three post-contrast acquisitions centered at 2, 4, and 6 minutes after contrast injection. Ultrafast DCE-MRI was performed during a previously idle delay time using a fat suppressed, 3D fast gradient echo sequence with compressed SENSE (reduction factor=7), TR=2.7ms, TE=1.4ms, α=10º, FOV=240×360cm, matrix=132×199, slice thickness=3mm, with a volume collected every ~8s, and a total of five post-contrast volumes.
Quantitative analysis of ultrafast DCE-MRI:
Prior to quantitative analysis, the ultrafast series was corrected for any motion using a 2-D affine registration (MATLAB, MathWorks, Natick, MA). Subtraction images (post-contrast minus pre-contrast) were created at each ultrafast timepoint. Lesions were qualitatively labeled as “yes” or “no” visible enhancement on subtraction images during the ultrafast series. Lesions with visible enhancement were included in subsequent quantitative analysis, and lesion regions-of-interest (ROIs) were segmented using fuzzy c-means clustering. Both semi-quantitative1 and quantitative2 methods were used to characterize lesion contrast kinetics on ultrafast DCE-MRI. For semi‑quantitative analysis, relative enhancement (%) curves were fit to a half-logistic function yielding voxel-wise measures of contrast bolus arrival time (BAT) that were then normalized to the aorta BAT for each patient. The slope of the relative enhancement curve was used to calculate the maximum slope (MS, %·s -1) for each voxel. For quantitative analysis, ultrafast DCE-MRI was fit to a modified Kety-Tofts model to extract pharmacokinetic parameters (Ktrans (min-1) and vp), using a population arterial input function and assuming a native T1 value of 1400 ms3. For each measure (BAT, MS, Ktrans, vp), the median was calculated across all voxels within the ROI for each lesion.
Differences between benign and malignant lesions for each imaging measure were calculated using Wilcoxon rank sum test (p<0.05 considered significant). Diagnostic performance was assessed by area under the receiver operating characteristic curve (AUC).
Results
Sixty-nine women were retrospectively identified and evaluated for this study (median age: 47, range: 27-73 years). Of the 72 total lesions, 19 (26%) were diagnosed as malignant and 53 (74%) as benign. Ten lesions exhibited no visible enhancement over the 45s ultrafast timeframe and were all found to be benign. The remaining 62 lesions (malignant: N=19, benign: N=43) were visible on subtraction images and were segmented for quantitative analysis. Malignant lesions demonstrated significantly higher vp (0.033 vs. 0.023, p=0.03, AUC = 0.67) compared to benign lesions (Figure 2), as well as higher MS, trending towards significance (11.3 vs. 8.0 %·s-1 p=0.07, AUC = 0.65). No significant differences were observed in Ktrans or BAT. A multivariable model including vp and qualitative assessment of enhancement during the ultrafast series (i.e., “yes” or “no” visible enhancement) showed an improved AUC = 0.73, compared to qualitative assessment alone (AUC = 0.59, Figure 3).Discussion & Conclusion
These results demonstrate that quantitative assessment of ultrafast DCE-MRI can aid in discrimination of benign and malignant lesions without increasing image acquisition time. It is important to note this ultrafast approach is compatible with both conventional and abbreviated MRI protocols. Malignant lesions were observed to have higher vp and MS, indicating increased lesion vascularity, supporting findings in previous studies1,2,4. Additionally, our results suggest absence of enhancement during an ultrafast series (≤45s post-contrast) may help exclude malignancy and reduce unnecessary biopsies. Furthermore, we demonstrated the feasibility of quantitative DCE-MRI in a clinical breast protocol through the estimation of pharmacokinetic parameters from ultrafast data. This quantitative analysis can facilitate comparisons of parameter values across institutions and provide insight into the underlying physiological characteristics of a lesion. Altogether, these findings support the integration of an ultrafast series in clinical protocols to improve specificity of breast MRI and potentially allow for reduced scan times.Acknowledgements
Supported by NIH grants R01CA203883 and R01CA248192.References
- Mann, R. M. et al. A Novel Approach to Contrast-Enhanced Breast Magnetic Resonance Imaging for Screening: High-Resolution Ultrafast Dynamic Imaging. Invest. Radiol. 49, 579–585 (2014).
- Wu, C., Pineda, F., Hormuth, D. A., Karczmar, G. S. & Yankeelov, T. E. Quantitative analysis of vascular properties derived from ultrafast DCE-MRI to discriminate malignant and benign breast tumors. Magn. Reson. Med. 81, 2147–2160 (2019).
- Tsai, W.-C. et al. B1 Field Correction of T1 Estimation Should Be Considered for Breast Dynamic Contrast-enhanced MR Imaging Even at 1.5 T. Radiology 282, 55–62 (2016).
- Sorace, A. G. et al. Distinguishing benign and malignant breast tumors: preliminary comparison of kinetic modeling approaches using multi-institutional dynamic contrast-enhanced MRI data from the International Breast MR Consortium 6883 trial. J. Med. Imaging 5, 011019 (2018).
Figures

Figure 1. Diagram of breast DCE-MRI protocol, combining conventional and ultrafast DCE-MRI acquisitions.
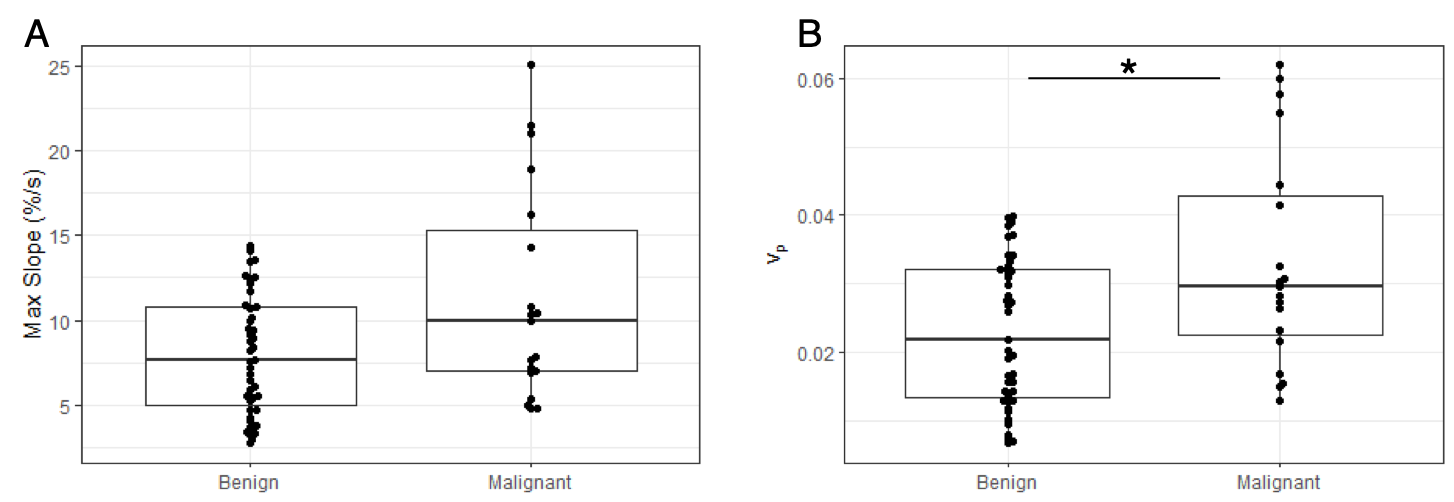
Figure 2. Box-and-whisker plots of max slope (A) and vp (B) for benign vs. malignant lesions. Compared to benign lesions, malignant lesions showed significantly higher vp (p=0.03) and higher max slope, trending towards significance (p=0.07).
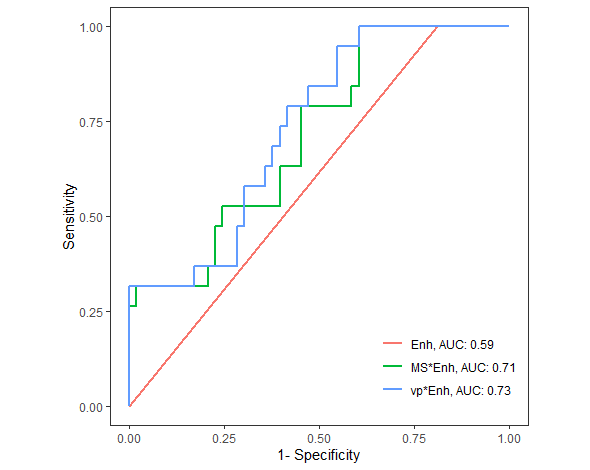
Figure 3. Receiver operating characteristic (ROC) curve analysis. Qualitative assessment of visible enhancement alone during the ultrafast series (“yes” or “no) showed an AUC=0.59 (Enh, red). Combining qualitative assessment with quantitative measures of max slope (green) or vp (blue) in a multivariable logistic regression model showed improved AUCs of 0.71 and 0.73, respectively.
DOI: https://doi.org/10.58530/2022/4012