4011
Quantification of bilateral whole-organ renal metabolic rate of O2 by exploiting conservation of flow and mass principle: a preliminary study1Dept. of Bioengineering, University of Pennsylvania, Philadelphia, PA, United States, 2Dept. of Radiology, University of Pennsylvania, Philadelphia, PA, United States
Synopsis
Type 2 diabetes mellitus is the leading cause of chronic kidney disease. Clinical measures of kidney function often detect dysfunction after irreversible damage has occurred. This highlights an unmet need for a biomarker that can enable earlier detection of disease. Quantification of renal metabolic rate of oxygen is a promising metric because it increases by 40-65% during the early stages of diabetic kidney disease. Here, we propose a “difference method” to quantify bilateral renal metabolic rate of oxygen by imaging above and below the renal vessels and exploiting conservation of blood flow rate and mass.
Introduction
Chronic kidney disease entails a progressive loss of kidney function affecting 15% of adults [1]. Current measures of kidney function are limited because they detect dysfunction after irreversible damage has occurred [2]. Renal metabolic rate of oxygen (MRO2) is a potential new biomarker because it directly represents renal function. Renal MRO2 (rMRO2) has been found to increase by 40-65% during the early stages of diabetic kidney disease [3-5], causing a mismatch between O2-supply and consumption, leading to hypoxia. Quantification of rMRO2 follows from Fick Principle by measuring blood flow velocity in the feeding artery and blood oxygenation level (SvO2) in the draining vein [6]. We have previously reported a pulse sequence [7, 8] that incorporates background-suppression and interleaves ungated-phase-contrast to simultaneously quantify blood-water T2 (subsequently converted to SvO2 via calibration curve [9-11]) and velocity in renal vein and artery, respectively. Our initial approach implemented the pulse sequence at an oblique cross-section of one kidney’s artery and vein to quantify an individual whole-organ rMRO2 [12]. Here, we propose to prescribe imaging slices above and below the branching of the renal vessels to quantify bilateral whole-organ renal MRO2 by exploiting conservation of blood flow rate and mass.Methods
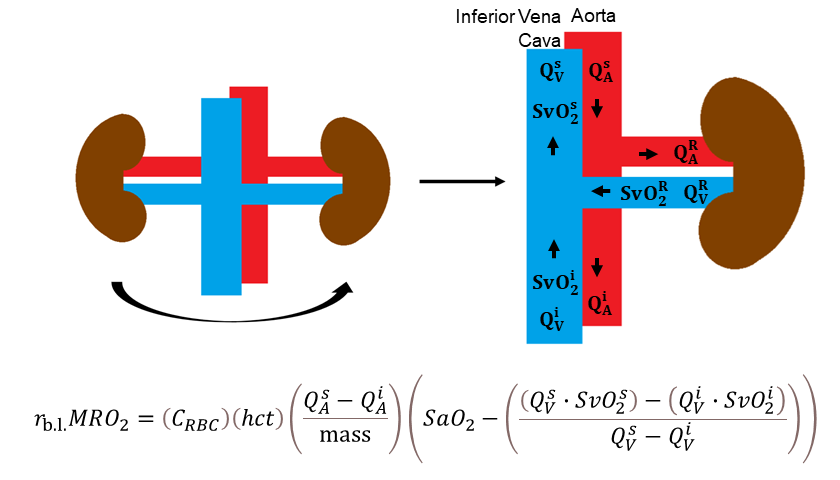
Fick Principle quantifies metabolic rate of oxygen: $$$MRO_2=(C_{RBC})(hct)\left(\frac{Q}{mass}\right)(SaO_2-SvO_2)$$$, where CRBC is oxygen carrying capacity of erythrocytes (22.02 μmol O2/mL RBC [12]), hct is hematocrit (determined by fingerstick), Q is blood flow rate, kidney mass is calculated from volume with density of 1.06g/mL [13], and SaO2 is assumed to be 98%.To quantify bilateral (b.l.) renal metabolic rate of oxygen (rb.l.MRO2), consider treating the kidneys as one system by combining each individual renal artery and vein, as illustrated in Figure 1. Blood flow rates (Q, in units of volume per time, L/Δt) are defined in the arteries (A) and veins (V) at three locations: suprarenal (s), infrarenal (i), and the “bilateral” branching renal vessels (R).
Conservation of flow rate at the branching implies (Eqn.1)$$Q_A^R=Q_A^s-Q_A^i$$ and (Eqn.2)$$Q_V^R=Q_V^s-Q_V^i$$ The flow rate of saturated-hemoglobin through the venous side is (Eqn.3)$$satHb_V^k=Q_V^k\cdot[Hb]\cdot SvO_2^k$$ where k represents each location (s, i, and R); [Hb] represents hemoglobin concentration (expressed as g/L); and SvO2 represents %oxygenated hemoglobin (unitless). Dimensional analysis yields flow rate of saturated-hemoglobin, satHb, in units g/Δt, (Eqn.4).$$satHb_V^k=Q_V^k\cdot[Hb]\cdot SvO_2^k=\frac{L}{\Delta t}\cdot\frac{g}{L}\cdot\%$$The amount of displaced saturated-hemoglobin at each venous location is expressed in grams after multiplying by Δt: (Eqn’s.5-7):$$satHb_V^s\cdot\Delta{t}=Q_V^s\cdot[Hb]\cdot SvO_2^s\cdot\Delta{t}$$$$satHb_V^i\cdot\Delta{t}=Q_V^i\cdot[Hb]\cdot SvO_2^i\cdot\Delta{t}$$$$satHb_V^R\cdot\Delta{t}=Q_V^R\cdot[Hb] \cdot SvO_2^R\cdot\Delta{t}$$ Conservation of mass implies (Eqn.8),$$satHb_V^R\cdot\Delta{t}=(satHb_V^s\cdot\Delta{t})-(satHb_V^i\cdot\Delta{t})$$i.e., the amount of saturated-hemoglobin in the bilateral renal vein is the difference between suprarenal and infrarenal saturated-hemoglobin.
Substituting Eqn’s.5-7 into Eqn.8 yields (Eqn.9),$$(Q_V^R \cdot [Hb] \cdot SvO_2^R \cdot \Delta t)=(Q_V^s \cdot [Hb] \cdot SvO_2^s \cdot \Delta{t})-(Q_V^i \cdot [Hb] \cdot SvO_2^i \cdot \Delta{t})$$ We assume that [Hb] is constant among the three locations and interpret Δt as the acquisition duration. Since the same pulse sequences will be performed above and below the renal vessels, Δt is also constant.
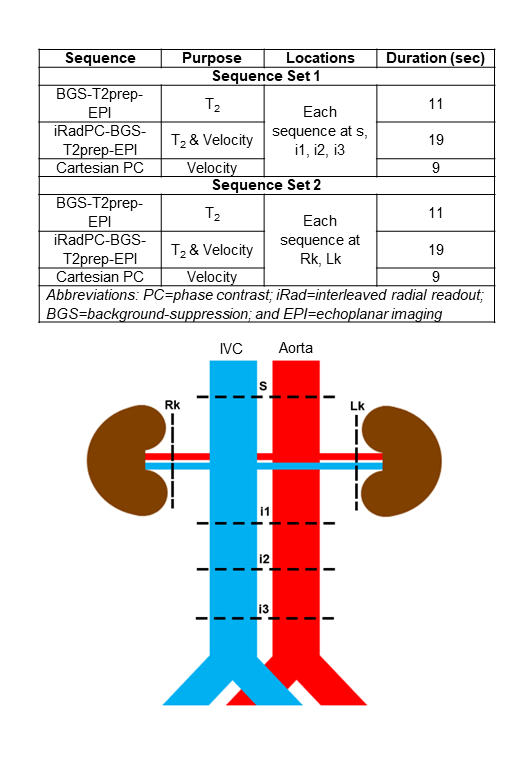
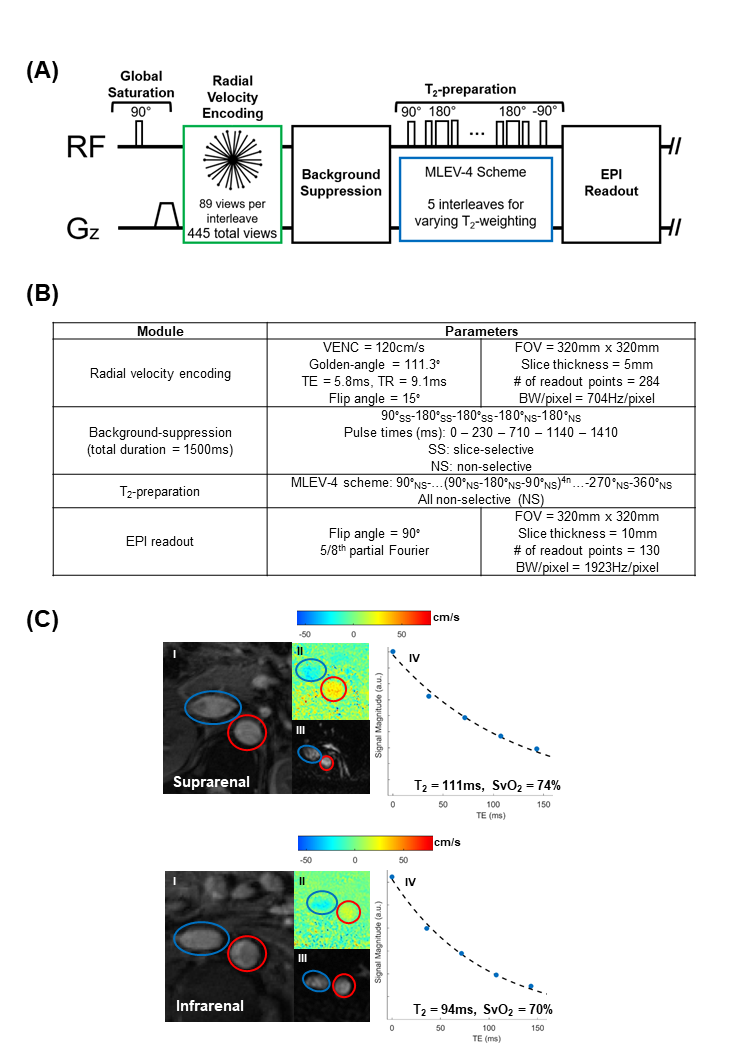
To arrive at rb.l.MRO2, the following substitutions into Fick Principle’s equation are made: (I) Eqn.1 is substituted for QAR; (II) Eqn.9 is simplified and rearranged to isolate SvO2R, and then substituted; (III) Eqn.2 is substituted for QVR, yielding (Eqn.10):$$r_{b.l.}MRO_2=(C_{RBC})(hct)\left(\frac{Q_A^s-Q_A^i}{mass}\right) \left(SaO_2-\left(\frac{(Q_V^s\cdot SvO_2^s)-(Q_V^i\cdot SvO2^i)}{Q_V^s-Q_V^i}\right)\right)$$If we further assume that the total flow rate in both renal arteries is equal to the total flow rate in both renal veins:$$$Q_A^R=Q_A^s-Q_A^i=Q_V^R=Q_V^s-Q_V^i$$$, Eqn.10 is recast as (Eqn.10B)$$r_{b.l.}MRO_2=\frac{(C_{RBC})(hct)}{mass}\left(Q_V^s(SaO_2-SvO_2^s)-Q_V^i(SaO_2-SvO_2^i)\right)$$To measure the flow rates and oxygenation levels above and below the renal vessels, we designed a protocol comprising T2-based-oximetric and ungated-phase-contrast methods, detailed in Figure 2. An illustration of the pulse sequence, parameters, and representative images are shown in Figure 3.
Five healthy subjects (avg. 25y/o, 3M) underwent imaging at 3T (Siemens-Prisma) after informed consent.
Results
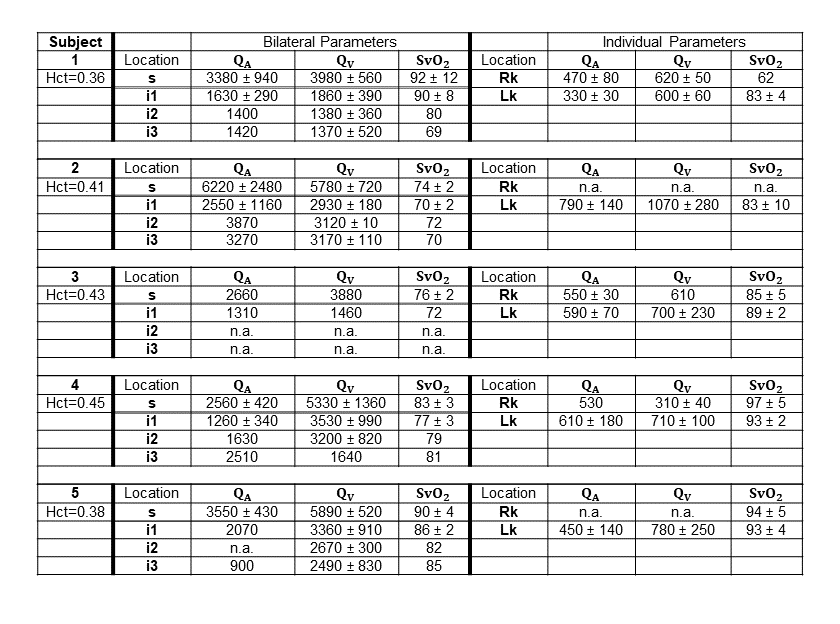
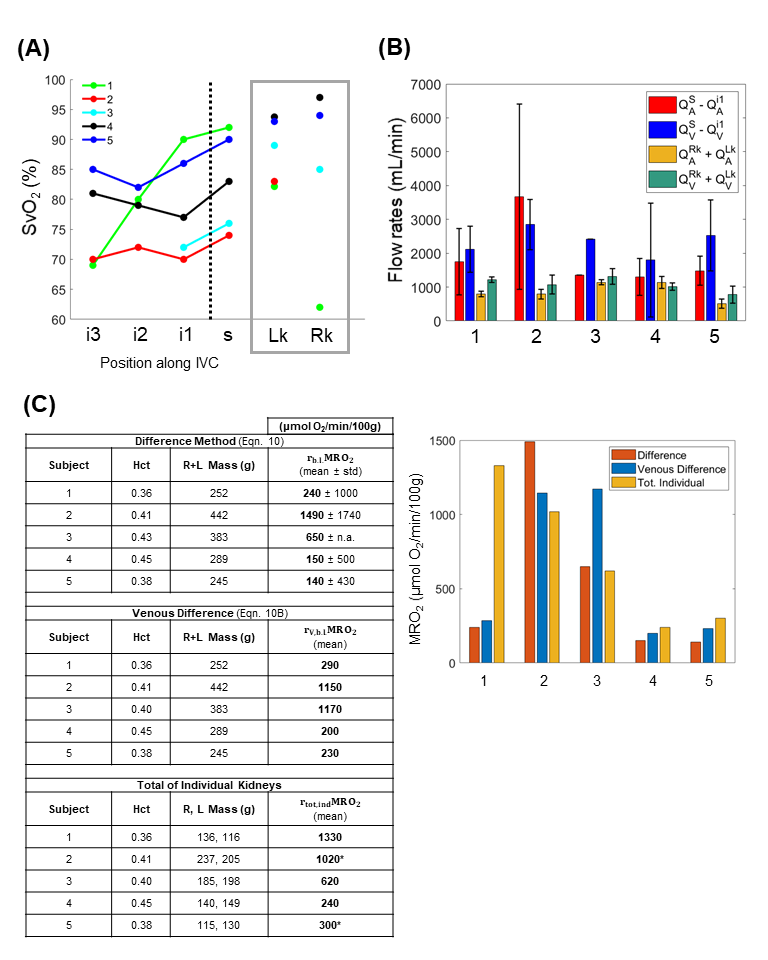
Figure 4 lists the physiological parameters. Figure 5A illustrates SvO2 values at the various locations. Renal veins are generally highly oxygenated, leading to an increase in SvO2 at the dashed-line. Figure 5B shows arterial and venous flow rates as a total and as a supra-infrarenal difference. Figure 5C reports rMRO2 via proposed difference method (Eqn.10), simplified venous difference method (Eqn.10B), and direct method for individual kidneys.Discussion
In Figure 5B, total arterial-inflow and venous-outflow from both kidneys are similar across the five subjects. Previous studies (Table 5 in [15], Table 1 in [16]) report that renal arterial and venous flow rates are comparable. This supports the simplifying assumption, $$$Q_A^R=Q_V^R$$$. Moreover, prior work with phase-contrast MRI found that the difference between the suprarenal and infrarenal aortic flow rates reliably quantifies total renal arterial blood flow [17]. Here, the preliminary data in the aorta were found to have more error (larger error-bars) than those in the inferior vena cava. This suggests that implementing the venous difference method (Eqn.10B) may be preferable.In Figure 5C, the quantified bilateral rMRO2 values from the three approaches. However, this preliminary study is limited in that most sequences were acquired only once since the protocol consists of 28 breath-holds. This limitation contributes to the large measurement uncertainties but is offset by the ability to repeat the protocol in subjects.
Conclusion
Although this study is limited by measurement uncertainties, the preliminary data are encouraging and suggest feasibility. The proposed methods will be further explored to quantify rMRO2, a valuable physiological parameter.Acknowledgements
Research reported in this abstract was supported by NIH Grant T32EB020087, in part by the Institute for Translational Medicine and Therapeutics’ (ITMAT) Transdisciplinary Program in Translational Medicine and Therapeutics, and in part by the National Center for Advancing Translational Sciences of the NIH under Award Number UL1TR001878. The content is solely the responsibility of the authors and does not necessarily represent the official views of the NIH.References
1. Center for Disease Control and Prevention. Chronic Kidney Disease in the United States, 2021. Atlanta, GA: US Department of Health and Human Services, Centers for Disease Control and Prevention; 2021.
2. Comai, G., et al., Histological Evidence of Diabetic Kidney Disease Precede Clinical Diagnosis. Am J Nephrol, 2019. 50(1): p. 29-36.
3. Korner, A., et al., Increased renal metabolism in diabetes. Mechanism and functional implications. Diabetes, 1994. 43(5): p. 629-33.
4. Nordquist, L., et al., Activation of hypoxia-inducible factors prevents diabetic nephropathy. J Am Soc Nephrol, 2015. 26(2): p. 328-38.
5. Friederich-Persson, M., et al., Deletion of Uncoupling Protein-2 reduces renal mitochondrial leak respiration, intrarenal hypoxia and proteinuria in a mouse model of type 1 diabetes. Acta Physiol (Oxf), 2018. 223(4): p. e13058.
6. Kety, S.S. and C.F. Schmidt, The Effects of Altered Arterial Tensions of Carbon Dioxide and Oxygen on Cerebral Blood Flow and Cerebral Oxygen Consumption of Normal Young Men. J Clin Invest, 1948. 27(4): p. 484-92.
7. Cheng, C., et al. Simultaneous measurements of blood flow and blood water T2: a general-purpose sequence for T2-based measurement of whole-organ O2 consumption. in ISMRM. 2020. Virtual.
8. Deshpande, R.S., M.C. Langham, and F.W. Wehrli. A method to rapidly quantify whole-organ metabolic rate of O2 with interleaved background-suppressed T2-oximetry and blood flow measurement. in ISMRM. 2021. Virtual.
9. Wright, G.A., B.S. Hu, and A. Macovski, 1991 I.I. Rabi Award. Estimating oxygen saturation of blood in vivo with MR imaging at 1.5 T. J Magn Reson Imaging, 1991. 1(3): p. 275-83.
10. Bush, A., et al., Empirical model of human blood transverse relaxation at 3 T improves MRI T2 oximetry. Magn Reson Med, 2017. 77(6): p. 2364-2371.
11. Lu, H. and Y. Ge, Quantitative evaluation of oxygenation in venous vessels using T2-Relaxation-Under-Spin-Tagging MRI. Magn Reson Med, 2008. 60(2): p. 357-63.
12. Deshpande, R.S., M.C. Langham, and F.W. Wehrli. Quantification of renal metabolic rate of oxygen. in ISMRM Kidney MRI Biomarkers: The Route to Clinical Adoption. 2021. Philadelphia, PA.
13. Yablonskiy, D.A., A.L. Sukstanskii, and X. He, Blood oxygenation level-dependent (BOLD)-based techniques for the quantification of brain hemodynamic and metabolic properties - theoretical models and experimental approaches. NMR Biomed, 2013. 26(8): p. 963-86.
14. Allen, T.H., H.J. Krzywicki, and J.E. Roberts, Density, fat, water and solids in freshly isolated tissues. J Appl Physiol, 1959. 14: p. 1005-8.
15. Cox, E.F., et al., Multiparametric Renal Magnetic Resonance Imaging: Validation, Interventions, and Alterations in Chronic Kidney Disease. Front Physiol, 2017. 8: p. 696.
16. Sommer, G., et al., Normal renal blood flow measurement using phase-contrast cine magnetic resonance imaging. Invest Radiol, 1992. 27(6): p. 465-70.
17. Bax, L., et al., Renal blood flow measurements with use of phase-contrast magnetic resonance imaging: normal values and reproducibility. J Vasc Interv Radiol, 2005. 16(6): p. 807-14.
Figures