4010
Improving Ultra-High b-value Prostate Diffusion Image Reconstruction at 3T1Department of Radiology, A.A Martinos Center for Biomedical Imaging / MGH, Charlestown, MA, United States, 2Harvard Medical School, Boston, MA, United States, 3Department of Biomedical Engineering, Boston University, Boston, MA, United States, 4GE Healthcare, Boston, MA, United States, 5Department of Physics, Harvard University, Cambridge, MA, United States
Synopsis
Ultra-high b-value Diffusion-weighted Prostate MR is gaining more attention in medical imaging, due to the non-invasiveness of imaging and to better contrast of malignant tissues as the lower diffusivity of water molecules can enable early diagnosis of cancer. The main drawback of MR at ultra-high b-value is the poor resultant SNR of the reconstructed images. We propose to improve the image quality of the prostate data acquired at b=2000 s/mm2 using a machine learning based reconstruction approach. Significant increase in signal intensities in the central gland and peripheral zone of the prostate was observed in healthy subjects.
Introduction
Diffusion imaging of the prostate is a powerful non-invasive imaging technique that has the potential to detect and localize prostate cancer. At high b-values it is especially interesting as it improves diffusion contrast between prostate cancer lesions and normal background tissue. However, high b-value prostate diffusion-weighted imaging even at high field strength (3T) suffers from poor image quality due to low SNR1,2. Our aim in this study was to apply a deep learning (DL) image reconstruction technique to enhance image quality of real in vivo diffusion-weighted prostate images. Recent applications of AUTOMAP - Automated Transform by Manifold Approximation to reconstruct SNR-starved datasets demonstrate significant robustness to noise and boost in SNR 3,4,5. Here, we evaluated the performance of this reconstruction approach on clinically relevant prostate imaging, where we show improvement in the image quality with higher resultant SNR at high b-values (b=2000 s/mm2) as well as better quantitative maps that can improve diagnostic performance and help detect malignancies.Materials and Methods
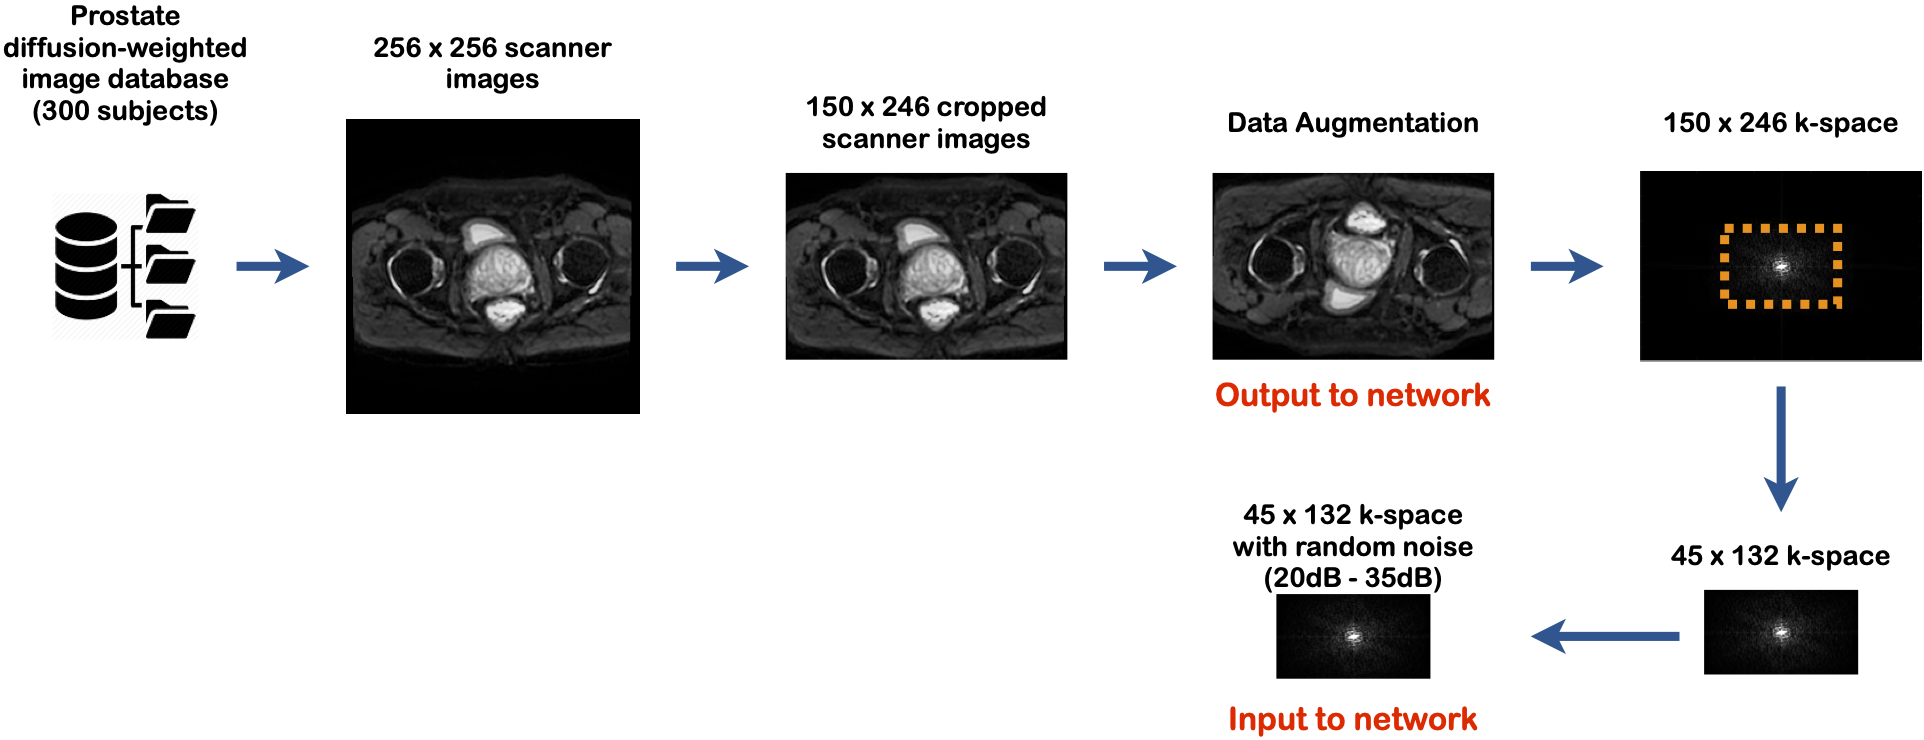
Training set: The training corpus was assembled from 51,000 2D diffusion-weighted prostate images acquired on a 3T GE SIGNA Premier MR scanner, with b-values ranging from 50 s/mm2 to 800 s/mm2. The scanner images were cropped to 150 × 246 to remove the zero-padded areas. All the prostate images were then symmetrically tiled to create translational invariance. To produce the corresponding k-space forward representations for training, each image was Fourier transformed with MATLAB’s native 2D FFT function. Then the center of each complex-valued k-space of matrix size 45 × 132 was selected. Then random additive gaussian noise ranging from 20dB to 35dB was added to the k-space data. The noisy under-sampled k-space was used as the input to the network architecture with its corresponding “clean” magnitude-only image of matrix size 150 × 246 as the output to the network architecture (Figure 1).Architecture of NN: The NN was trained to learn an optimal feed-forward reconstruction of under-sampled k-space domain into the image domain. The network, described in Figure 1, was composed of 3 fully connected layers (input layer and 2 hidden layers) of dimension n2 × 1 with hyperbolic tangent activation functions. The 2nd layer was reshaped to 150 × 246 for convolutional processing. Two convolutional layers convolved 128 filters of 3 × 3 with stride 1 followed each by a rectifier nonlinearity. The last convolution layer was finally de-convolved into the output layer with 128 filters of 3 × 3 with stride 1. The output layer resulted into the reconstructed magnitude-only image. Mean Absolute Error (MAE) was used as the evaluation metric for the training.
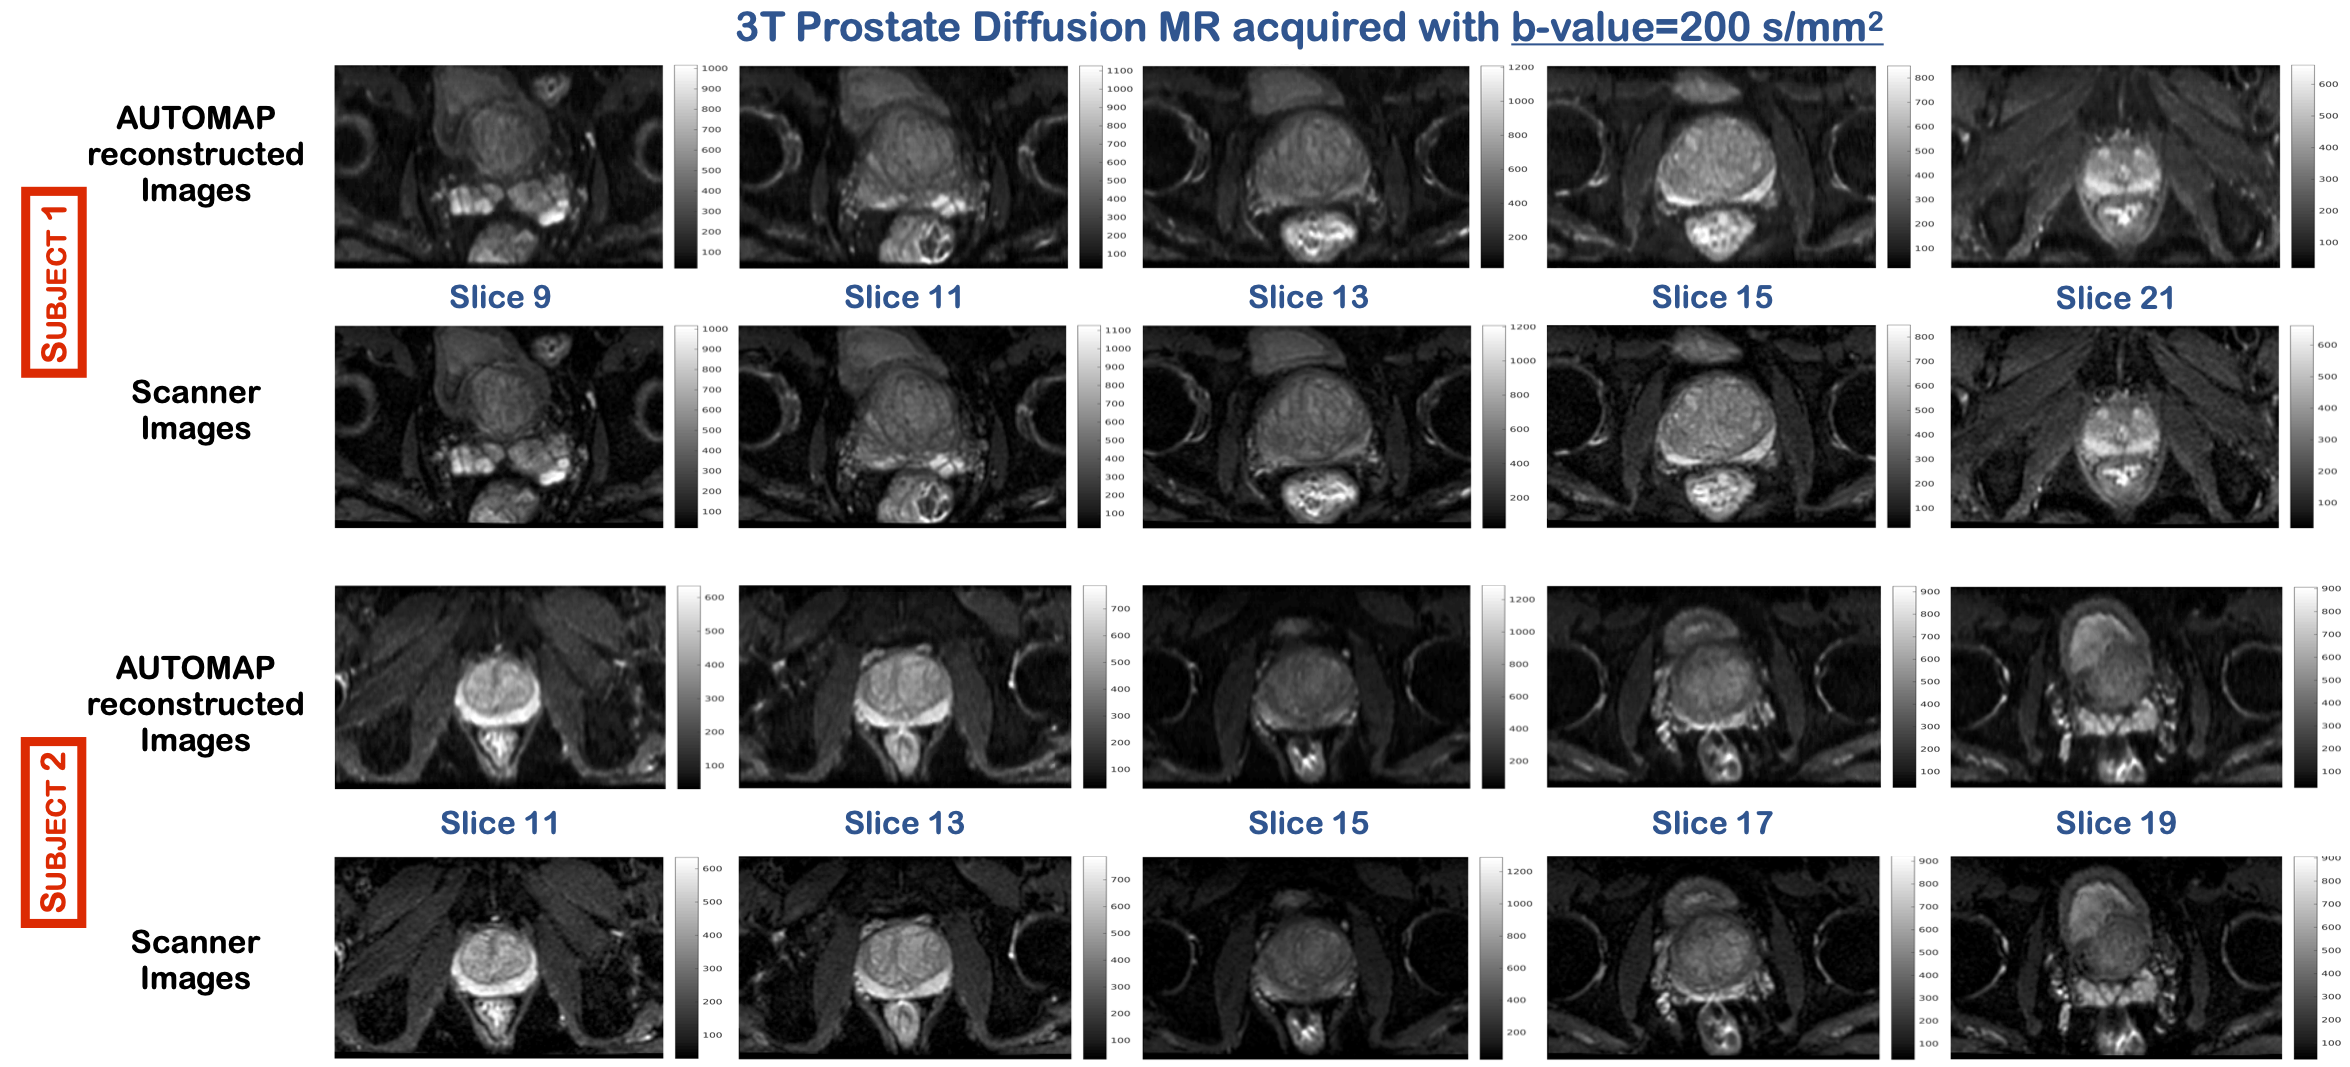
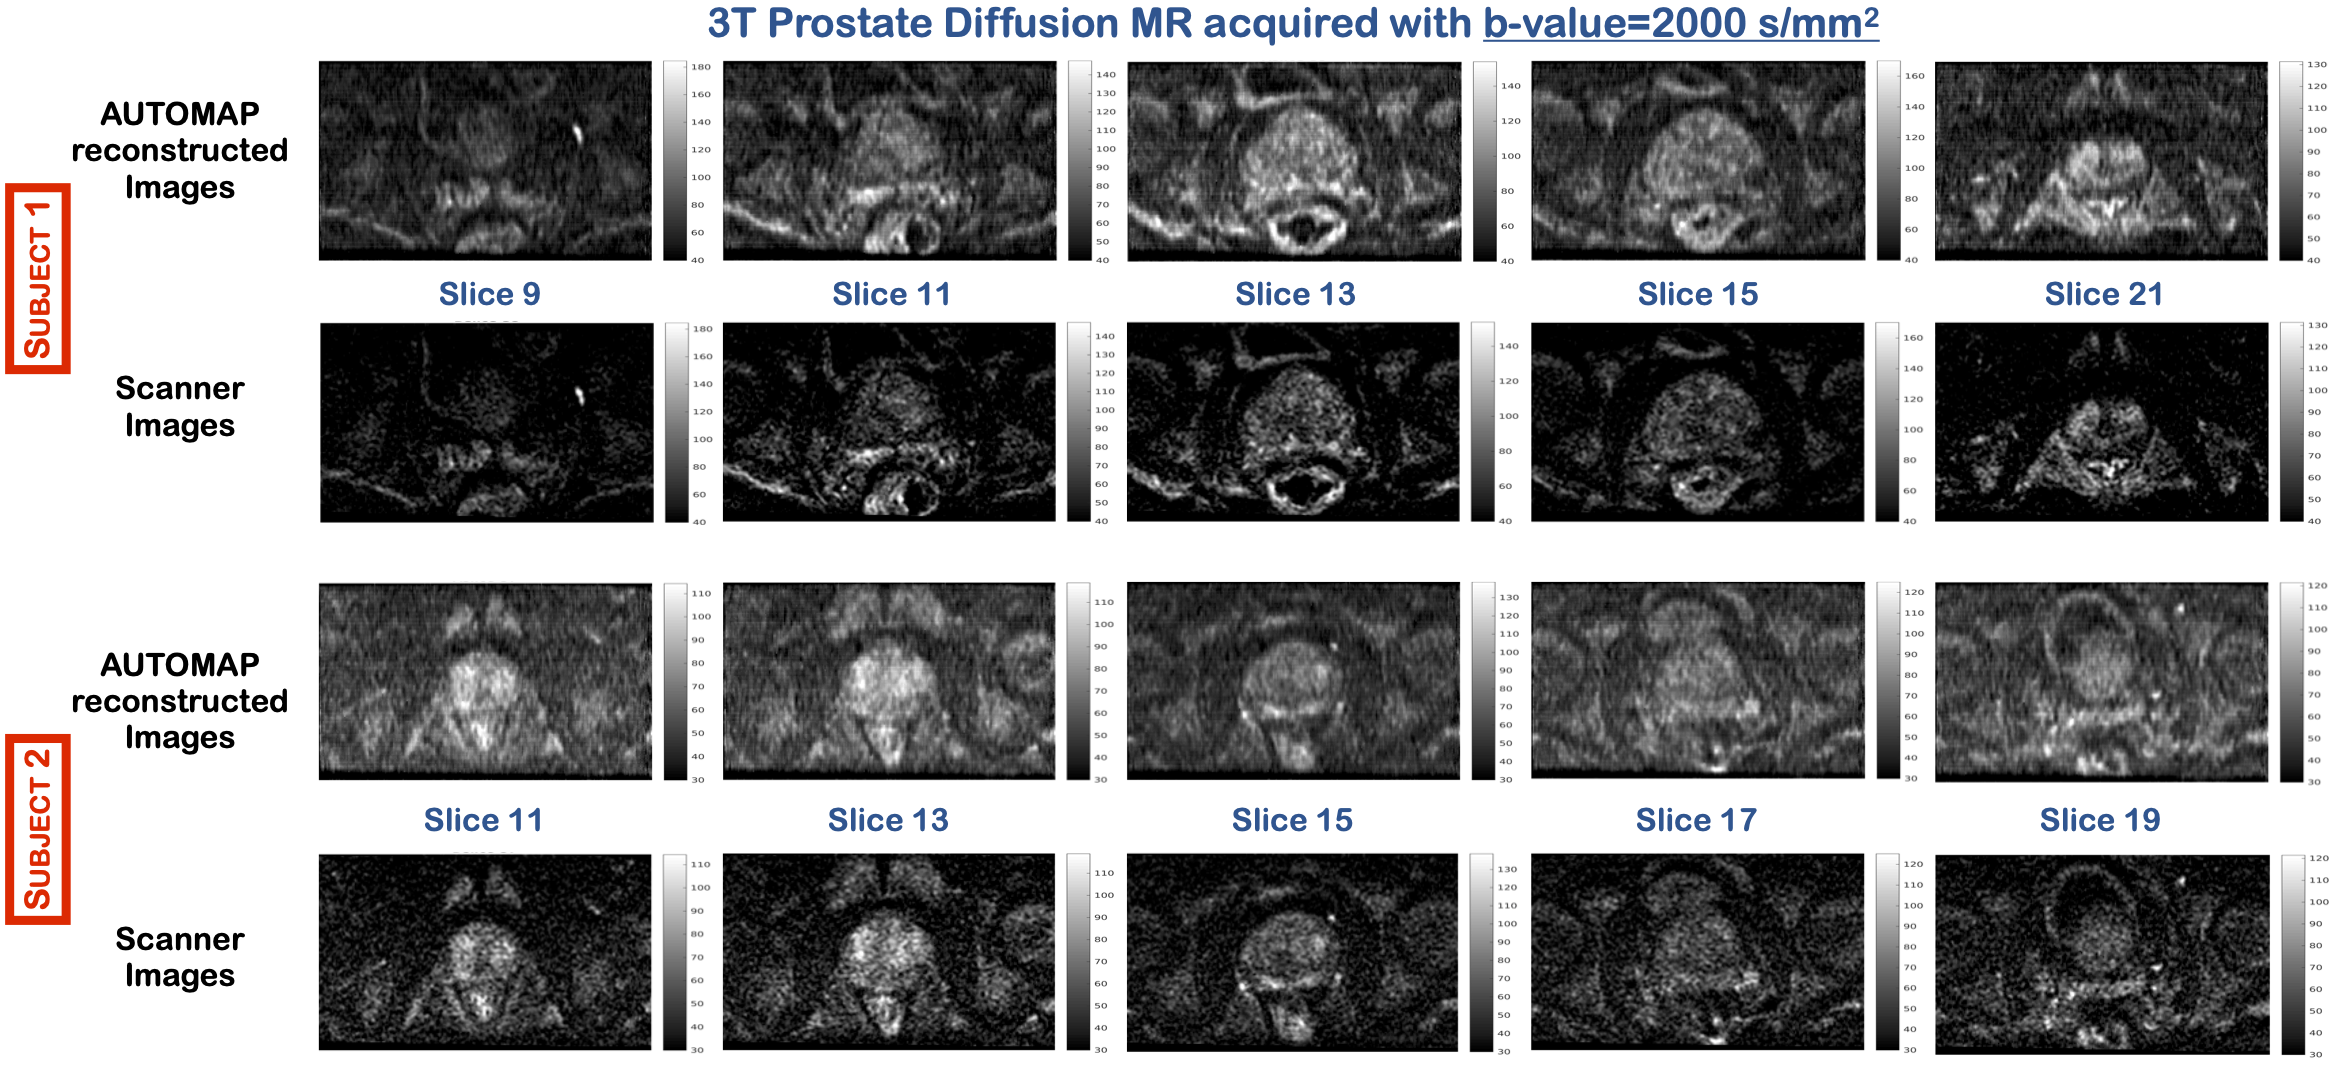
Data Acquisition and Reconstruction: 2D in vivo diffusion-weighted prostate data were acquired with an EPI-based sequence with the following parameters: acquired matrix size = 132 × 45, final image matrix size = 256 × 256, spatial resolution = 0.8 mm × 0.8 mm, slice thickness = 4 mm, number of slices = 26, number of coils = 30 and number of averages were 8 for b-value=200 s/mm2 and 18 for b-value=2000 s/mm2.For the inference experiment, the datasets of two subjects were reconstructed and assessed with the trained model and compared to scanner images which were reconstructed with the conventional non-DL method. Each slice of the scanner images was Fourier transformed with MATLAB’s native 2D FFT function, and the under-sampled center k-space (132 × 45) was reconstructed using the above trained model.
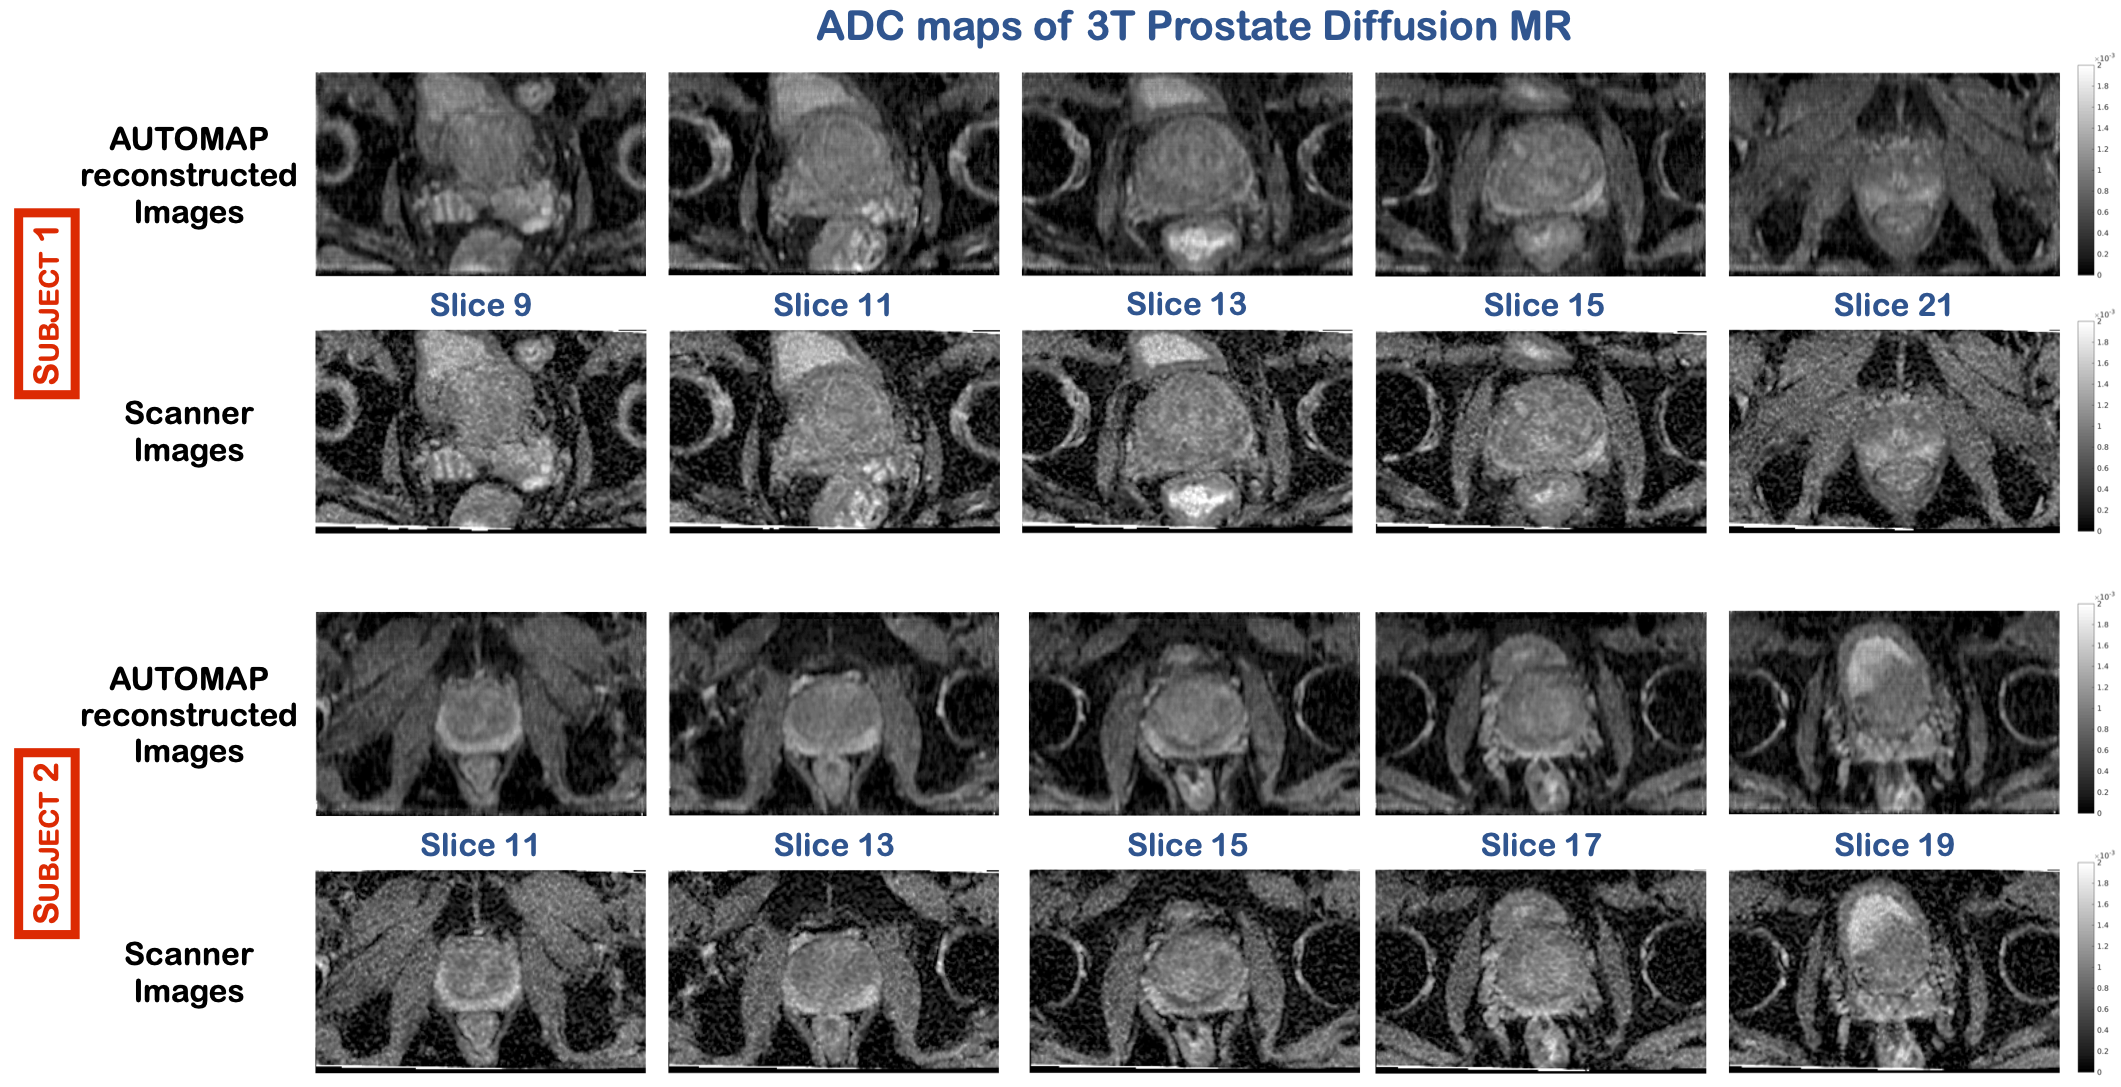
Image Analysis: The signal magnitude of each dataset was normalized to unity to enable fair comparison between the scanner images and the AUTOMAP reconstructed images. Estimated SNR (eSNR) was assessed in the central gland over multiple slices by calculating the mean signal intensity (SI) divided by the standard deviation of the SI. A two-point apparent diffusion coefficient (ADC) was also computed with $$$ \frac{1}{\left(b_2-b_1\right)}ln\left(\frac{S_1}{S_2}\right) $$$, where $$$S_1$$$, is the signal intensity with the gradient factor b-value=2000 s/mm2 and $$$S_2$$$, the signal intensity with b-value=200 s/mm2.
Results
The images reconstructed using the trained model for both subjects at b=200 s/mm2, showed no significant change in SNR (Figure 2). However, at b=2000 s/mm2, where the SNR is low, the images reconstructed with the trained model showed significant increase in signal with an eSNR gain in the central gland of ~1.5-fold higher than the scanner images (Figure 3). Quantitative ADC maps were also computed using either the scanner images or the images reconstructed with AUTOMAP (Figure 4). The mean ADC value evaluated with the scanner images and the trained model in the central gland was 960×10-6 mm2/s and 860×10-6 mm2/s respectively. The ADC value obtained with the trained model was under-estimated due the higher signal intensities obtained at b-value=2000 s/mm2. The quantitative results will be further investigated. We also observed that the AUTOMAP computed ADC maps show a clear delineation of the central gland and the peripheral zone of the prostate.Discussion and Conclusion
The reconstruction performance of this domain-specific trained model on an under-sampled low-SNR data demonstrates higher signal intensities at ultra-high b-values compared to conventional non-DL images. The significant improvement in image quality would enable substantial gains in detecting lesions and the early diagnosis of cancer. Ongoing work shall include the performance of this trained model on patients with prostate cancer.Acknowledgements
We acknowledge support for this work from GE Healthcare, and the National Science Foundation Graduate Research Fellowship under Grant No. DGE-1840990 and the NSF NRT: National Science Foundation Research Traineeship Program (NRT): Understanding the Brain (UtB): Neurophotonics DGE-1633516NSF.References
1. ‘High-b-Value Diffusion-Weighted Imaging at 3 T to Detect Prostate Cancer: Comparisons Between b Values of 1,000 and 2,000 s/mm2’, C.K Kim, B.K. Park, and Bohyun Kim, American Journal of Roentgenology 2010 194:1, W33-W37
2. ‘Signal Intensity of High B-value Diffusion-weighted Imaging for the Detection of Prostate Cancer.’ A, Rezaeian et al. “Journal of biomedical physics & engineering vol. 9,4 453-458 (2019)
3.‘Image reconstruction by domain transform manifold learning’, B. Zhu and J. Z. Liu and S. F. Cauley and B. R. Rosen and M. S. Rosen, Nature 555 487 EP - (2018).
4. ‘Boosting the signal-to-noise of low-field MRI with deep learning image reconstruction’, N. Koonjoo, N., B. Zhu, G.C. Bagnall, et al. Sci Rep 11, 8248 (2021).
5. ‘Low-field magnetic resonance imaging of roots in intact clayey and silty soils’, G.C Bagnall, N. Koonjoo, S. A. Altobelli, et al. Geoderma 370, 114356 (2020)
Figures