4009
Renal mass assessment using Ultrashort Time-to-Echo sequences with ferumoxytol
Tianyi Zhou1, Liam Timms1, Aya Hamadeh2, David Drew3, Mukesh Harisinghani2, and Srinivas Sridhar1
1Department of Physics, Northeastern University, Boston, MA, United States, 2Department of Radiology, Massachusetts General Hospital, Boston, MA, United States, 3Tufts Medical Center, Boston, MA, United States
1Department of Physics, Northeastern University, Boston, MA, United States, 2Department of Radiology, Massachusetts General Hospital, Boston, MA, United States, 3Tufts Medical Center, Boston, MA, United States
Synopsis
A ferumoxytol-enhanced MRA technique using Ultrashort Time-to-Echo (UTE) sequences is demonstrated for kidney vasculature mapping and renal mass assessment. The blood volume (BV) map is calculated by scaling the post- and pre-contrast subtraction image from 0 to 1. BV is measured in one cystic mass (-6±7)% and one complex mass (17±8)% with sub-regions BV up to (32±10)% and (30±7)%. The quantification of BV provides a measurement of the distribution of micro-vessel density, reflecting the vascularity of the kidneys and masses. This technique potentially benefits surgical planning, renal mass characterization, and disease progression in patients with impaired renal function.
Introduction
Ferumoxytol clears out through the liver instead of the kidney, and thus it is considered as a safe contrast agent for chronic kidney disease (CKD) patients with low estimated glomerular filtration rates (eGFR) who are contra-indicated for gadolinium enhanced MRA1,2. The long blood pool half-life of ferumoxytol expands the acquisition time window and enables high-resolution steady-state imaging with the application of free-breathing technique3.In 2021, Timms et al.3 demonstrated that Quantitative Ultrashort Time-to-Echo Contrast-Enhanced (QUTE-CE) MRA, which combines Ultrashort Time-to-Echo (UTE) sequences with ferumoxytol is feasible for human kidney vascular imaging. The main advantages of the QUTE-CE MRA include a) high intraluminal contrast without background tissue enhancement, b) minimum flow and susceptibility effects, resulting in homogenous intraluminal signal as a function of the contrast concentration4.
Multi-parametric MRI has been an emerging area that utilizes different MRI sequences to provide quantitative information such as diffusion, perfusion, tissue oxygenation for characterizing renal masses. While non-contrast imaging techniques have been shown to provide differentiation between renal cell carcinoma (RCC) subtypes and grades, they do not achieve the sensitivity of contrast-enhanced imaging methods5,6.
Currently, there is limited publication on renal mass imaging using ferumoxytol-enhanced UTE MRI and the qualitative assessment on the contrast enhancement may bring uncertainty to renal mass characterization7–10. The purpose of this study is to demonstrate our approach to quantitatively assessing the signal enhancement in renal masses of QUTE-CE MRAs and share our experience in first-pass imaging with ferumoxytol in the abdominal region.
Methods
Subjects previously diagnosed with CKD were recruited from Massachusetts General Hospital and scanned at the Martinos Center for Biomedical Imaging. Five subjects were referred to this study due to contra-indications for Gd injection and received first-pass ferumoxytol infusion at the dose of 4 mg/kg body weight. All procedures were conducted in accordance with the Partners IRB. Scans were performed using the 3T scanner with a prototype 3D stack of spirals UTE VIBE sequence. QUTE-CE Images were acquired in two types: 1) series of breath-hold during a first-pass procedure, at resolution 2.14×2.14×2.5mm3, 2) respiratory-gated free-breathing in the delayed phase, at resolution 1.5×1.5×1.5mm3, both with TE=0.05 ms, TR=2.91 ms, FA=13°. In addition, T1w Dixon and T2 HASTE images were acquired for volumetric measurement.The images were pre-processed with N4ITK bias field correction and the kidneys, masses, and abdominal vessels were manually cropped from the free-breathing QUTE-CE images11. The blood volume (BV) map was calculated by scaling the free-breathing QUTE-CE post- and pre- subtraction image from 0 to 1.
Results
Positive contrast images capturing the vascular networks of the kidneys were produced with QUTE-CE MRA (Figure 1). Good first-pass images were obtained, signal intensity in IVC, aorta and kidney parenchyma was plotted throughout the first-pass procedure (Figure 2).Case1, 61 year-old female, CKD stage 3, eGFR 30, underwent QUTE-CE MRA to characterize the renal mass at the location of previous partial nephrectomy. No abnormal areas of increased signal after ferumoxytol were observed to suggest enhancement (Figure 3). Blood volume (BV) of the mass is calculated as (-6±7)%, while BV of the cortex and medulla are (17±6)% and (21±5)%, indicating that the mass is not vascularized.
Case 2, 74 year-old male, CKD stage 4, eGFR 29, underwent QUTE-CE MRA to assess one complex renal mass in the left lower pole. No visible vessels were found feeding into the renal mass. However, the renal mass appears highly heterogeneous in both pre-contrast and post-contrast QUTE-CE scans. BV in entire renal mass is (17±8)%, with two sub-regions of the renal mass (32±10)% and (30±7)%, exceeding the contra-lateral BV (14±7)% and ipsi-lateral cortex BV (21±4)%. It suggests that there exists micro-vessel structure in the sub-regions of the complex renal mass.
Discussion
QUTE-CE MRA provides strong positive contrast which remains strictly intravascular in healthy blood vessels, with very homogenous signal intensity that is a function of contrast concentration. Therefore, the vascular rendering can be easily obtained from the high vessel-tissue CNR images without complex image processing procedures. The high-resolution vascular mapping was deemed of high quality and potential use for the surgical planning. The first-pass QUTE-CE provides the capability to capture the dynamic contrast enhancement of the blood vessels as the contrast agent distributed throughout the blood, which can be used to provide seeds for artery and vein separation in the high spatial resolution images.The use of UTE sequences provides homogenous intraluminal signal intensity which is a function of contrast concentration. Here we described an approach to quantitatively measuring the enhancement characteristics of renal masses on QUTE-CE MRAs. The BV map derived here provides a quantitative measurement of the distribution of micro-vessel density across the renal mass and other region-of-interest, even below the limits of vessels which can be resolved at the resolution.
Conclusion
The QUTE-CE MRA technique provides strong positive contrast vascular images superior to Gd CEMRA and is a useful tool in renal mass assessment. The vascularity of the renal mass can be examined by analyzing the contrast enhancement characteristics, calculating the BV and comparing to other anatomical regions. This will potentially benefit surgical planning, renal mass characterization, and disease progression in patients with impaired renal function.Acknowledgements
This work was supported by National Institutes of Health (Grant numbers 1R21DK118449-01) awarded to Dr. Sridhar.References
1. Toth GB, Varallyay CG, Horvath A, et al. Current and potential imaging applications of ferumoxytol for magnetic resonance imaging. Kidney Int. 2017;92(1):47-66. doi:10.1016/j.kint.2016.12.0372. Bashir MR, Bhatti L, Marin D, Nelson RC. Emerging applications for ferumoxytol as a contrast agent in MRI. J Magn Reson Imaging. 2015;41(4):884-898. doi:10.1002/jmri.24691
3. Timms L, Zhou T, Lyu Y, et al. Ferumoxytol-enhanced ultrashort TE MRA and quantitative morphometry of the human kidney vasculature. Abdom Radiol. 2021;46(7):3288-3300. doi:10.1007/s00261-021-02984-2
4. Gharagouzloo CA, Timms L, Qiao J, et al. Quantitative vascular neuroimaging of the rat brain using superparamagnetic nanoparticles: New insights on vascular organization and brain function. NeuroImage. 2017;163(April):24-33. doi:10.1016/j.neuroimage.2017.09.003
5. Ramamurthy NK, Moosavi B, McInnes MDF, Flood TA, Schieda N. Multiparametric MRI of solid renal masses: pearls and pitfalls. Clin Radiol. 2015;70(3):304-316. doi:10.1016/j.crad.2014.10.006
6. Cox EF, Buchanan CE, Bradley CR, et al. Multiparametric renal magnetic resonance imaging: Validation, interventions, and alterations in chronic kidney disease. Front Physiol. 2017;8(SEP):1-15. doi:10.3389/fphys.2017.00696
7. Hedgire SS, McDermott S, Wojtkiewicz GR, Abtahi SM, Harisinghani M, Gaglia JL. Evaluation of renal quantitative T2* changes on MRI following administration of ferumoxytol as a T2* contrast agent. Int J Nanomedicine. 2014;9(1):2101-2107. doi:10.2147/IJN.S61460
8. Kordbacheh H, Baliyan V, Parakh A, Wojtkiewicz GR, Hedgire S, Harisinghani MG. Pictorial review on abdominal applications of ferumoxytol in MR imaging. Abdom Radiol. 2019;44(10):3273-3284. doi:10.1007/s00261-019-02163-4
9. Shahrouki P, Felker ER, Raman SS, Jeong WK, Lu DS, Finn JP. Steady-state ferumoxytol-enhanced MRI: early observations in benign abdominal organ masses and clinical implications. Abdom Radiol. Published online October 24, 2021. doi:10.1007/s00261-021-03271-w
10. Knobloch G, Colgan T, Schiebler ML, et al. Comparison of gadolinium-enhanced and ferumoxytol-enhanced conventional and UTE-MRA for the depiction of the pulmonary vasculature. Magn Reson Med. 2019;82(5):1660-1670. doi:10.1002/mrm.27853
11. Tustison NJ, Avants BB, Cook PA, Gee JC. N4ITK: Improved N3 bias correction with robust B-spline approximation. 2010;29(6):708-711. doi:10.1109/isbi.2010.5490078
Figures
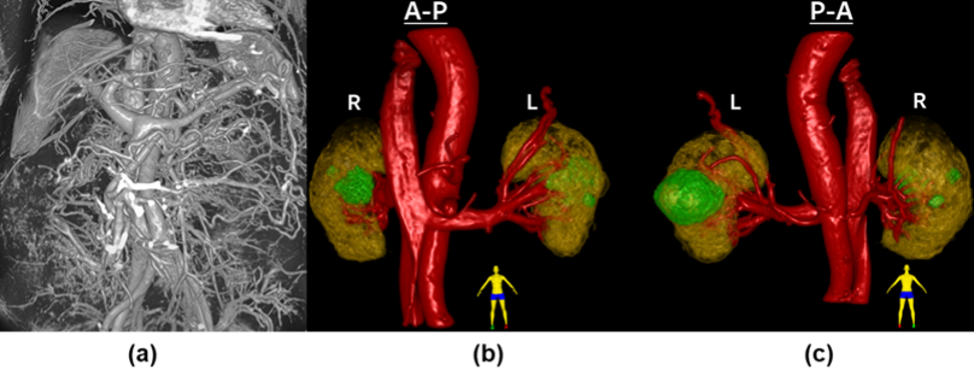
Figure 1. (a) 3D renderings of intensity data capturing vasculature of the abdominal cavity (b) Anterior to posterior view, (c) posterior to anterior view of 3D rendering of the cropped post-contrast high-resolution (1.5mm isotropic) QUTE-CE image of both kidneys (yellow), large abdominal vessels and renal vessels (red), and renal cysts (green).
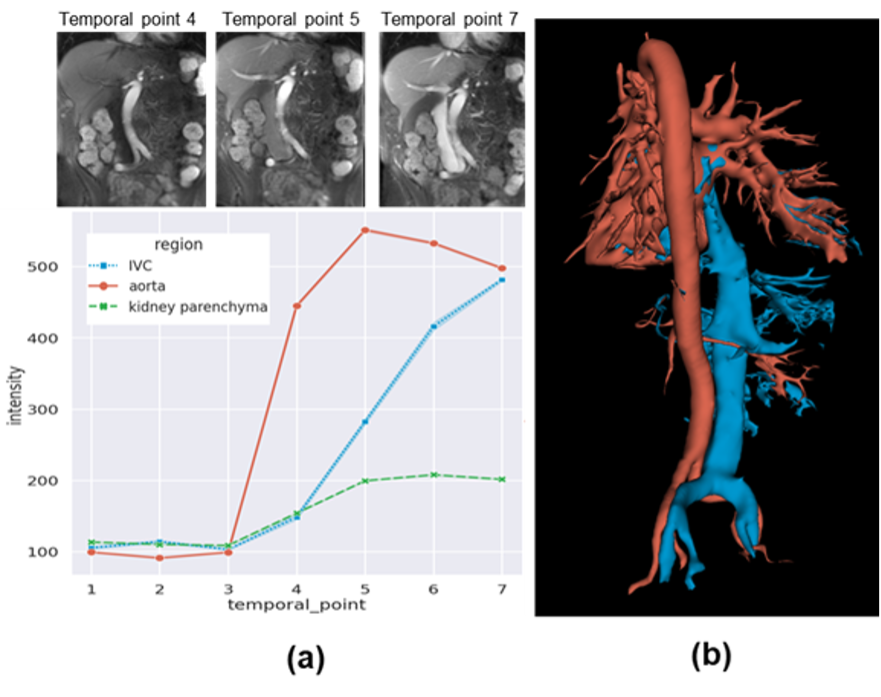
Figure 2. Artery-vein separation using dynamic contrast. (a) Top: coronal slices of dynamic QUTE-CE scans showing the varying arterial and venous enhancement, Bottom: signal intensity vs. time curve. (b) Example of artery and vein segmentation using the subtraction of dynamic scans.
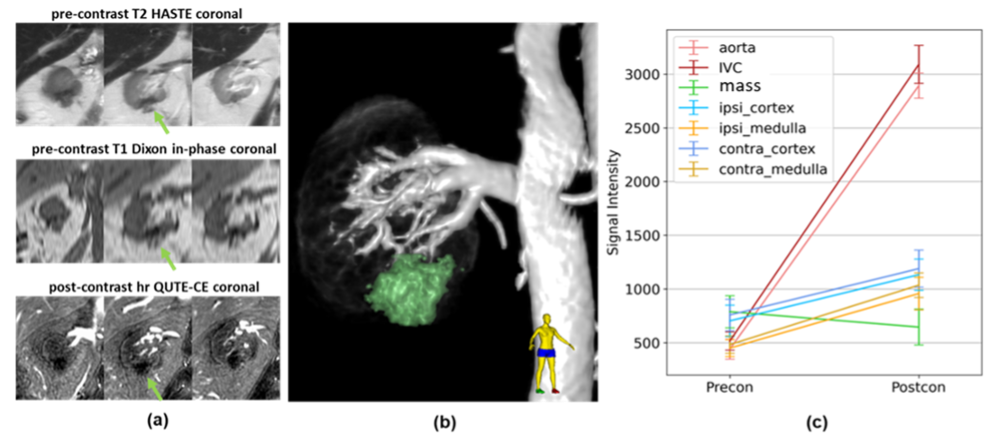
Figure 3. Case 1. (a) Anterior to posterior (left to right) coronal slices, with mass shown with green arrow. (b) 3D rendering of the cropped post-contrast high-resolution (1.5mm isotropic) QUTE-CE image of the right kidney, associated vessels and the renal mass (green). (c) QUTE-CE signal intensity in relevant ROIs. No visible vessel was observed in the vascular rendering (b) and the QUTE-CE signal intensity shows no contrast enhancement in the mass.
DOI: https://doi.org/10.58530/2022/4009