4007
Early treatment re-direction based on functional tumor volume at 3 and 6-week MRI for breast cancer patients undergoing neoadjuvant chemotherapy1Department of Radiology & Biomedical Imaging, University of California, San Francisco, San Francisco, CA, United States, 2I-SPY 2 Advocacy Group, San Francisco, CA, United States, 3MD Anderson Cancer Center, Houston, TX, United States, 4University of Pennsylvania, Philadelphia, PA, United States, 5Department of Surgery, University of California, San Francisco, San Francisco, CA, United States, 6Quantum Leap Healthcare Collaborative, San Francisco, CA, United States
Synopsis
In the I-SPY2 breast cancer trial, functional tumor volume (FTV) derived from dynamic contrast-enhanced MRI is used as a longitudinal measure of response to adjust patient randomization and evaluate drug efficacy. I-SPY2 is introducing a treatment “escalation” option, giving patients the opportunity to re-direct to potentially more effective treatment based on early indication of inferior response by MRI. We retrospectively investigated the ability of FTV reduction to predict inferior outcome. Combined criteria using FTV reduction at 3 and 6 weeks of treatment showed high PPV and high sensitivity in early detection of non-responders.
Introduction
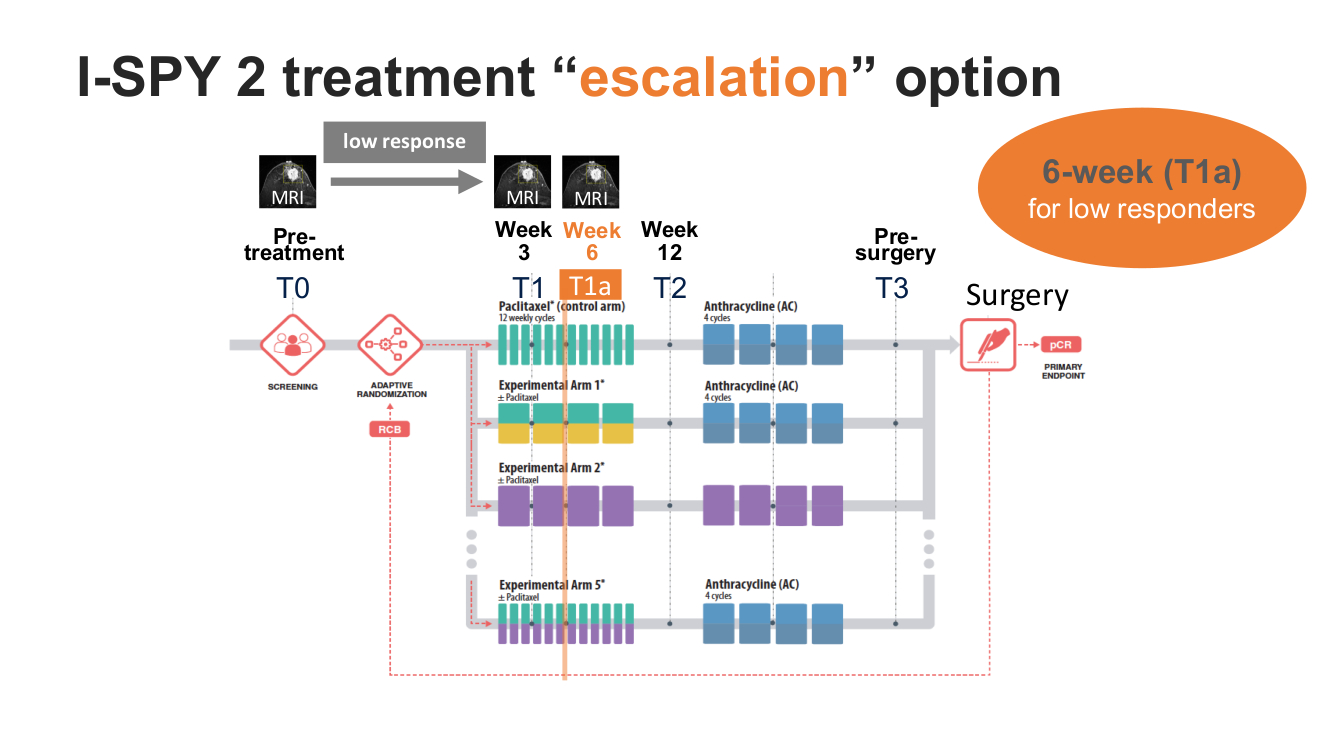
In the I-SPY 2 neoadjuvant breast cancer trial, patients are treated with standard neoadjuvant chemotherapy (NAC) with or without the addition of experimental agents. To accelerate personalized medicine for breast cancer in neoadjuvant setting, I-SPY 2 has introduced treatment re-direction options i.e. “escalation” or “de-escalation”1. The treatment “escalation” option will give patients the opportunity to re-direct to potentially more effective treatment if biomarkers before and during NAC predict an inferior outcome (non-responders). To safely offer treatment escalation and de-escalation options, biomarkers that can reliably predict the eventual outcome are crucial. Clinical, laboratory, and imaging biomarkers are being investigated for this purpose.Functional tumor volume (FTV) is a quantitative measure of tumor burden derived from dynamic contrast-enhanced (DCE) breast MRI2–4. In I-SPY 2, FTV has been used to adjust patient randomization ratios and to evaluate drug efficacy. FTV is measured four times during NAC, at pre-treatment (T0), 3 weeks (T1), 12 weeks (T2), and pre-surgery (T3) time points (Figure 1). In I-SPY 2 protocol Amendment 18 activated in December 2017, an optional MRI at 6 weeks (T1a) recommended at clinician’s discretion was added for patients with low response. Based on preliminary acquired data, the requirement for 6-week MRI for patients with insufficient 3-week MRI response was recently added to I-SPY 2 as protocol Amendment 27.
This study aimed to investigate the ability of combined 3- and 6-week FTV-based criteria to detect non-responders as candidates for the treatment escalation option.
Methods
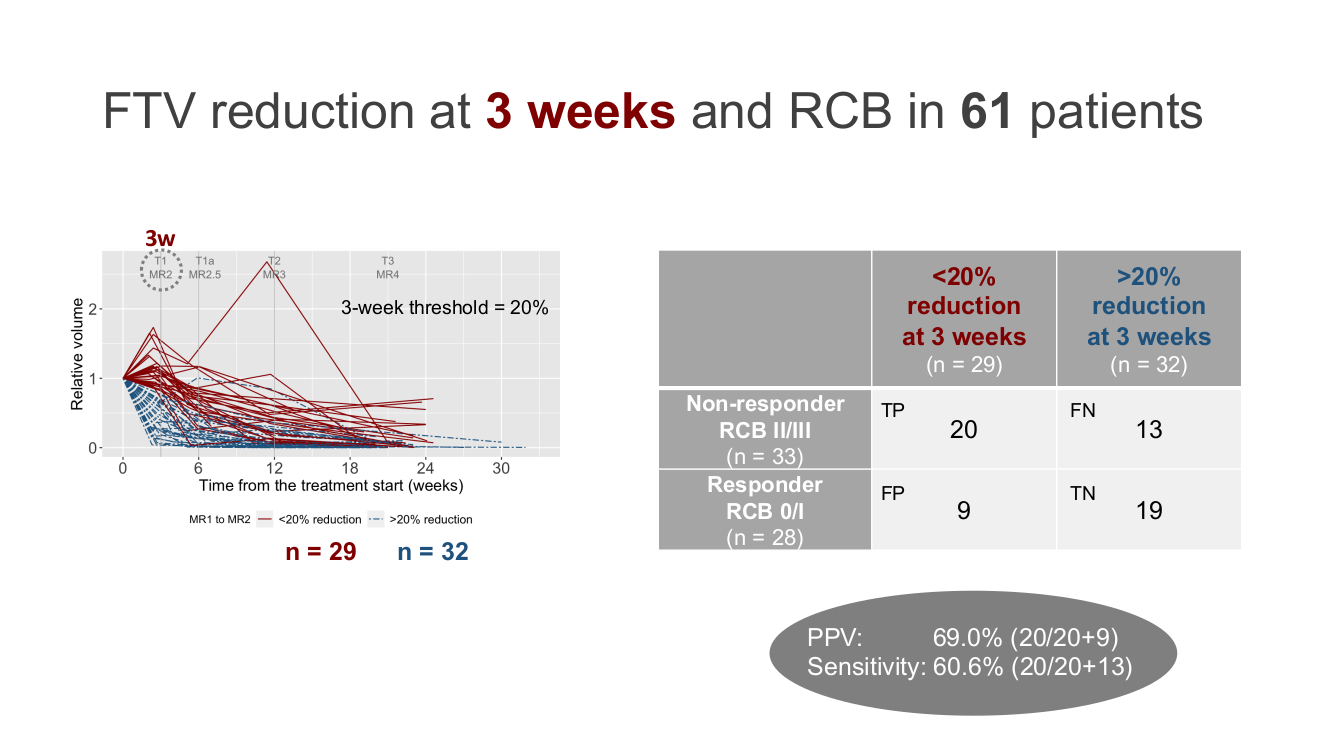
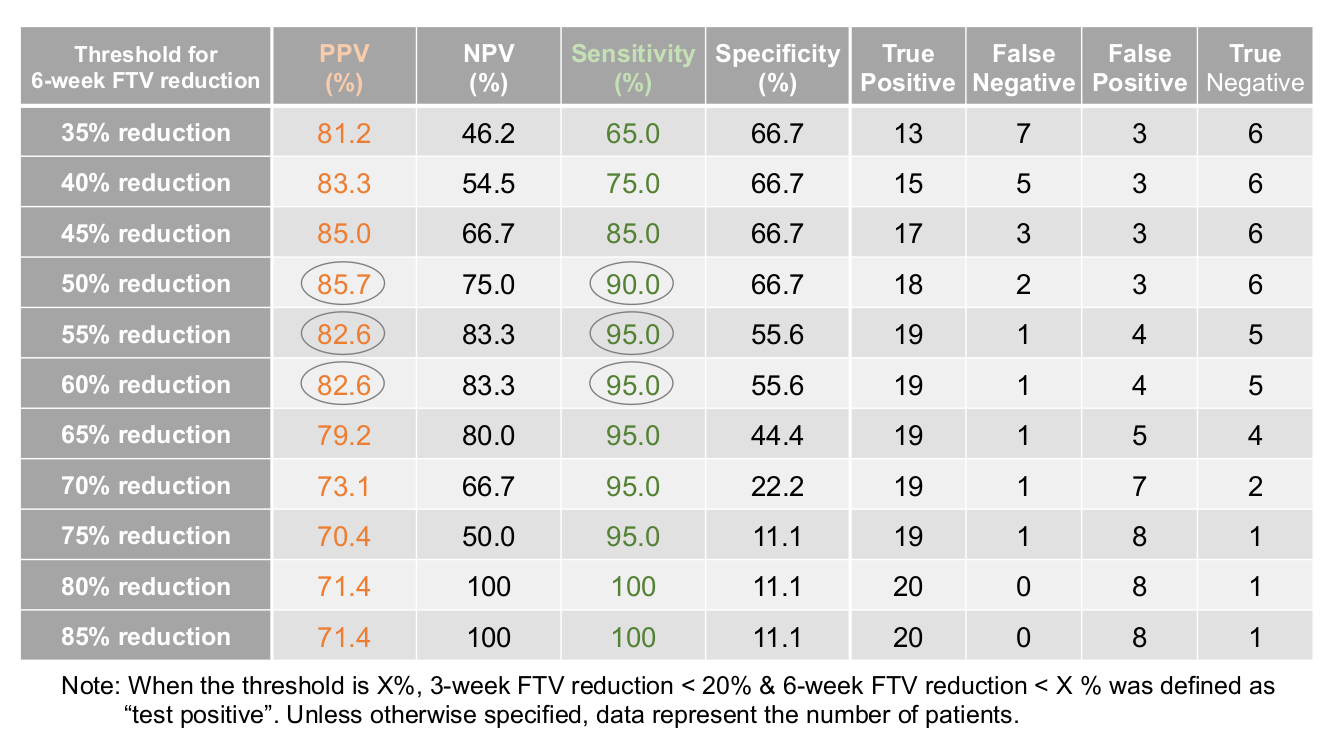
We included 104 patients who underwent 6-week MRI between Jan 2018 and Mar 2021. Standardized DCE MRI protocol in I-SPY 2 is as follows: acquisition duration 80–100 s; early phase timing 120–150 s post-contrast injection; FOV 260–360 mm; in-plane resolution ≤1.4 mm; slice thickness ≤2.5 mm. Using in-house software developed in IDL (L3Harris Geospatial, Boulder, CO), FTV was calculated by summing all voxels with early percent enhancement (PE, ~150 s post-contrast injection) above 70% and signal enhancement ratio above zero within a manually delineated 3-dimensional bounding box as described in the literature4.Percent FTV reduction from baseline to 3 weeks [100*(T0-T1)/T0] and 6 weeks [100*(T0-T1a)/T0] were calculated. In patients with <20 % FTV reduction at 3 weeks, the predictive ability of combined 3- and 6-week FTV-based criteria were tested. Patients with 3-week FTV reduction <20% & 6-week FTV reduction <X% were evaluated as “test positive” and 3-week FTV reduction < 20% & 6-week FTV reduction > X% as “test negative”, where variable X is a whole number from 0 to 100. Treatment outcome in I-SPY 2 is assessed using pathologic complete response (pCR) and residual cancer burden (RCB) on surgical pathology after NAC. RCB is an established surrogate for survival outcome5. RCB 0 is equivalent to pCR, and RCB I, RCB II, and RCB III reflect increasing residual tumor burden, distinguishing groups with different outcomes. Patients with RCB 0/I were considered responders and those with RCB II/III were considered non-responders. Ability of FTV reduction to detect non-responders was assessed by positive predictive value (PPV) and sensitivity, where non-responders were defined as “positive”.
Results
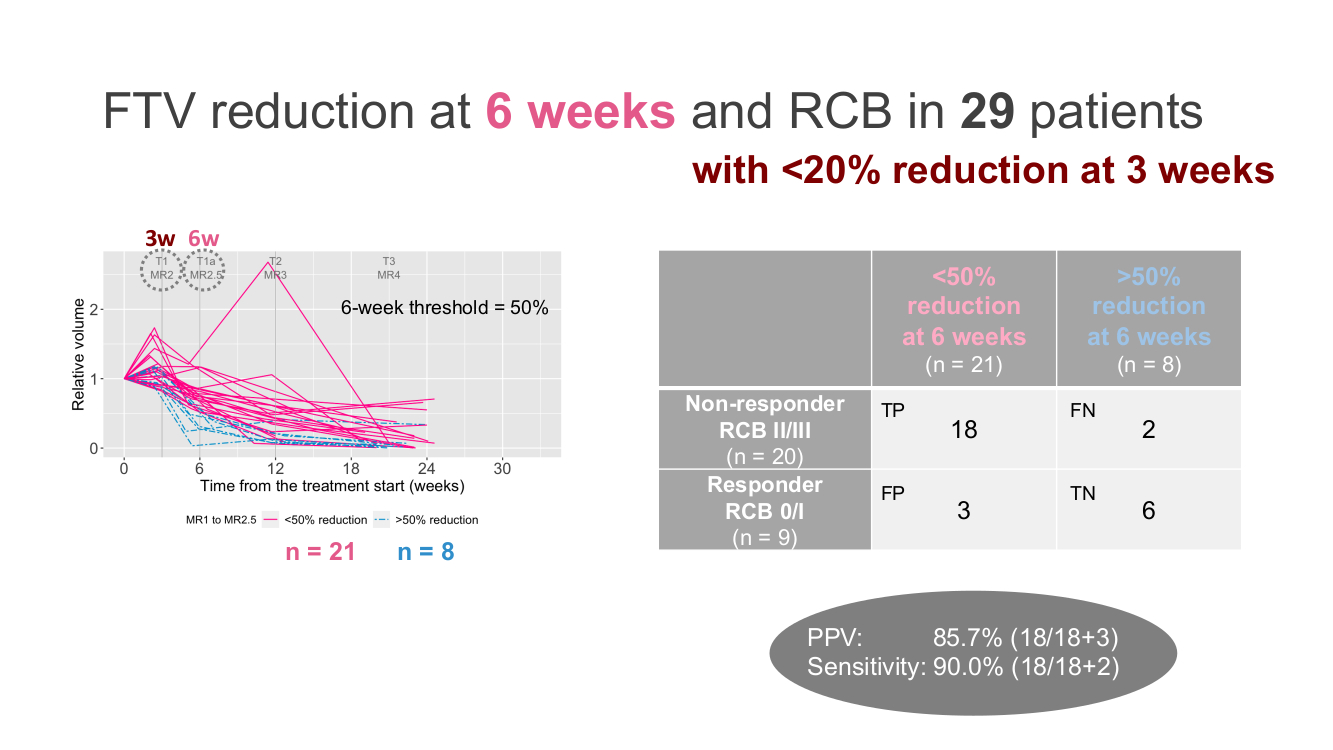
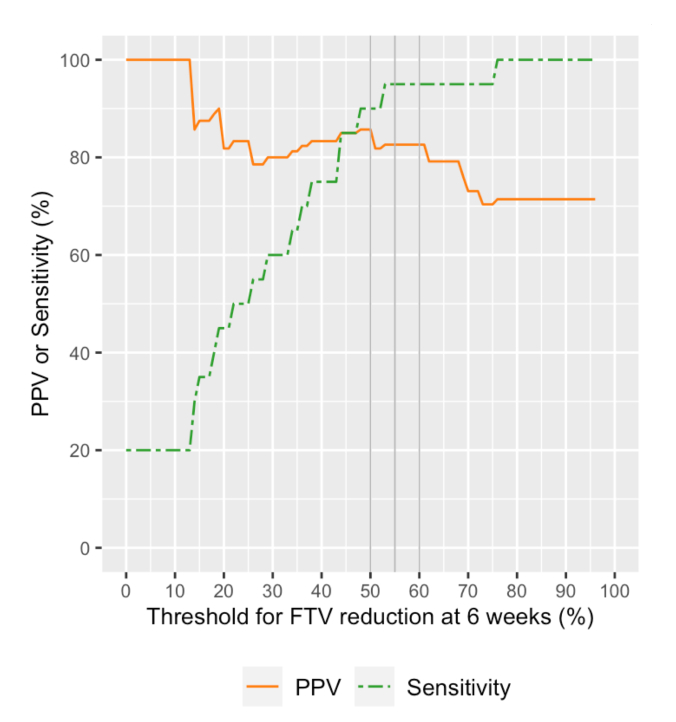
Of the 104 patients, 61 patients (35 HR+HER2–;21 HR–HER2–; 5 HR+HER2+) who had both RCB and analyzable FTVs were included. Patients missing RCB or FTV data (n = 6) or not having completed the assigned therapy (n = 37) were excluded.In the 61 patients, 3-week FTV reduction was <20% for 29 patients (RCB II/III, n = 20; RCB 0/I, n = 9) and >20% for 32 patients (RCBII/III, n = 13; RCB 0/I, n = 19) (Figure 2). The 3-week only criteria showed PPV of 69.0% and sensitivity of 60.6%. The 29 patients with 3-week FTV reduction of <20% were dichotomized to either “test positive” or “test negative” based on various thresholds for 6-week FTV reduction. Figure 3 shows the representative results for the threshold of 50%, which showed 6-week FTV reduction of <50% for 21 patients (RCB II/III, n = 18; RCB 0/I, n = 3) and >50% for 8 patients (RCBII/III, n = 2; RCB 0/I, n = 6). Figure 4 and Table 1 show how the performance of the combined criteria changes depending on the 6-week FTV reduction threshold. When the threshold was set as 48–50%, the combined criteria detected non-responders with PPV of 85.7% and sensitivity of 90.0%. When the threshold was set as 53–61%, the combined criteria detected non-responders with PPV of 82.6% and sensitivity of 95.0%.
Discussion & Conclusion
In this analysis of patients previously enrolled in I-SPY 2, combined criteria using FTV reduction at 3 and 6 weeks of NAC showed high PPV and high sensitivity in early detection of non-responders as candidates for the treatment escalation option. Further refinement of the strategy will be tested in a prospective cohort in the on-going I-SPY 2 to determine if the combined criteria might be used as part of the clinical algorithm to tailor individual treatment strategies.Acknowledgements
This research was supported by NIH grants U01 CA151235, R01 CA132870, P01 CA210961.
We would like to thank all patients who participated in the I-SPY 2 TRIAL, working group chairs, investigators, and study coordinators from all participant sites for their contributions.
References
1 Esserman LJ. Personalization of treatment is the way forward in care and trials. Clin Cancer Res 2020; published online April 7. DOI:10.1158/1078-0432.CCR-20-0604.
2 Hylton NM, Blume JD, Bernreuter WK, et al. Locally advanced breast cancer: MR imaging for prediction of response to neoadjuvant chemotherapy--results from ACRIN 6657/I-SPY TRIAL. Radiology 2012; 263: 663–72.
3 Hylton NM, Gatsonis CA, Rosen MA, et al. Neoadjuvant Chemotherapy for Breast Cancer: Functional Tumor Volume by MR Imaging Predicts Recurrence-free Survival-Results from the ACRIN 6657/CALGB 150007 I-SPY 1 TRIAL. Radiology 2016; 279: 44–55.
4 Hylton NM. Vascularity assessment of breast lesions with gadolinium-enhanced MR imaging. Magn Reson Imaging Clin N Am 1999; 7: 411–20, x.
5 Symmans WF, Peintinger F, Hatzis C, et al. Measurement of residual breast cancer burden to predict survival after neoadjuvant chemotherapy. J Clin Oncol 2007; 25: 4414–22.
Figures