4006
Observations on Rapid Dynamic Contrast Enhanced MRI in Prostate Cancer1Department of Clinical, Oral and Biotechnology Sciences, University "G. d'Annunzio" Chieti-Pescara, Chieti-Pescara, Italy, 2Magnetic Resonance Service, Ospedale di Popoli, AUSL, Pescara, Italy, 3UOC of Urology, Ospedale di Pescara, AUSL, Pescara, Italy, 4Faculty of Medicine, University "G. d'Annunzio“, Chieti-Pescara, Chieti-Pescara, Italy, 5Radiology Department, Centro Morrone, Caserta, Italy, 6Ospedale di Chieti, Chieti, Italy, 7QMRI Tech, Pescara, Italy
Synopsis
Prostate dynamic contrast-enhanced (DCE) MRI is often criticized for its weaknesses in terms of discriminating transition zone lesions and tumors in general. Using high-temporal resolution DCE MRI in patients who went on to prostatectomy, we evaluated time to peak (TTP), as well as the enhancement rate factor, and initial enhancement slope of a simple empirical mathematical model of early contrast uptake. Differences between tumors and surrounding healthy tissues were seen for the mean values of all three parameters. The AUCs were good (>0.8 in all cases except for TTP between tumor and transition zone) but case numbers limited.
Introduction
The two compartment Toft’s model may not be appropriate for describing contrast agent dynamics in healthy and diseased prostate tissues.1,2 The possibility that high temporal resolution dynamic contrast enhanced (DCE) MRI together with an empirical mathematical model (EMM) may be informative regarding the diagnosis of prostate cancer has been raised by Chatterjee et al.3 We have applied an EMM to examine the behavior of contrast enhancement of apparently healthy and neoplastic prostate tissues in high temporal resolution (< 2s/frame) DCE-MRI.Methods
In a cohort of 23 males with suspected prostate cancer, high temporal resolution DCE MRI (temporal resolution 1.3s, repeated 3:15 m:ss) was performed as part of a PI-RADS compliant multiparametric MRI examination of the prostate.4 Other parameters of the 3D gradient echo DCE acquisition were: FOV: 250x250x60mm, Acq. Res: 3.5x3.5x4mm, Acceleration: 3.5x SENSE, TR/TE/Flip Angle 3.5ms/1.6ms/10°, on a 1.5T MR scanner (Achieva, Philips Medical Systems, Best, The Netherlands) during injection of contrast agent (0.2ml/kg at 3ml/s; Dotarem, Guerbet, Milan, Italy).The first two timepoints of the DCE data were eliminated, and the final frame prior to arrival of contrast in the iliac arteries (end baseline) identified, and intensities normalized to the mean baseline signal. The EMM expression: C(t)=A(1−e−α(t-t0)) was then fit to the timeseries on a voxel-by-voxel basis to determine: -α (enhancement rate factor), initial enhancement slope and arrival time (t0, not analyzed further because the tightly packed values overlapped extensively between tissue types). The time to peak (TTP) was also calculated
The DCE and b=0 DWI images were co-registered (3D Slicer) to the T2-weighted images, and the transformations applied to the high b-value DWI images, ADC maps and the maps derived from the DCE timeseries.
Regions of interest (ROIs) covering the index lesion on the all T2 images (minimum 2) where it was visible were defined manually. On the same slices, ROIs of healthy tissue encompassing the peripheral, transition and/or central zone corresponding to the location of the tumor (possibly involving more than one zone).
The ROIs were applied to the DCE maps for value extraction. Descriptive statistics were calculated for each tissue, and comparisons performed between tissues using one-way ANOVA for the presence of differences in minimum, mean or maximum values between tissues. Further, the ability to differentiate tumor from healthy tissue was assessed by ROC analysis of the mean ROI values.
Results
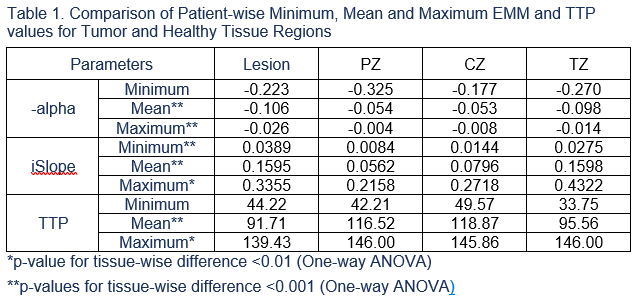
Two patients had lesions involving both PZ and CZ. These two ROIs were replicated as distinct lesions for each zone, leading to 7 CZ, 14 PZ and 4 TZ lesions in our cohort.Significant differences between tissues were seen for the mean and maximum values of -α, iSlope, and TTP, while a significant difference in the minimum values was only seen for iSlope. Specifically, lesions showed lower values for -α and TTP than all other tissues, and a higher iSlope than PZ and CZ. For all three parameters, the values seen in TZ were closest to those seen in the lesions.
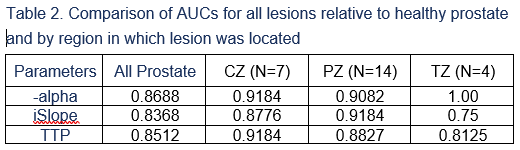
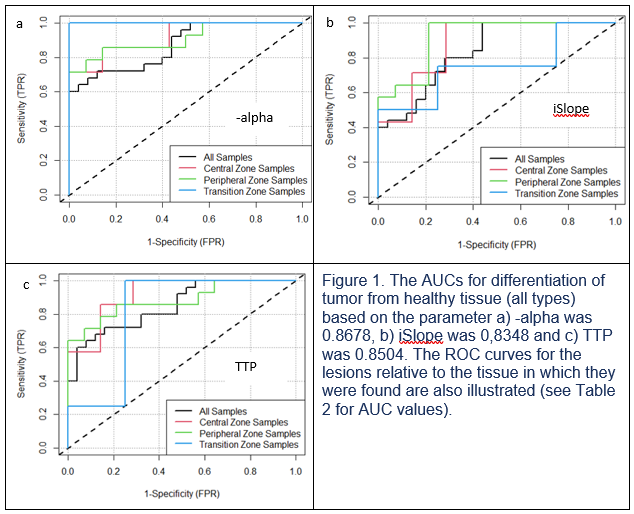
The AUCs for differentiation of tumor from healthy tissue were: 0.8678, 0,8348 and 0.8504 for the mean values of -α, iSlope and TTP respectively. Lower values of TTP and -α, and higher values of iSlope were predictive of malignancy. AUC values for differentiating tumor from the tissue in which the lesion was located are summarized in Table 2, but we particularly small numbers of samples were involved for CZ (7 lesions) and TZ (4 lesions).
Discussion
In this small study, we found significant differences between tumors and healthy tissues of the prostate as a whole for the mean EMM parameters -α, iSlope and TTP. Moreover, relative to literature reports, our measurements provided generally higher AUCs for the ROC curves of differentiating tumor from healthy tissue both relative to the prostate in general, and relative to the specific zone(s) in which the tumor was found. The small numbers of cases for CZ and TZ however, warn against giving too much weight to the relevance of this last observation.Like Chatterjee et al.,3 this single center study made use of a high-temporal resolution DCE MRI sequence that differs somewhat from the sequences typically used in practice, and may not generalize to other DCE acquisitions. The simpler EMM model used herein may, in part, explain the difference in performance relative to their study.
A limitation of the present study may be the possibility of bias introduced during the manual definition of the ROIs. Further, despite registration, due to compromises on spatial resolution, the relatively small ROIs involved may be subject to partial volume effects due to small errors in operator-dependent delineation. Adoption of an automated segmentation tool that relies on T2 and possible DWI data is under investigation and we hope will be available for use in a larger cohort of subjects to reduce the risk of bias.
Conclusion
A simple EMM of contrast enhancement provided relatively high levels of performance in the discrimination of prostate tumors from healthy tumor both when comparing to the whole prostate and the specific zones in which the tumors were found.Acknowledgements
No acknowledgement found.References
1. Noworolski SM, Vigneron DB, Chen AP, Kurhanewicz J. Combined Dynamic Contrast-Enhanced MRI and MR Diffusion Imaging to Distinguish Between Glandular and Stromal Prostatic Tissues. Magn Reson Imaging. 2008;26(8):1071-1080.
2. Mustafi D, Gleber S-C, Ward J, et al. IV Administered Gadodiamide Enters the Lumen of the Prostatic Glands: X-Ray Fluorescence Microscopy Examination of a Mouse Model. Am J Roentgenol. 2015;205(3):W313-W319.
3. Chatterjee A, He D, Fan X, et al. Performance of Ultrafast DCE-MRI for Diagnosis of Prostate Cancer. Acad Radiol. 2018;25(3):349-358.
4. Turkbey B, Rosenkrantz AB, Haider MA, et al. Prostate Imaging Reporting and Data System Version 2.1: 2019 Update of Prostate Imaging Reporting and Data System Version 2, Eur Urol. 2019;76(3):340–351.
Figures