4001
Standardization of breast dynamic contrast-enhanced MRI signal for assessment of background parenchymal enhancement rate1Department of Radiology, The University of Chicago, Chicago, IL, United States, 2Department of Radiology, Shiga University of Medical Science, Otsu, Japan
Synopsis
Breast DCEMRI signal is standardized for variable imaging protocols and the linear rate of background parenchymal enhancement (BPE) is calculated, to quantitatively and objectively describe changes in BPE rates following preventative tamoxifen treatment. This is in contrast with the current practice of using 4 subjective categories to describe BPE. Decreased BPE rates post-treatment agree with earlier results showing that BPE, like breast density, correlates with breast cancer risk. Standardization for imaging parameters and contrast agent relaxivity increases the observed effect size, pointing to increased sensitivity to treatment-induced changes and the potential as a tool for individual breast cancer risk management.
INTRODUCTION
Earlier literature established a correlation between BPE observed on contrast-enhanced breast MRI exams and breast cancer risk, similar to the correlation observed between mammographically determined breast density and breast cancer risk.1-3 Other studies showed that BPE is reduced after tamoxifen or aromatase inhibitor therapy and could therefore serve as a marker of preventative treatment response.4-6 However, earlier evaluations categorized BPE into 4 categorical groups by visual observation, limiting sensitivity to often small treatment-induced changes. Here, we introduce a method to standardize quantification of BPE on DCEMRI by (1) correcting for differences in acquisition parameters and contrast agent relaxivity via signal standardization and (2) quantifying the rate of enhancement, rather than the enhancement at a specific timepoint. We evaluate this method via a quantitative analysis of BPE prior to and following tamoxifen treatment that demonstrates increased sensitivity to small changes.METHODS
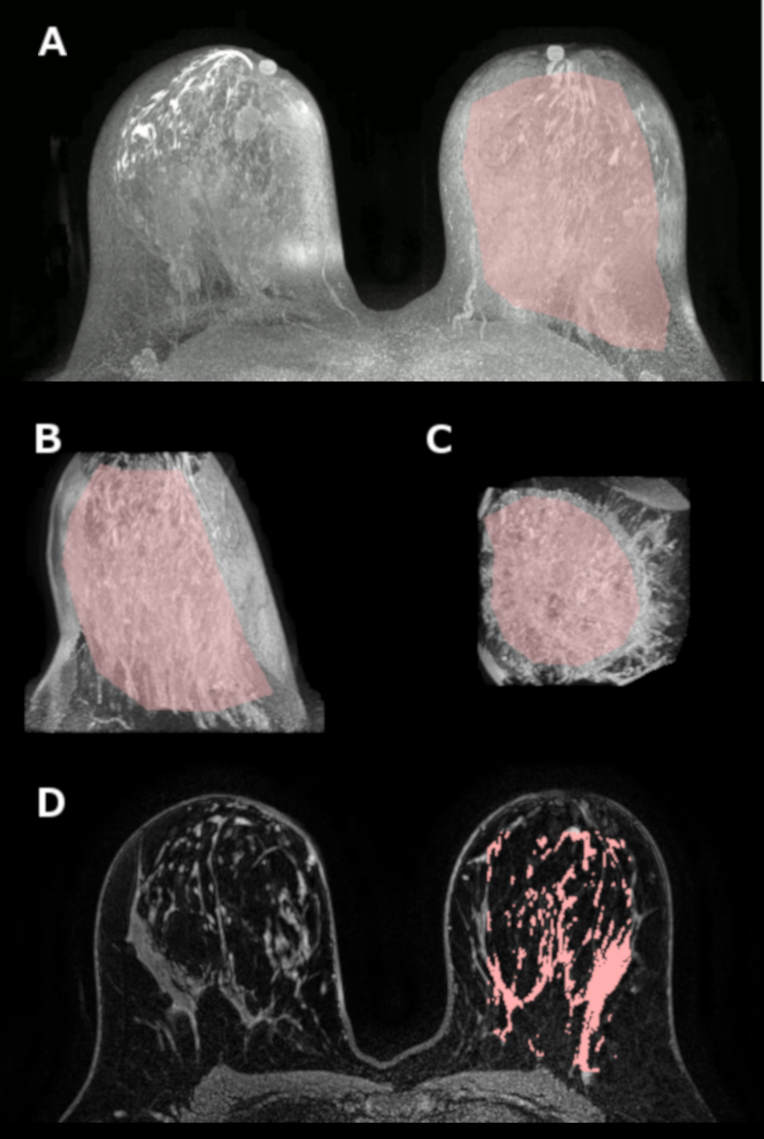
On a retrospective database search, 21 patients (ages 27-63, median 46 years) were identified who have undergone two MRI exams, prior to and following tamoxifen treatment, with at least one uninvolved breast. 1.5T Siemens Avanto and 1.5T and 3T Philips Achieva scanners were used. Seven patients were excluded for technical reasons, such as missing DICOM tags. Dynamic contrast-enhanced MRI (DCEMRI) sequences were included in all exams, with time resolution of 55-78 s and following the contrast uptake and washout for 4-11 minutes (TR = 4.4-7.9 ms, TE = 2.1-4.2 ms, flip angle (FA) = 10-30°). Gadolinium-based contrast agent (gadodiamide, gadobenate dimeglumine, or gadobutrol) was administered at the standard dose of 0.1 mmol/kg at the rate of 2 ml/s and followed by a 20 ml saline flush.A mask of breast tissue was created from the first DCEMRI acquisition, and then eroded in two orientations to exclude the skin. Pre-contrast images, multiplied by the eroded mask, were projected in the axial and sagittal planes. The central breast region of interest was drawn manually in two projections, excluding skin and nipple tissue, chest wall muscle, and axillae. Breasts where lesions were present were excluded. In the remaining central breast tissue, the fuzzy C-means algorithm was used to segment breast parenchyma. This process is illustrated in Figure 1.
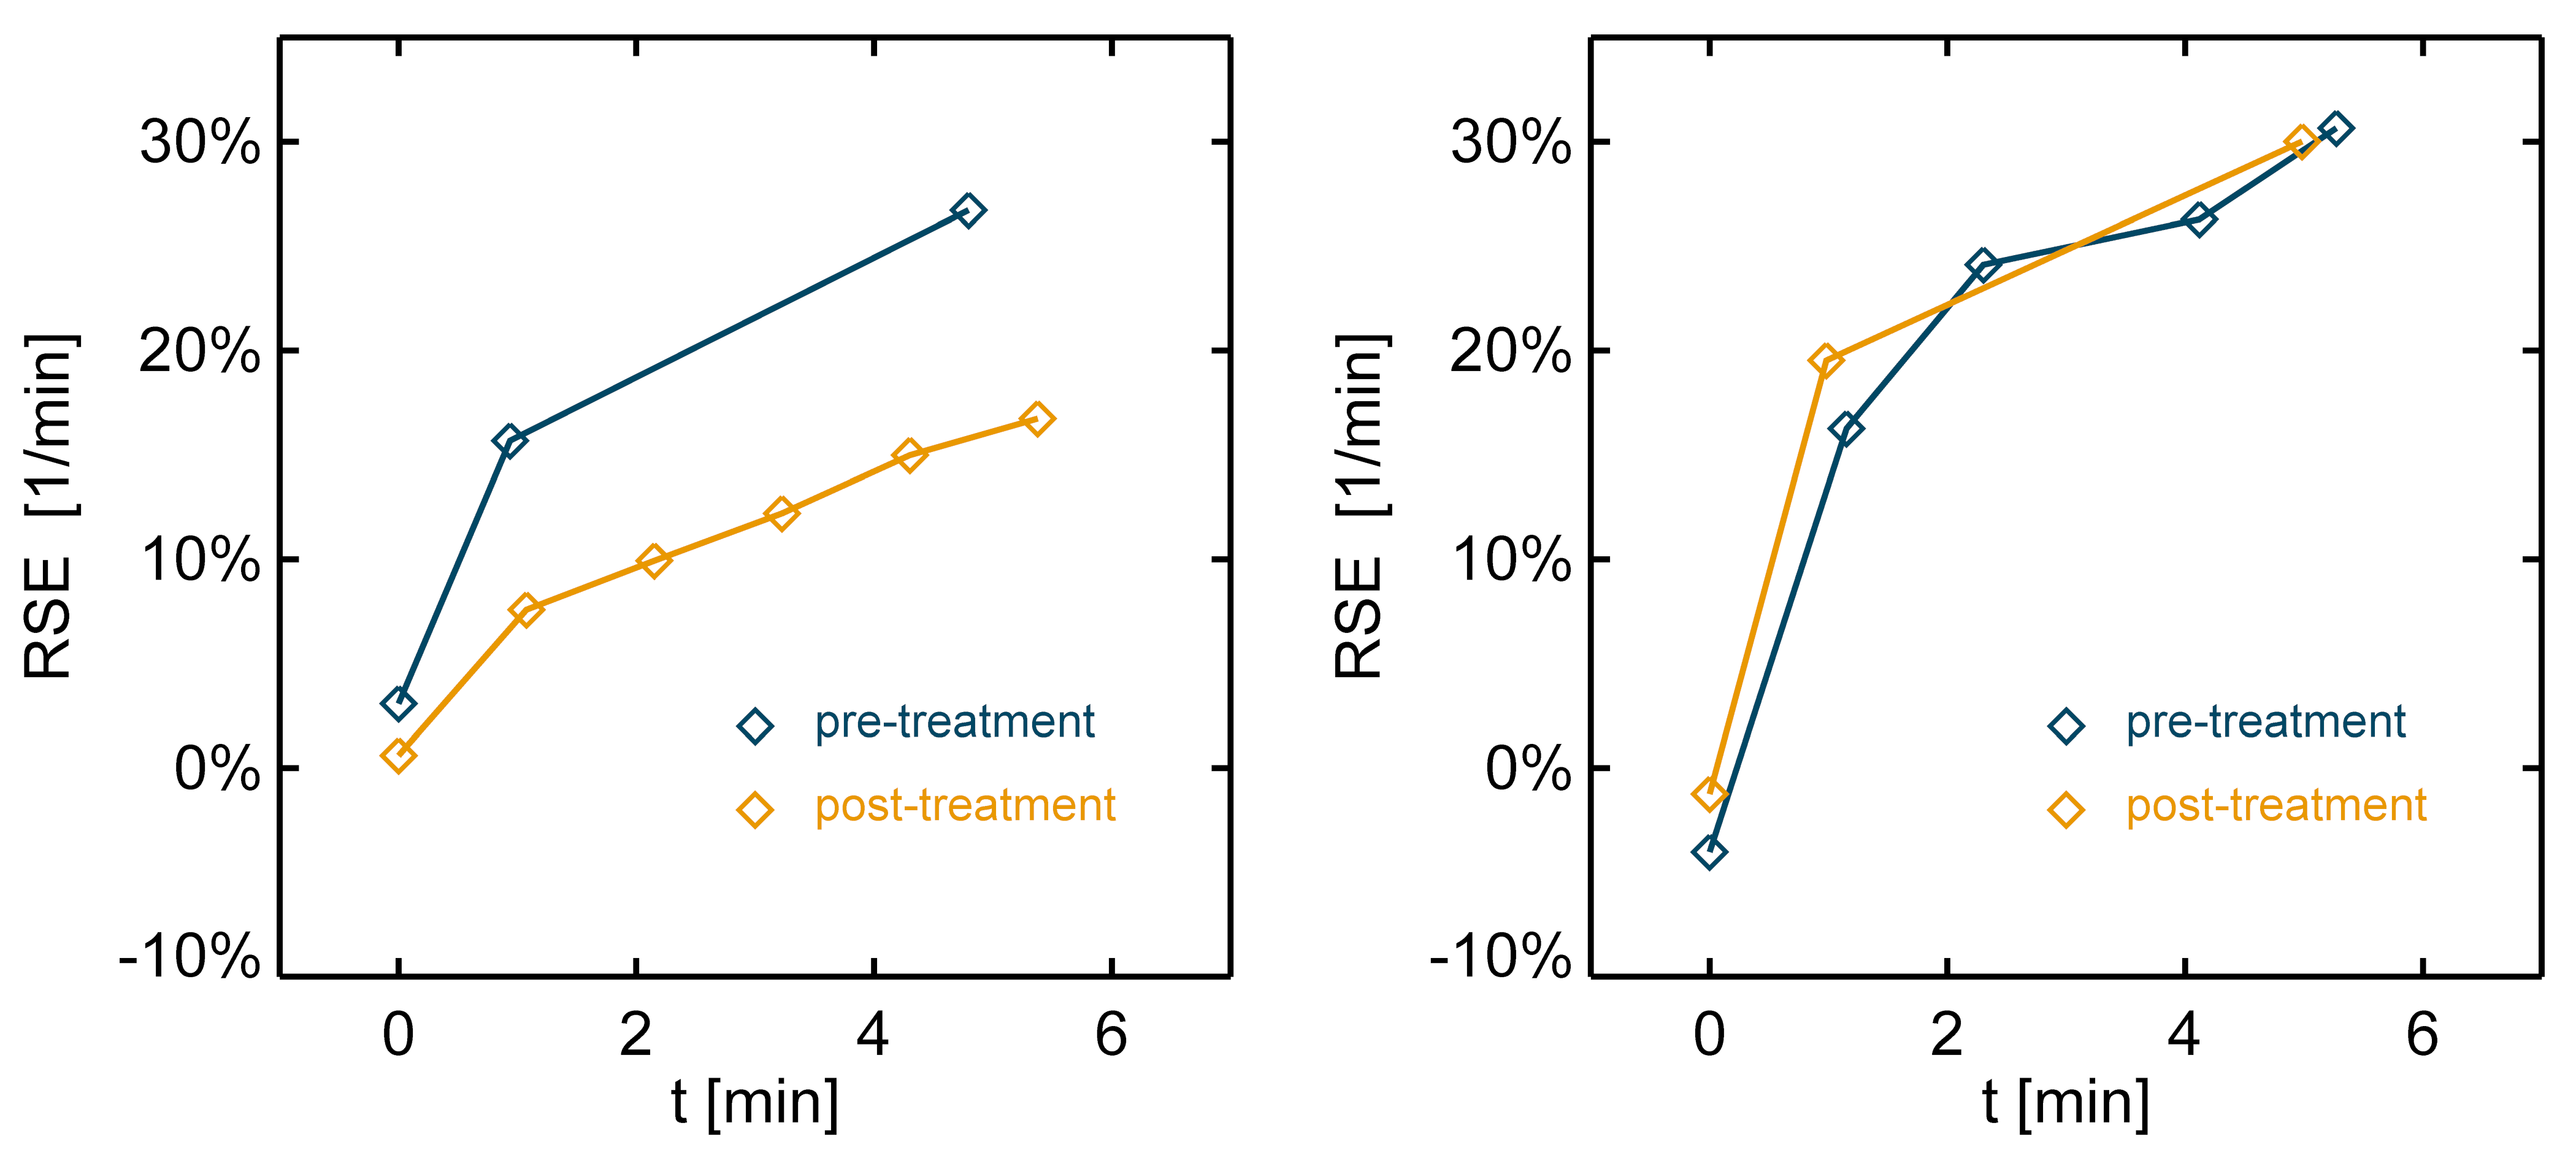
Relative signal enhancement (RSE, relative to the unenhanced signal) averaged over the parenchymal volume was calculated for pre- and post-treatment DCEMRI scans, on a time scale relative to the first post-contrast acquisition (Figure 2). The MR signal was scaled using the gradient echo signal equation to correct for differing TR and/or flip angle values and contrast agents in order to allow direct comparison. For this purpose, baseline values of parenchymal T1 = 1136 ms (1.5T) and 1324 ms (3T) were used,7 and all DCEMRI data was standardized by scaling to the common parameter values of FA = 10°, TR = 5.5 ms, and relaxivity of gadodiamide at the given field strength.
The post-contrast RSE uptake curves were modeled as a linear function whose slope indicated the RSE rate, with higher slopes indicating faster and more pronounced BPE. Only the first 6 minutes after the first post-contrast acquisition were used in analysis. The RSE rates thus obtained were compared between pre- and post-treatment scans and compared using the two-sided Wilcoxon signed rank test. The effect size for post-treatment change in BPE rates was calculated for DCEMRI data with and without standardization and compared using the two-sided Wilcoxon signed rank test. The Pearson’s correlation coefficient was calculated between the change in RSE rates and treatment duration and age at initiation of treatment. The Spearman’s correlation coefficient was calculated between the change in RSE rates and pre-treatment BIRADS breast density category.
RESULTS
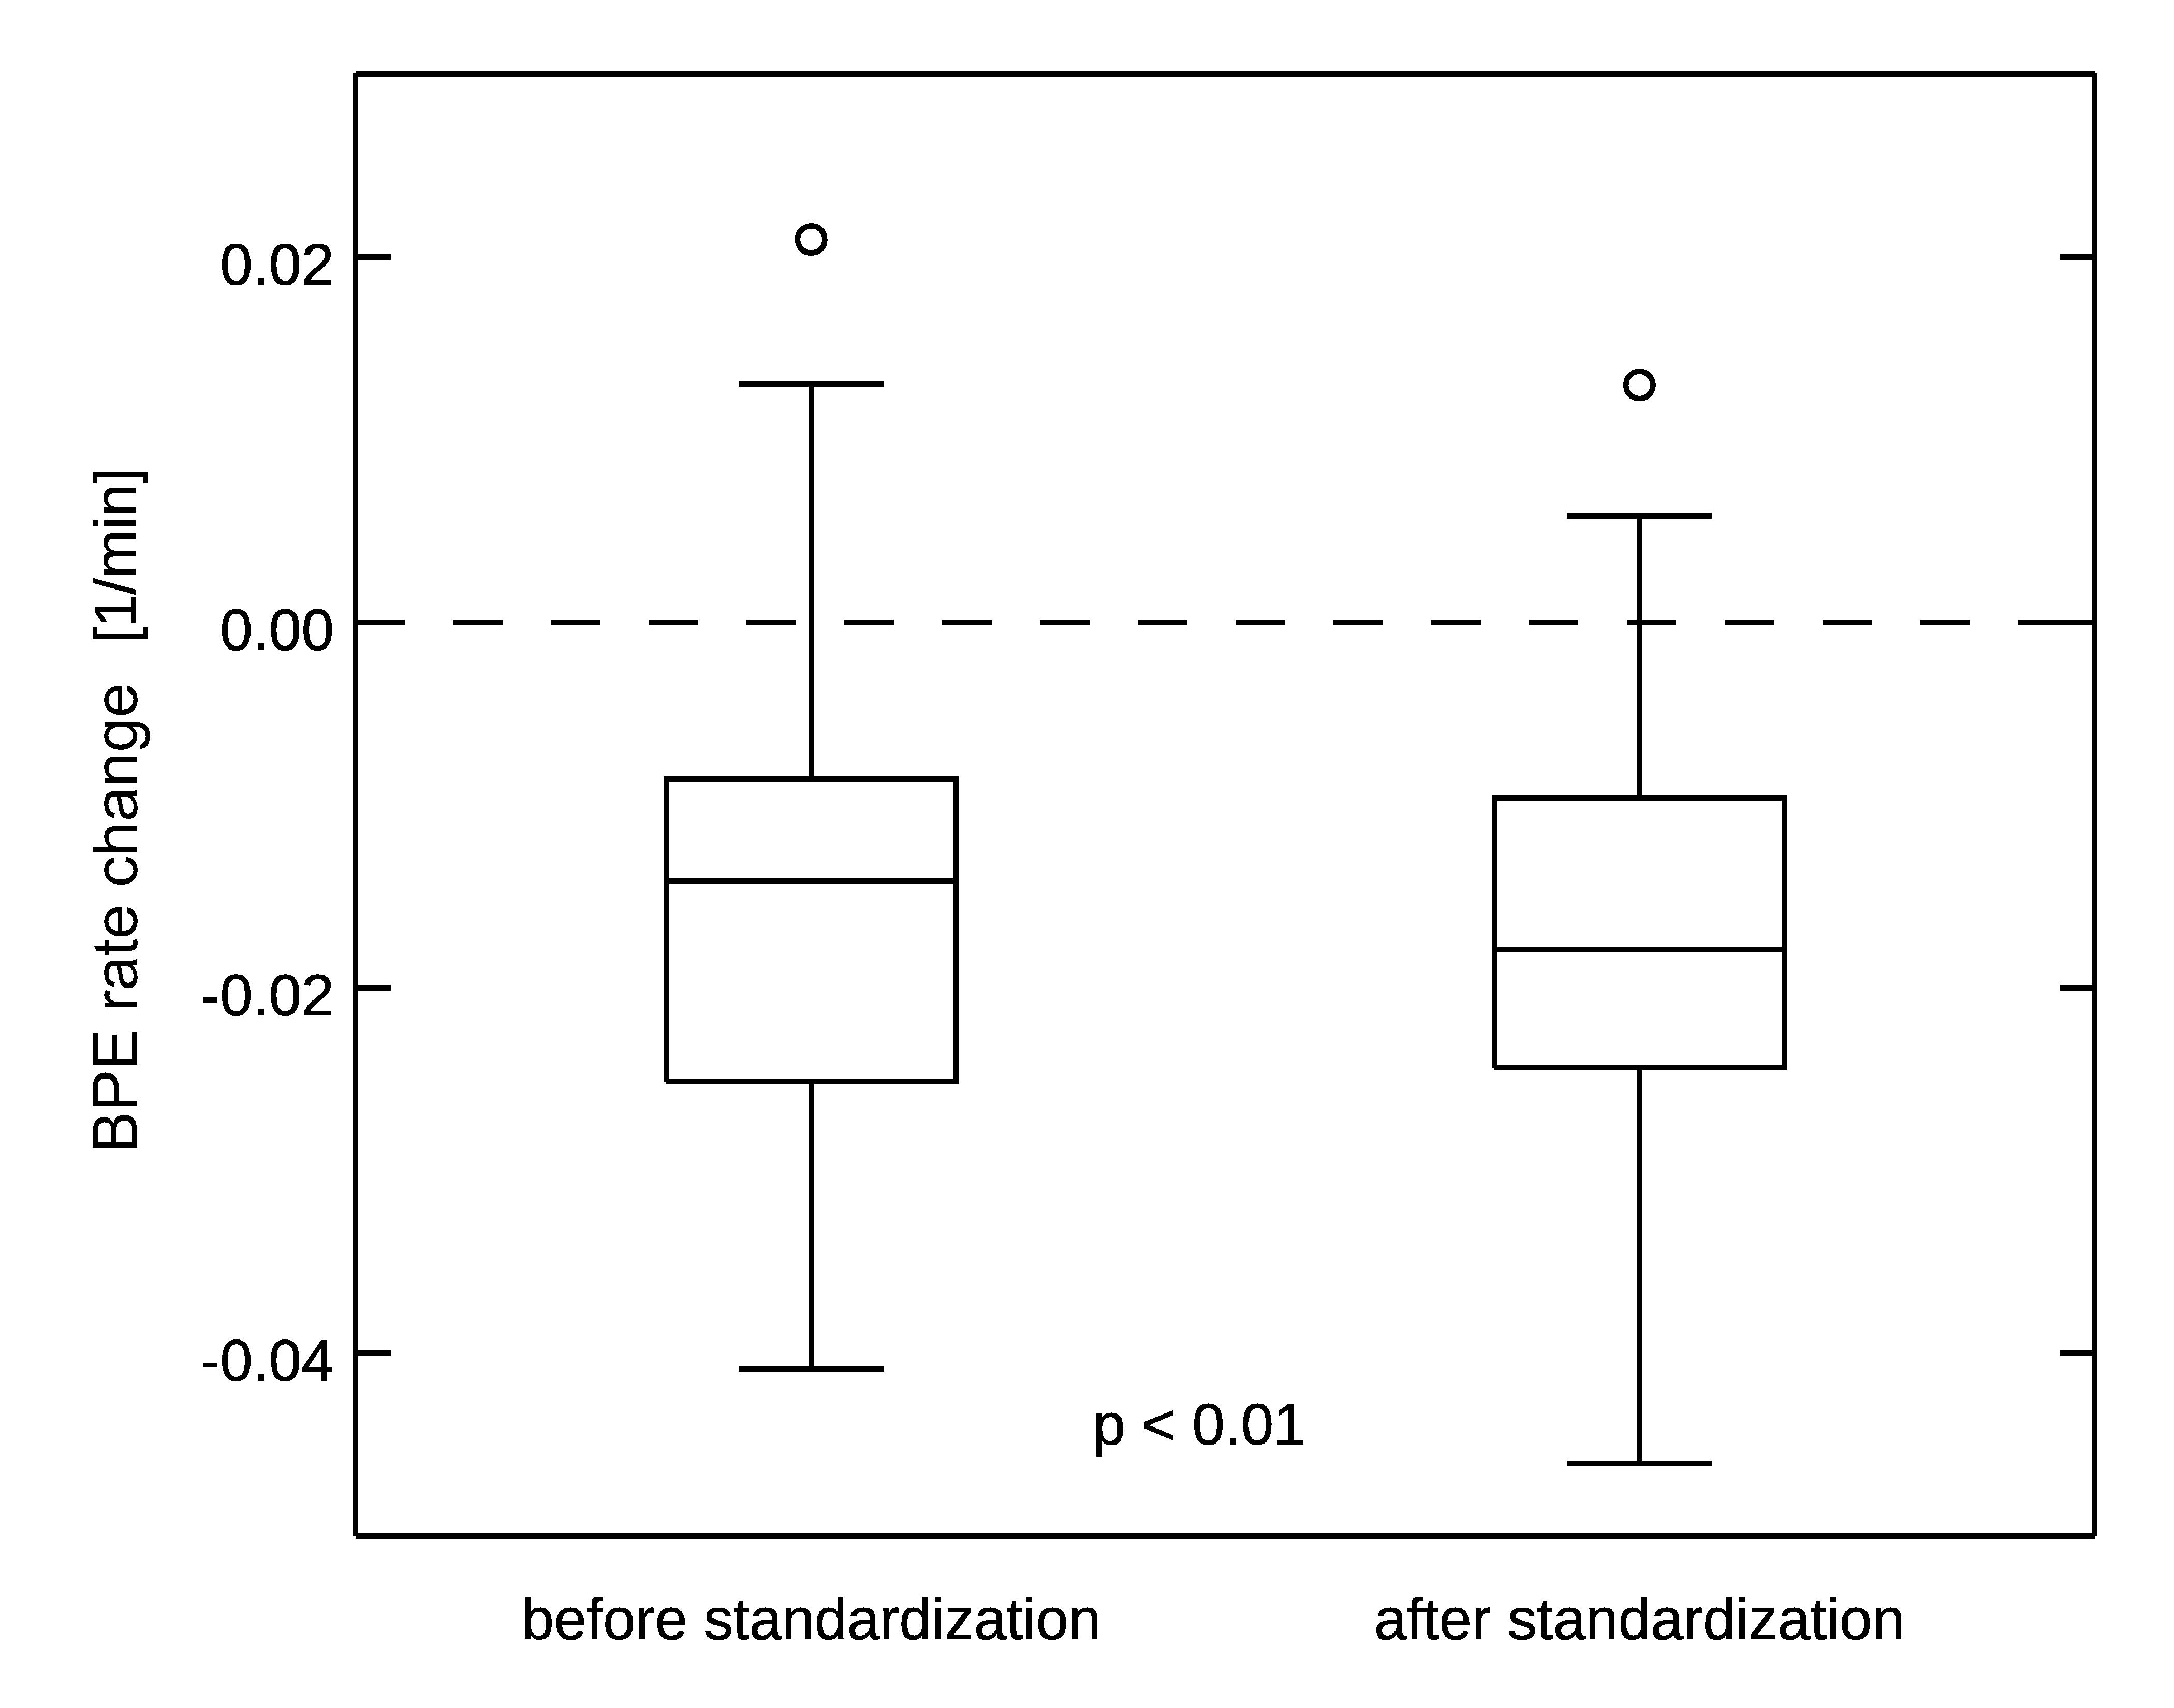
The average duration of tamoxifen treatment was 27 months (median 24, range 8-60 months). The BPE rate was reduced significantly after treatment (0.035 ± 0.018 1/min vs 0.049 ± 0.028 1/min, p < 0.01). The change in BPE rate was not significantly correlated with treatment duration, age at initiation of treatment, of breast density, and no correction was made to account for these variables. The effect size for post-treatment BPE rate changes was -0.86 (actual change -0.014 ± 0.016 1/min) without signal standardization, and -1.12 (actual change -0.017 ± 0.015 1/min) when signal standardization was applied (Figure 3). This difference was statistically significant (p < 0.01).DISCUSSION AND CONCLUSION
Our study introduces a standardizing model of BPE in DCEMRI data that can be used to quantitatively describe BPE rates and their changes, accounting for variations in the imaging protocol. The demonstrated decrease in BPE rates after preventative treatment agrees with earlier results showing that BPE, like breast density, correlates with breast cancer risk. The increase in the effect size following standardization of the DCEMRI signal supports the utility of the proposed model. The quantitative, as opposed to subjective categorical, characterization of BPE may potentially provide a sensitive and objective measure of response to preventative therapy and could become a practical tool for personalized risk management. In addition, higher sensitivity to treatment-induced changes could help increase the power of large cohort studies.Acknowledgements
This work was supported by the National Institutes of Health (NIH R01CA167785;
NIH R01C218700).
References
1. King V, Brooks JD, Bernstein JL, Reiner AS, Pike MC, Morris EA. Background parenchymal enhancement at breast MR imaging and breast cancer risk. Radiology. 2011;260(1):50-60.
2. Bennani-Baiti B, Dietzel M, Baltzer PA. MRI Background Parenchymal Enhancement Is Not Associated with Breast Cancer. PloS one. 2016;11(7):e0158573.
3. Telegrafo M, Rella L, Stabile Ianora AA, Angelelli G, Moschetta M. Breast MRI background parenchymal enhancement (BPE) correlates with the risk of breast cancer. Magnetic resonance imaging. 2016;34(2):173-176.
4. Pike MC, Pearce CL. Mammographic density, MRI background parenchymal enhancement and breast cancer risk. Annals of oncology : official journal of the European Society for Medical Oncology / ESMO. 2013;24 Suppl 8:viii37-viii41.
5. King V, Kaplan J, Pike MC, et al. Impact of tamoxifen on amount of fibroglandular tissue, background parenchymal enhancement, and cysts on breast magnetic resonance imaging. The breast journal. 2012;18(6):527-534.
6. King V, Goldfarb SB, Brooks JD, et al. Effect of aromatase inhibitors on background parenchymal enhancement and amount of fibroglandular tissue at breast MR imaging. Radiology. 2012;264(3):670-678.
7. Rakow-Penner R, Daniel B, Yu H, Sawyer-Glover A, Glover GH. Relaxation times of breast tissue at 1.5T and 3T measured using IDEAL. Journal of magnetic resonance imaging : JMRI. 2006;23(1):87-91.
Figures