3999
A Data-Driven Sequential Backward Selection Framework to Accelerate Diffusion-Relaxation Prostate Microstructure Mapping1Department of Radiology, UCLA, Los Angeles, CA, United States, 2Department of Urology, UCLA, Los Angeles, CA, United States, 3Department of Pathology, UCLA, Los Angeles, CA, United States
Synopsis
Diffusion-Relaxation Correlation Spectrum Imaging (DR-CSI) can provide unique microstructural information for prostate cancer characterization, but requires longer scan times for two-dimensional encoding of TE and b-values. This study developed a data-driven sequential backward selection framework that determined subsampled encoding schemes for DR-CSI, achieving 70% reduction of scan time to 6min while maintaining accurate ex vivo prostate microstructure mapping.
Introduction
Microstructural MRI has the potential to improve the diagnosis and characterization of prostate cancer (PCa)1-4. Recently, Diffusion-Relaxation Correlation Spectrum Imaging (DR-CSI) has been developed for prostate microstructure mapping at 3T. In ex vivo prostate specimens, the DR-CSI T2-Diffusion (D) spectra and derived signal component fractions (fA, fB, fC) achieved significant correlations with microscopic tissue compartments from histopathology4. While DR-CSI provides unique information, it substantially increased scan time compared to conventional quantitative MRI (e.g. ADC) since it acquires 2-dimensional contrast encodings in both echo time (TE) and b-value domains5. This may hinder its translation into clinical applications when scan time is restricted.One important strategy to accelerate microstructure imaging is through subsampling the signals in encoding space (e.g. TE-b) and carefully evaluating its influence (e.g. choice and number of encodings) on reconstruction accuracy6-8. This encoding subsampling problem has been mostly studied in simulations and organs outside the prostate (e.g. brain) using model-based methods (e.g. Cramer-Rao bound) that rely on pre-assumed model parameters and tissue characteristics6-8.
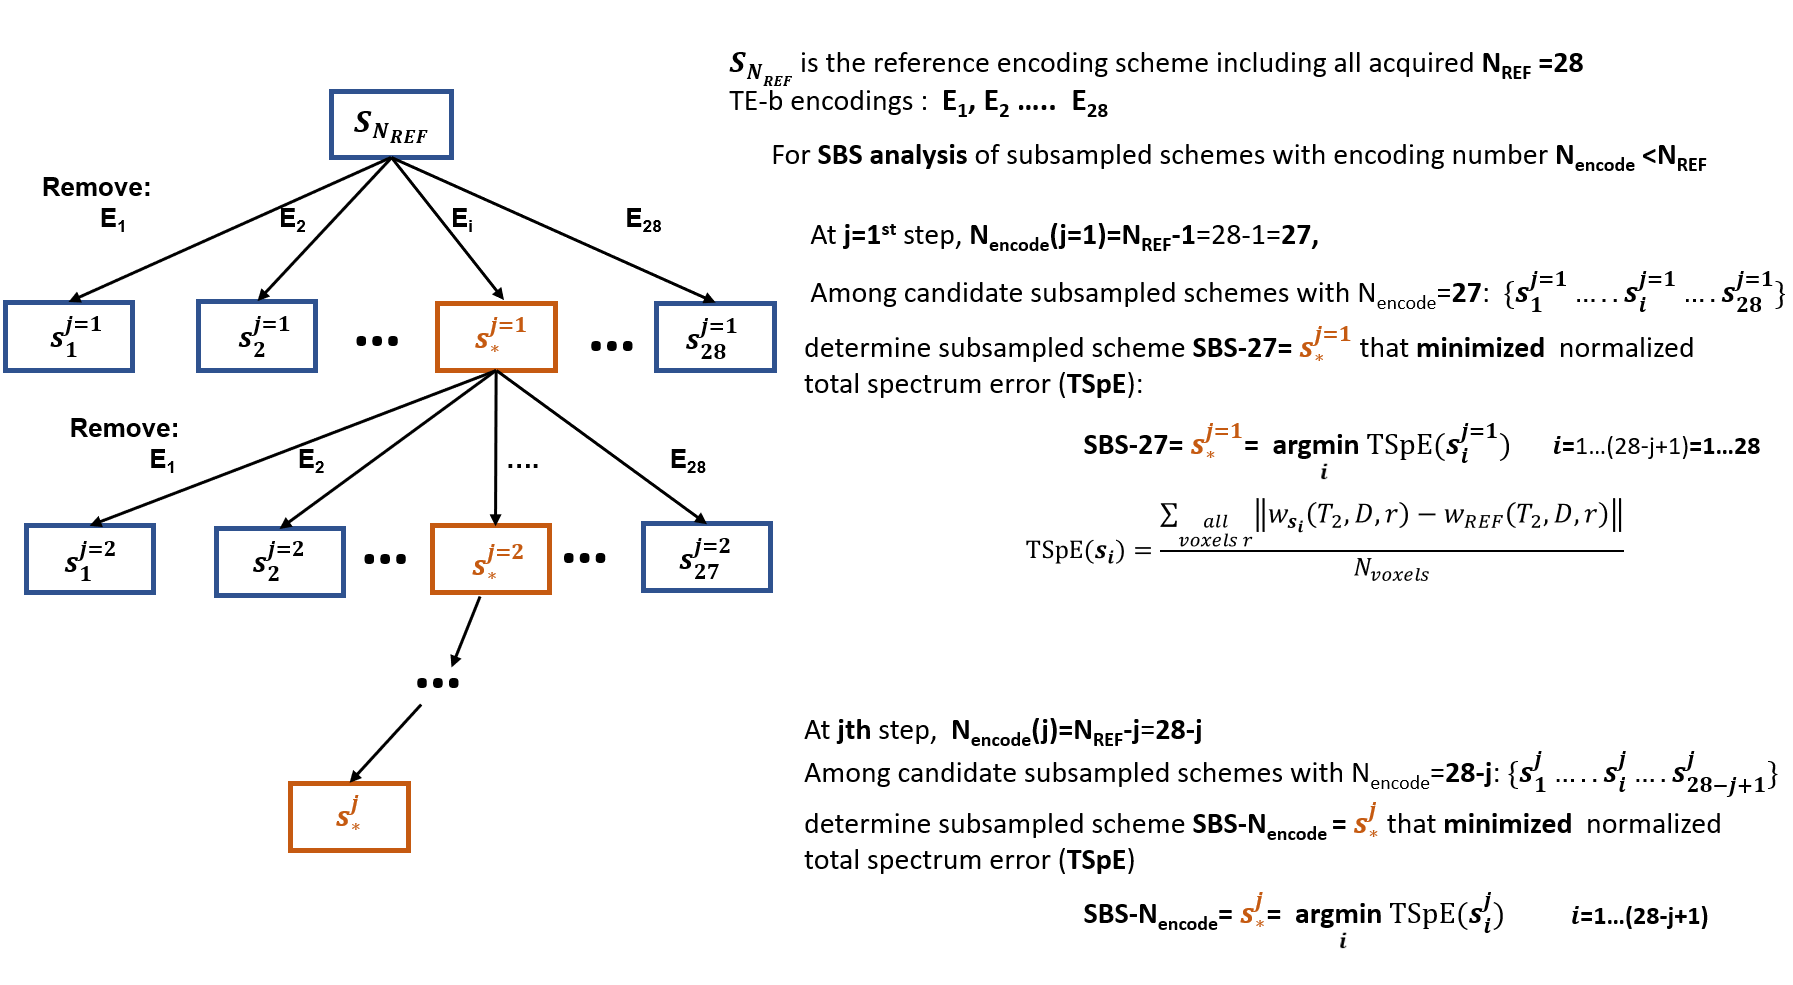
The purpose of this study is to develop and evaluate a new data-driven sequential backward selection (SBS) framework to accelerate DR-CSI (Fig. 1) by determining subsampled TE-b encoding schemes that reduce scan time (minimize number of encodings, Nencode) and accurately quantify prostate microstructure parameters.
Methods
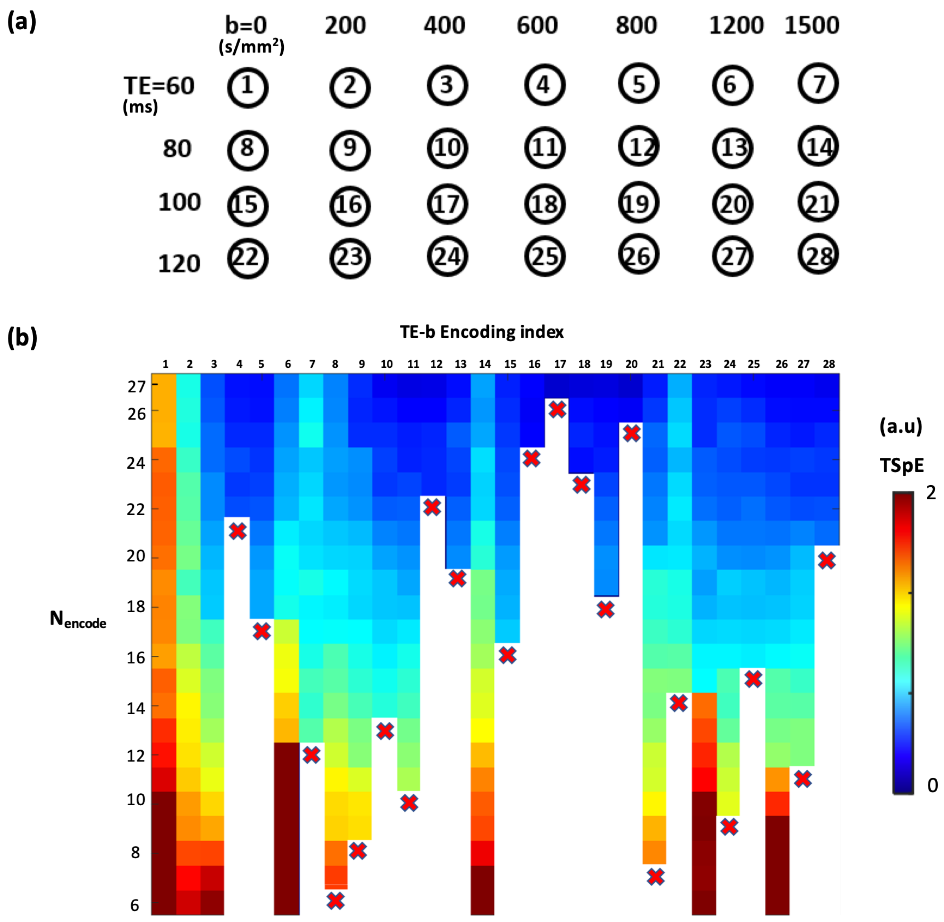
Datasets: 15 fresh whole prostate specimens from patients with PCa (27 PCa lesions, including 14 Gleason Score>3+3) undergoing radical prostatectomy were scanned ex vivo at 3T (Prisma, Siemens) using DR-CSI with parameters from previous work4. A total of NREF=28 TE-b encodings (1 average per TE-b) were acquired to form the reference dataset (Fig. 2a). A total of 91,356 voxels from 15 specimens and all slices were used for SBS.Data-Driven SBS Framework: SBS analyzed subsampled schemes (S) as Nencode was reduced: [NREF-1, NREF-2 …. NREF-j, ...] (Fig. 1). Normalized total T2-D spectrum error (TSpE) with respect to all voxels was used as the cost function to determine the subsampled scheme (SBS-Nencode) that minimized TSpE at each step j. This formed a series of selected subsampled schemes {SBS-Nencode} for each evaluated Nencode.
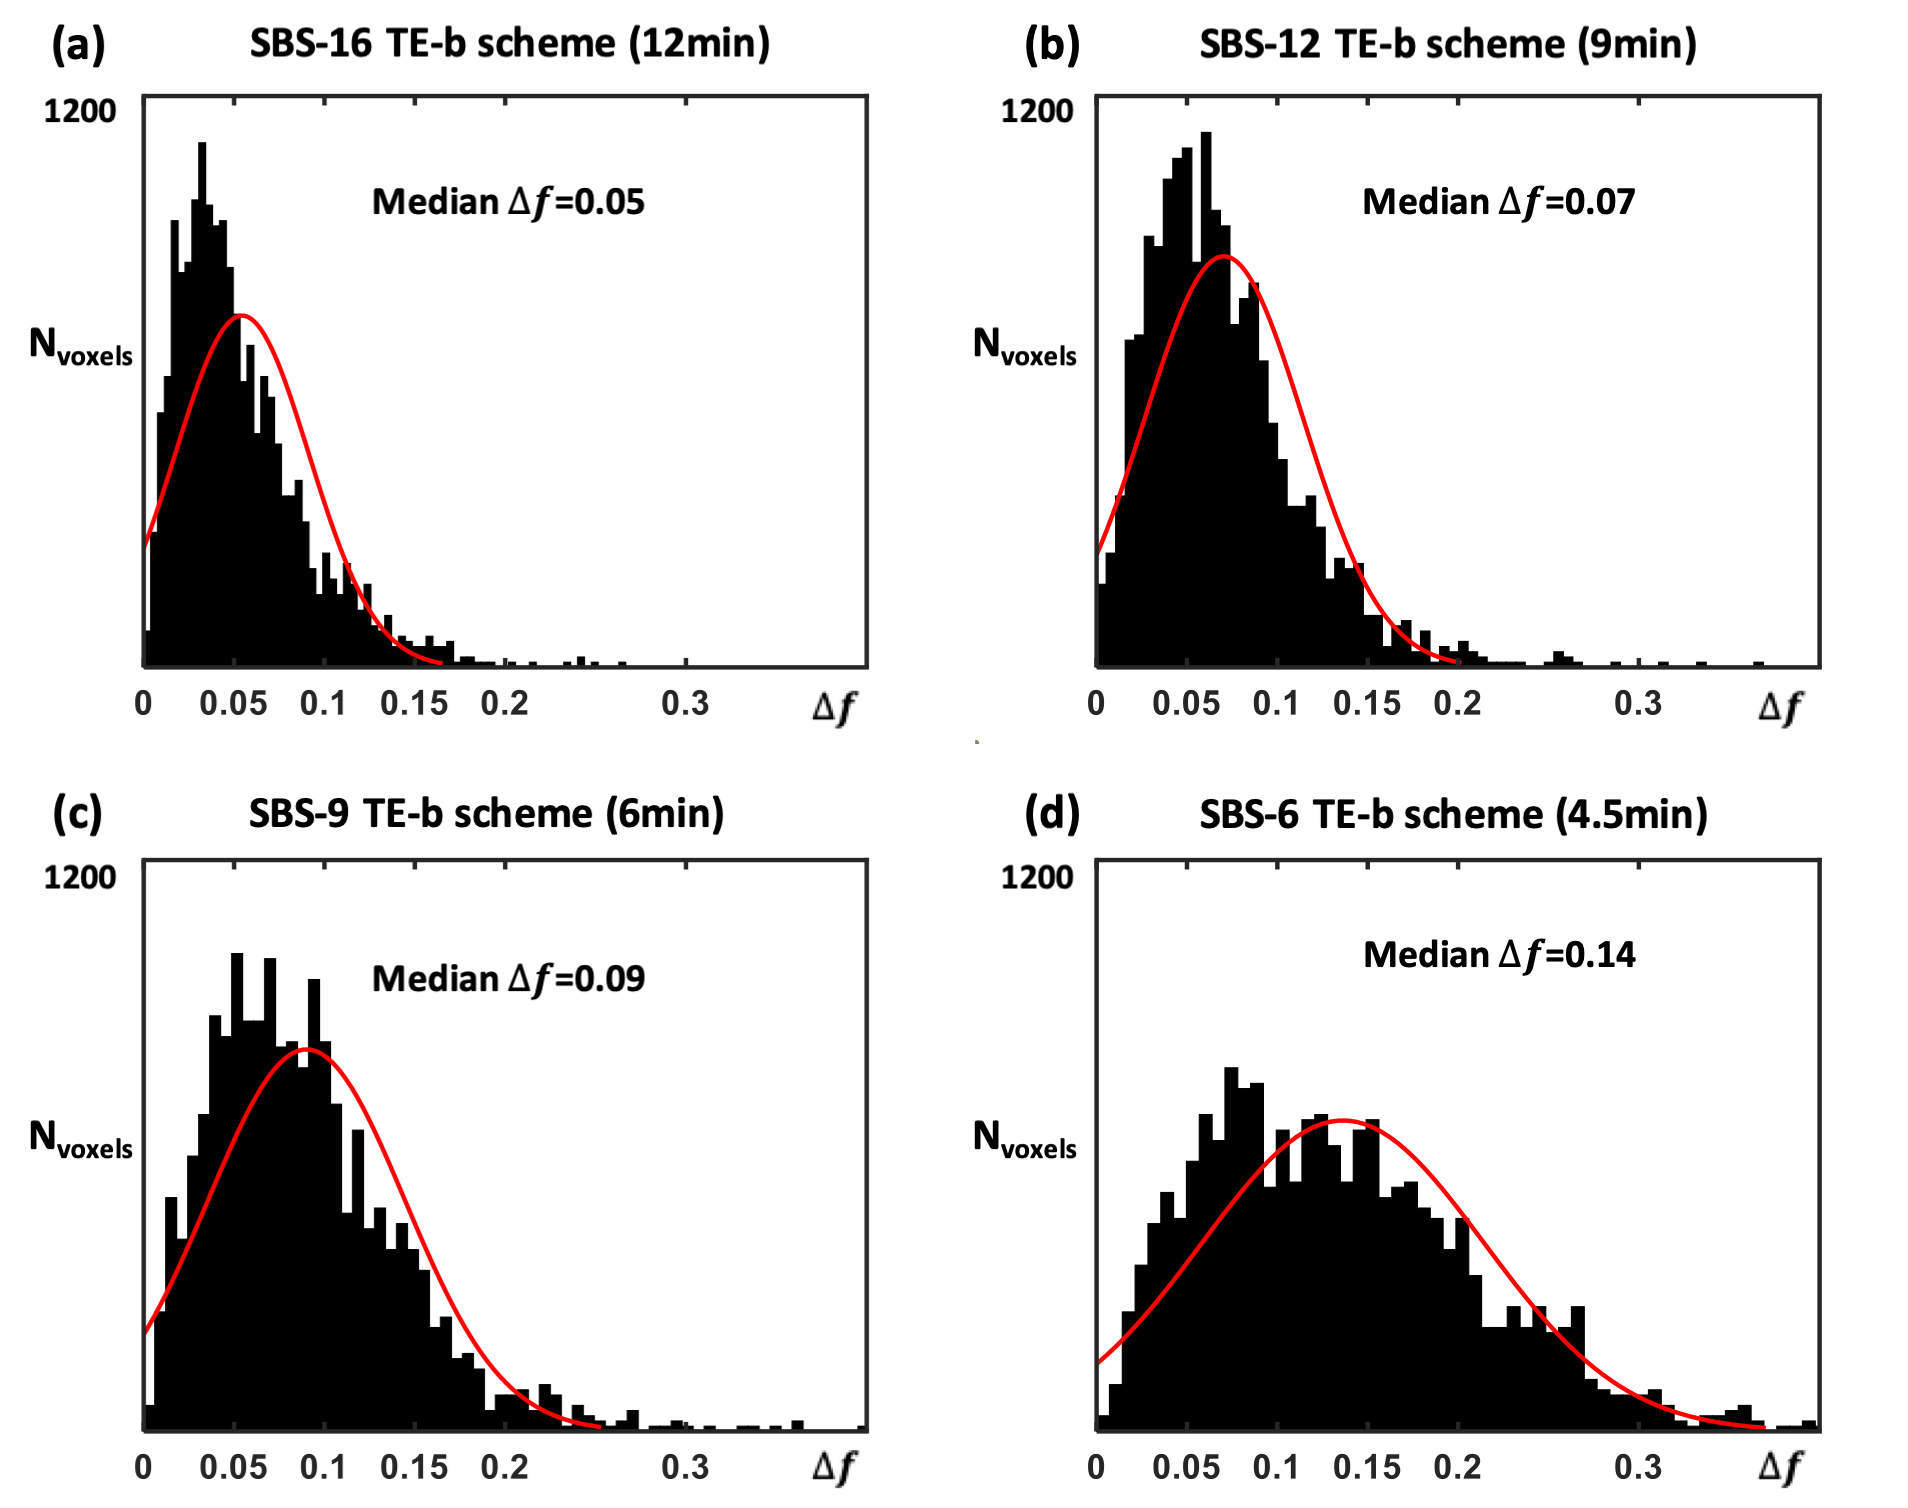
Selecting SBS subsampled scheme with minimum Nencode: For each SBS-Nencode scheme, we calculated absolute error of (fA, fB, fC), defined as ∆f=|∆fA| +|∆fB| +|∆fC| , for every voxels, compared to the NREF=28 scheme. Histogram analysis of ∆f was used to determine the SBS scheme that minimized Nencode (and scan time) while maintaining accuracy for calculating (fA, fB, fC). It was reported4 that PCa and benign prostate tissue had mean difference of 0.1-0.13 in fA and fC. Therefore, a threshold of median ∆f<0.1 was used to select the final SBS scheme.
Results
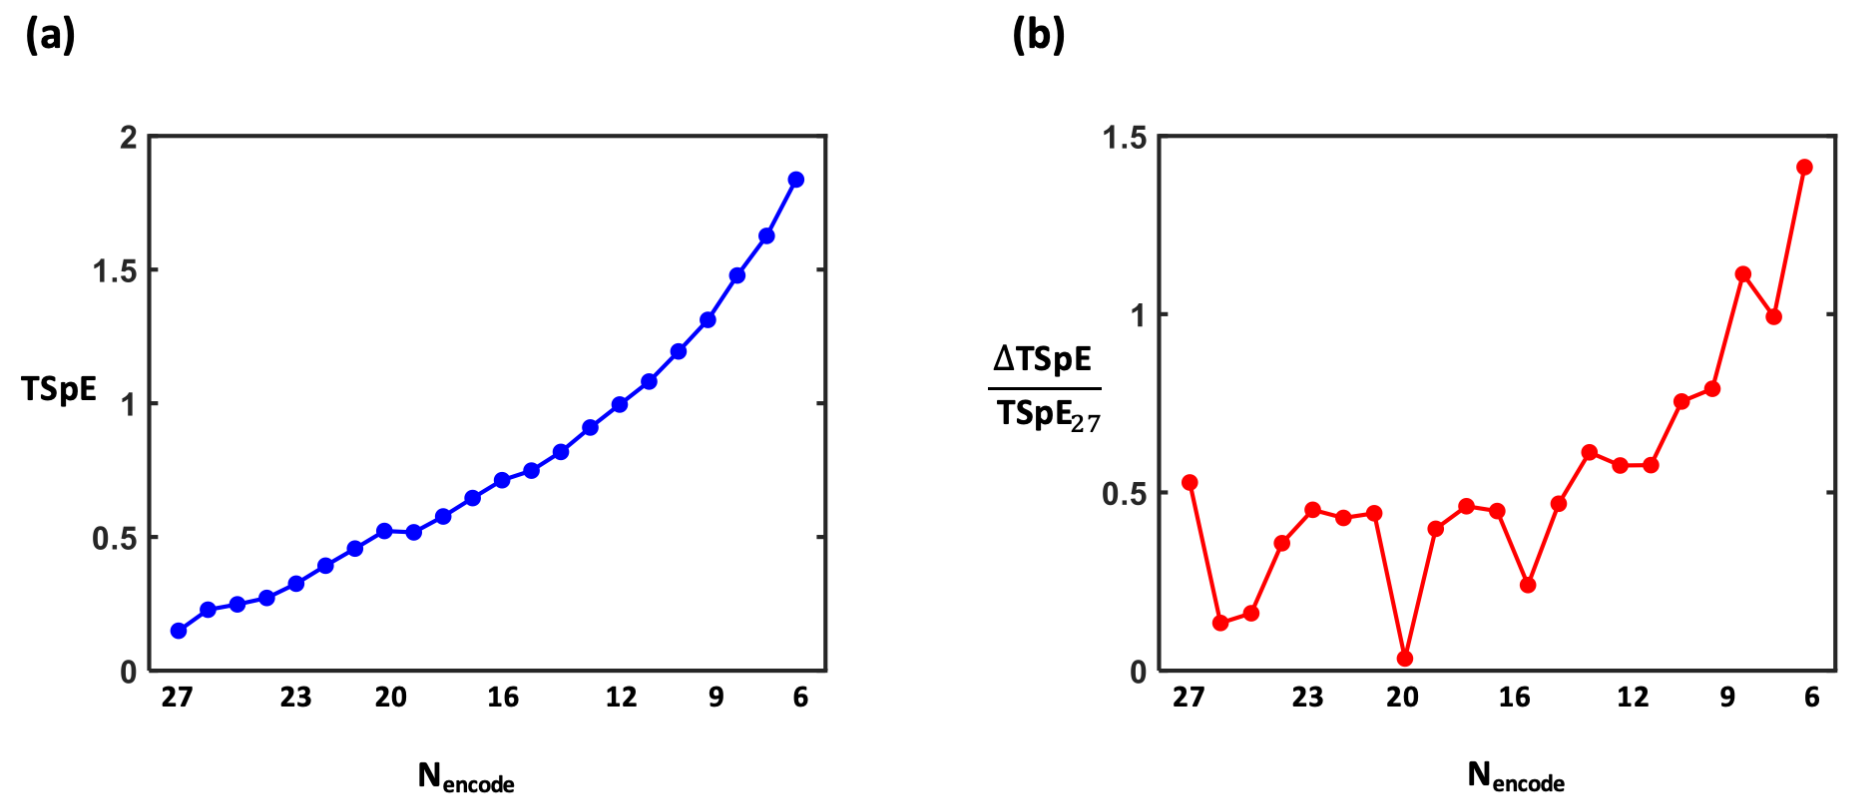
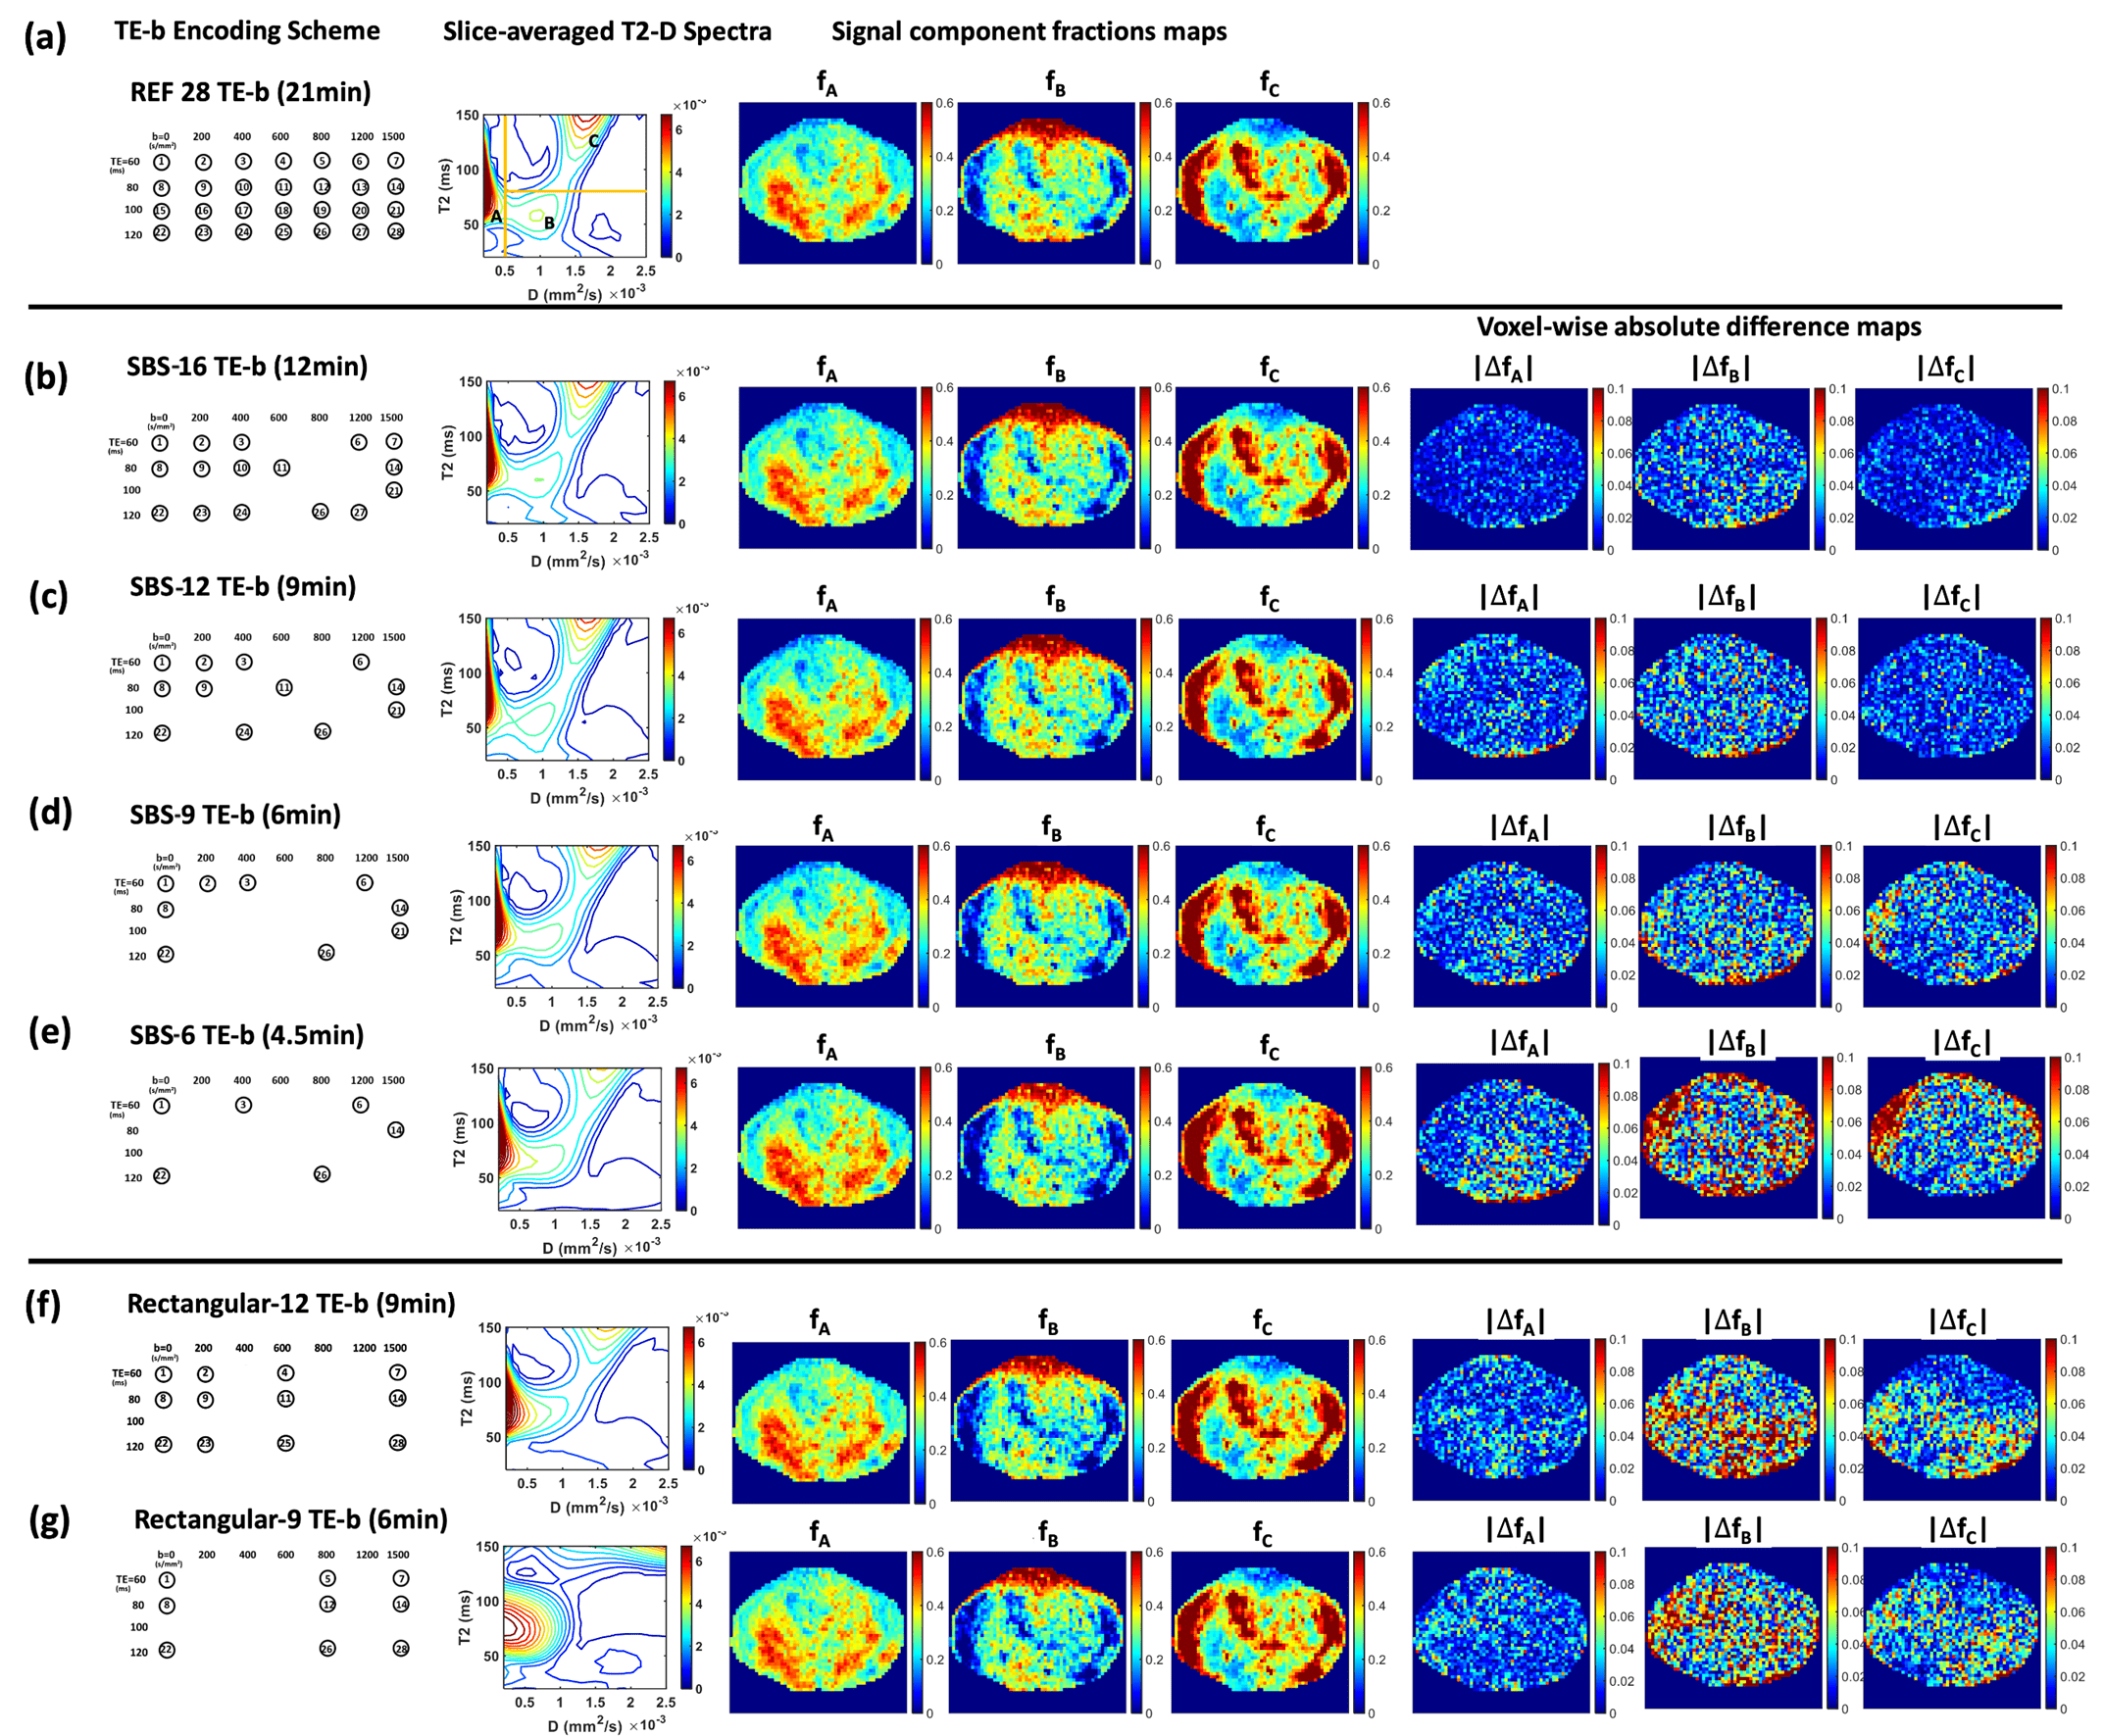
Fig. 2b shows the results of each step of SBS and the corresponding SBS subsampled schemes with minimum TSpE as Nencode was reduced from 27 to 6 (scan duration: 21min to 4.5min). The evolution of TSpE for SBS subsampled schemes and the rate of its increase ∆TSpE versus Nencode is presented in Fig. 3, ∆TSpE rapidly increased for Nencode<9.Representative examples comparing the accuracy of reconstructed T2-D spectra and (fA, fB, fC) using SBS subsampled schemes with Nencode=16, 12, 9, and 6 with respect to the reference encoding scheme are shown in Fig. 4a-e. The results using rectangular subsampled schemes selected from grid search analysis for Nencode=12 and 9 are also shown in Fig. 4f-g for comparison.
Results of histogram analysis of ∆f to determine the final SBS subsampled scheme are shown in Fig. 5. SBS-9 was determined as the final scheme with reduced scan time of 6min and median ∆f=0.09.
Discussion
Using the data-driven SBS framework for TE-b subsampling, the final SBS-9 TE-b scheme (6min) achieved 70% reduction in DR-CSI scan time compared to the reference 28 TE-b scheme (21min) while providing sufficient accuracy of (fA, fB, fC) in ex vivo prostate tissue. The SBS-9 scheme can be applied for future prospective acceleration of DR-CSI scans.Our data-driven SBS framework can also be combined with other efficient acquisition techniques, e.g. time-division multiplexing EPI9, to achieve even higher acceleration factors. The combined acceleration may be essential for clinical translation of prostate DR-CSI since in vivo MRI has lower SNR and may require more averaging for each encoding. At the same time, our SBS framework has the flexibility to adapt DR-CSI to in vivo prostate tissue characteristics as it is data-driven.
Compared to model-based methods (e.g. Cramer-Rao bound) for encoding scheme subsampling6-8, our data-driven SBS framework does not rely on pre-assumed model parameters and tissue characteristics. Instead, a large number of voxels from 15 prostate specimens from PCa patients were directly analyzed by the SBS framework, which naturally incorporated the actual distribution of signals reflecting underlying prostate tissue microstructure, and ensured overall mapping accuracy while avoiding bias toward only certain assumed tissue characteristics.
Conclusion
Using a data-driven SBS framework for subsampling the TE-b encoding space, we achieved ~70% reduction in scan time to 6min for ex vivo prostate DR-CSI while maintaining accurate prostate microstructure parameter mapping. This framework improves the scan time feasibility and prospect for application of prostate DR-CSI to improve diagnosis of PCa.Acknowledgements
This work was supported in part by: Integrated Diagnostics Program, Departments of Radiological Sciences and Pathology, David Geffen School of Medicine at UCLA; Jonsson Comprehensive Cancer Center at UCLA; National Cancer Institute of the NIH under award number R01CA248506; Siemens Medical Solutions, USAReferences
1. Panagiotaki E, Chan RW, Dikaios N et al. Microstructural characterization of normal and malignant human prostate tissue with vascular, extracellular, and restricted diffusion for cytometry in tumors magnetic resonance imaging. Invest Radiol 2015;50(4):218–227.
2. Chatterjee A, Watson G et al. Changes in epithelium, stroma and lumen space correlate more strongly with Gleason pattern and are stronger predictors of prostate ADC changes than cellularity metrics. Radiology 2015; Dec;277(3):751-62. doi: 10.1148/radiol.2015142414.
3. Kim, D., Doyle, E. K., Wisnowski, J. L., Kim, J. H. and Haldar, J. P. (2017), Diffusion‐relaxation correlation spectroscopic imaging: A multidimensional approach for probing microstructure. Magn. Reson. Med., 78: 2236-2249.
4. Zhang Z, Priester A, Magyar C, et al. Prostate Microstructure in Prostate Cancer Using 3T MRI with Diffusion-Relaxation Correlation Spectrum Imaging, Radiology; 2020;296(2):348-355.
5. Kim, D., Doyle, E. K., Wisnowski, J. L., Kim, J. H. and Haldar, J. P. (2017), Diffusion‐relaxation correlation spectroscopic imaging: A multidimensional approach for probing microstructure. Magna Reson Med. 78:2236-2249
6, Haldar JP, Kim D. OEDIPUS: An Experiment Design Framework for Sparsity-Constrained MRI. IEEE Trans Med Imaging. 2019;38(7):1545-1558. doi:10.1109/TMI.2019.2896180
7. Nilsson, M, Szczepankiewicz, F, Brabec, J, et al. Tensor-valued diffusion MRI in under 3 minutes: an initial survey of microscopic anisotropy and tissue heterogeneity in intracranial tumors. Magn Reson Med. 2020; 83: 608– 620.
8. Bo Zhao, Haldar JP, Congyu Liao, et al. Optimal Experiment Design for Magnetic Resonance Fingerprinting: Cramér-Rao Bound Meets Spin Dynamics. IEEE Trans Med Imaging. 2019;38(3):844-861. doi:10.1109/TMI.2018.2873704
9. Ji, Y, Gagoski, B, Hoge, WS, Rathi, Y, Ning, L. Accelerated diffusion and relaxation-diffusion MRI using time-division multiplexing EPI. Magn Reson Med. 2021 Nov;86(5):2528-2541. doi: 10.1002/mrm.28894.
Figures