3998
Transcytolemmal water exchange in prostate manifest via DCE-MRI and DWI kurtosis imaging1Advanced Imaging Research Center, Oregon Health & Science University, Portland, OR, United States, 2Portland VA Medical Center, Portland, OR, United States, 3Urology, Oregon Health & Science University, Portland, OR, United States, 4Diagnostic Radiology, Oregon Health & Science University, Portland, OR, United States
Synopsis
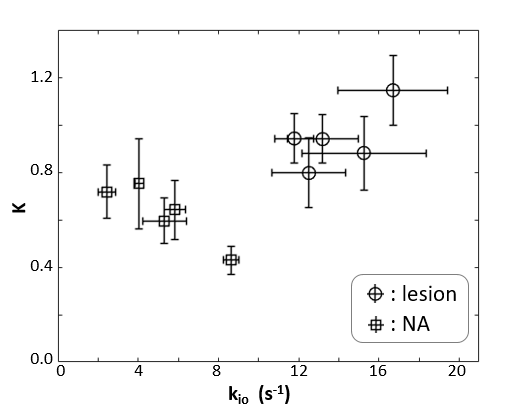
Transcytolemmal water exchange effects are quantified with SSM-DCE MRI and DWI kurtosis imaging with b-values up to 2000 s/mm2. The two-dimensional scatter plot of the unidirectional cellular water efflux rate constant (kio) and the diffusion kurtosis (K) shows good separation between lesion and normal appearing prostate tissue.
Introduction
Transcytolemmal water exchange has been investigated using dynamic contrast-enhanced (DCE) MRI.1,2 This homeostatic process is also believed to play a major role in the non-Gaussian nature of diffusion-weighted imaging (DWI) b-space decay. The non‑Gaussian DWI signature is most commonly modeled with diffusion kurtosis.3 The goal of this work is to find the association between the unidirectional cellular water efflux rate constant (kio) and the diffusion kurtosis (K) so as to better understand the implication, and potential application, of the transcytolemmal water exchange effect on clinical prostate MRI.Methods
After informed consent, seven subjects underwent 3T (Siemens) prostate multi‑parametric MRI (mpMRI) with an endorectal RF coil. The DCE data were acquired using a 3D TurboFLASH pulse sequence with a 192*144*20 matrix size and a 270*203 mm2 FOV, resulting in (1.4)2 mm2 in-plane resolution. Other parameters are: slice thickness: 3.0 mm; TR/TE/FA: 2.28 ms/0.89 ms/8º, image frame sampling interval: 1.55 s. A 0.1 mmol/kg CR (Prohance; Bracco) bolus was administered starting ~30 s after commencing the DCE-MRI sequence. The total acquisition time is ~3.6 minutes for a total of 140 imaging volumes. The DWI protocol employed a b-value range from 0 to 5,000 s/mm2. Other details are: 128 x 128 in-plane matrix (40% phase oversampling), 24 cm FOV, 3.0 mm slice thickness and ~5.7 min acquisition time. Five mp-MRI visible lesions from five subjects were confirmed by clinical biopsies. Region-of-interests (ROIs) were drawn on de-noised4,5 diffusion-weighted images for lesion and contralateral normal appearing (NA) prostate tissue.Rate constant kio was modeled using the Shutter-Speed Model (SSM).1,2 Kurtosis was modeled with the standard equation3 using 7 b-values (0, 250, 400, 700, 1000, 1500, 2000 s/mm2).
Results
Figure 1a shows a representative individual arterial input function (AIF) manually determined from a region-of-interest (ROI) within the femoral artery of the subject. A post-CR DCE image zoomed to the prostate is shown in the inset and the enhanced lesion is indicated by the arrow. Fig. 1b shows a representative single voxel DCE data time-course (circles) with its SSM fitting (solid curve, Ktrans = 0.51 min-1, ve = 0.14, and kio = 12.5 s-1). Figure 2 is a semi-log plot of a single voxel DWI data with a maximum b-value (bmax) of 2000 s/mm2. Even by b of 1500 s/mm2, there is appreciable departure of the linear [Gaussian] trend extrapolated from the apparent diffusion coefficient (ADC) fitted to lower b‑values. The solid curve is that from the kurtosis model fitting. Following the literature recommendation,3 and our own unpublished data, the maximum b-value for kurtosis modeling was limited to 2000 s/mm2. The fitted values for the displayed curve are Dapp = 1.0 x 10⁻³ mm2/s and K = 1.15. The inset shows the DWI image at b = 3000 s/mm2 with the lesion location indicated by the arrow. Figure 3 plots the mean K values vs. those of kio in lesion (circles) and NA (squares) ROIs from five different subjects. The error bars show standard errors.Discussion
In this work, the effects of transcytolemmal water exchange on DCE and DWI signals has been investigated with shutter-speed modeling and kurtosis modeling, respectively. Compared to normal appearing tissue, it has been shown previously that the cross membrane water exchange quantified by DCE increases for prostatic lesions. Interestingly, this work and results from literature show that diffusion kurtosis also increases for prostatic lesion when compared to normal appearing tissue. Using the K - kio two-dimensional scatter plot, this work further demonstrates the lesion vs. NA separation noticeably increased when the 2D representation is adopted. This indicates that when the kio and K are combined, water exchange effect can be more informative for lesion identification, and the combined approach is more powerful than either one alone. The kio parameter carries information on membrane sodium pump flux.6 The limitation of current study is the sample size is rather small, which also excludes any potential of the combined approach on lesion aggressiveness monitoring.Acknowledgements
Grant Support: Brenden-Colson Center for Pancreatic Care.
Oregon Clinical and Translational Research Institute, NIH/NCATS.
Thorsten Feiweier (Siemens) for providing the work-in-progress sequence for DWI data acquisition.
References
1. Li, Priest, Woodward, Tagge, Siddiqui, Huang, Rooney, Beer, Garzotto, Springer, Magn. Reson. Med. 69:171-178 (2013).
2. Li, Cai, Moloney, Chen, Huang, Woods, Coakley, Rooney, Garzotto, Springer, J. Magn. Reson. 269: 104-112 (2016).
3. Jensen, Helpern, Ramani, Lu, Kaczynski, Magn. Reson. Med. 53:1432-1440 (2013).
4. Veraart J, Novikov DS, Christiaens D, Ades-Aron B, Sijbers J, Fieremans E. Neuroimage. 142:394-406 (2016).
5. Does, Olesen, Harkins, Serradas-Duarte, Gochberg, Jespersen, Shemesh. Magn Reson Med. 81:3503-3514 (2019).
6. Li, Mangia, Lee, Bai, Springer. Magn. Reson. Med. 82:411-424.
Figures
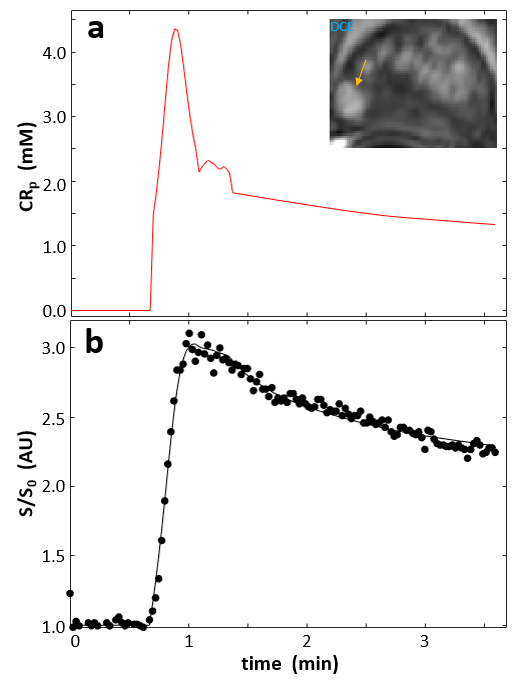
Figure 1. Panel a shows a representative, individually-determined arterial input function (AIF) manually derived from a region-of-interest (ROI) within the femoral artery. A post-CR DCE image zoomed to the prostate is shown in the inset with the enhanced lesion indicated with the arrow. Panel b shows a representative pixel DCE data time-course, with SSM fitting.
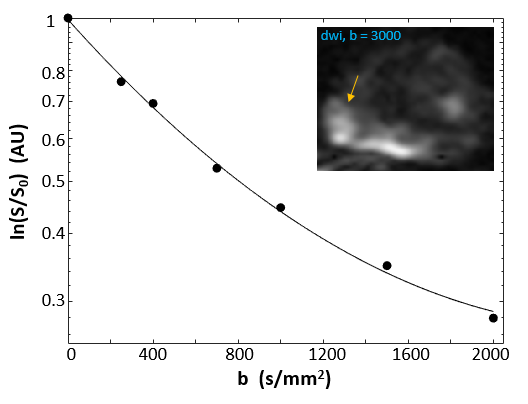
Figure 2. The main plot shows a semi-log plot of a single voxel DWI b-space decay data. The subject is the same as in Fig. 1. Even by b-value of 1500 s/mm2, there is appreciable departure of the linear [Gaussian] trend extrapolated from the apparent diffusion coefficient (ADC) fitted to lower b‑values. The solid curve is that from the kurtosis model fitting. Inset shows a DWI image at b = 3000 s/mm2.