3997
Preliminary study of extracellular volume fraction in identifying pathological risk factors of early cervical cancer1Department of Radiology, China Japan Union Hospital, Changchun, China, 2MR Scientific Marketing, Siemens Healthineers, Beijing, China
Synopsis
This study explored the feasibility of ECV based on T1 mapping evaluate early cervical cancer pathological characters, such as deep stromal invasion (DSI) and lymphovascular space invasion (LVSI). The ECV in the group with exceeding deep 1/2 of stromal invasion was significantly higher than that of the non-exceeding 1/2 group. DSI group was significantly higher than that in the non-DSI group. Our research shows that ECV based on T1 mapping could represent an emerging preoperative imaging biomarker for the classification of DSI of early cervical cancer.
Introduction
Radical hysterectomy (RH) combined with pelvic lymphadenectomy is the main treatment for early cervical cancer [1]. Some pathological characters, such as deep stromal invasion (DSI) and lymphovascular space invasion (LVSI), are important prognostic factors in early cervical cancer [2]. Recent studies have found that for early cervical cancer with "low-risk" (no LVSI, DSI < 10 mm), laparoscopic radical hysterectomy (LRH) and RH have no significant difference between 3-year disease-free survival and overall survival, and LRH has the advantages of less trauma and quick recovery [1]. MRI is the main imaging method for evaluation of preoperative cervical cancer. Preoperative non-invasive prediction of pathological variables such as LVSI and DSI based on quantitative MR image information has important clinical significance because it helps patients choose the optimal surgical method, e.g., RH or LRH. Tumor extracellular matrix plays a key role in tumor progression, invasion, and metastasis. Tumor extracellular matrix fraction (ECV) has been recognized as an independent prognostic factor for cervical cancer. MR-based T1 mapping is an advanced MR technology, which can be used to quantitatively measure and characterize tissues, and it can also non-invasively quantify ECV. The main purpose of this research is to assess the potential of native T1 mapping and post-enhancement T1mapping, and ECV for the identification of DSI and LVSI.Methods
From December 2020 to June 2021, we consecutively enrolled 23 females (average age 52.93 ± 9.397 years) with early cervical cancer who underwent pelvic MR scans at a 3T system (MAGNETOM Skyra, Siemens Healthcare, Erlangen, Germany) acquiring T2WI, T1WI, native T1mapping, post-enhancement T1mapping before surgery. The sequence parameters are shown in Table 1. To be more specifically, T1 mapping was obtained by a B1 inhomogeneity-corrected variable flip angle (VFA) sequence, and 3D T1-weighted volume interpolated breath-hold examination (VIBE) sequence with dual flip angles were used. Sagittal and axial T2WI-TSE images, sagittal and axial T1WI-VIBE images after the injection of contrast agent are routinely obtained. For each patient, the maximum cross-sectional area of lesion and arteries avoiding necrotic area on the same section were manually drawn on each of T1 maps (pre-and 10 minutes after contrast agent administration) as the region of interest (ROI) by visual inspection according to T2WI-TSE and enhanced T1WI-VIBE images. Calculate ECV fraction according to the following formula: ECV%=(1- hematocrit)×[(1/T1lesion-post-1/T1lesion-pre)/(1/T1blood-post-1/T1blood-pre)]×100%. Postoperative pathological indicators including LVSI and DSI were registered as 2 categorical variables, among which the demarcation of DSI was based on whether the lesion invaded exceeding deep 1/2 of stromal. Differences in ECV fraction were compared between groups with LVSI and without LVSI using the rank sum test, and the same method was also used between groups with different DSI.Results
There was no significant difference between LVSI group and n-LVSI group in ECV fractions (64.42% vs 62.40%, respectively, p=0.835). The ECV fractions in the group exceeding deep 1/2 of stromal invasion was significantly higher than that of the non-exceeding 1/2 group was significantly higher than that of non-DSI group (77.08% vs 50.23%, respectively, p=0.011). Two representative cases with different depths of stromal invasion are shown in Figure 1 and Figure 2.Discussion and Conclusion
The use of imaging methods to non-invasively assess the prognostic risk factors of early cervical cancer has important clinical significance for the selection of surgical methods and the improvement of patients’ living quality. Our research shows that T1 mapping with ECV measurement could represent an emerging preoperative imaging biomarker for the classification of deep stromal invasion of early cervical cancer.Acknowledgements
NoReferences
1. Zhiqiang Li, Chunlin Chen, Ping Liu, et al. Comparison between laparoscopic and abdominal adical hysterectomy for low-risk cervical cancer: a multicentre retrospective study. Arch Gynecol Obstet. 2021.
2. Jun Zhu , Lijie Cao , Hao Wen , et al. The clinical and prognostic implication of deep stromal invasion in cervical cancer patients undergoing radical hysterectomy. J Cancer. 2020 ;11(24):7368-7377.
3. Xiangsheng Li , Ping Wang , Dechang Li, et al. Intravoxel incoherent motion MR imaging of early cervical carcinoma: correlation between imaging parameters and tumor-stroma ratio. Eur Radiol. 2018 ;28(5):1875-1883.
Figures

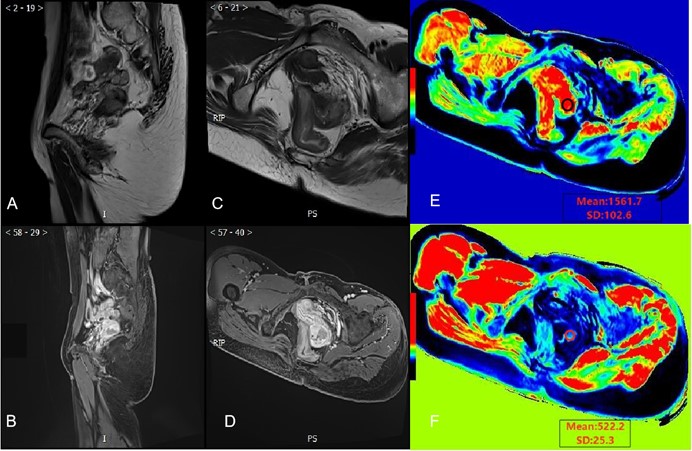
Figure 1: Images of a 47-year-old woman with pathologically characterized by exceeding deep 1/2 of stromal invasion.
A: Sagittal T2WI-TSE. B: Postcontrast sagittal T1WI-VIBE image. C: Axial T2WI-TSE. D: Postcontrast axial T1WI-VIBE image. E: Pre-contrast axial T1 mapping images with exemplary ROI placement in a solid tumor area. F: Corresponding postcontrast T1 mapping image, showing a relatively lower T1map value, and the final calculated ECV fraction is 52.21%.
