3996
Whole-lesion ADC histogram and texture analysis of preoperatively differentiating benign endometrial lesions from stage IA endometrial cancer1Diagnostic Radiology, National Cancer Center/National Clinical Research Center for Cancer/Cancer Hospital, Chinese Academy of Medical Sciences and Peking Union Medical College, Beijing, China, 2MR Research, GE Healthcare, Beijing, China
Synopsis
Making an accurate preoperative diagnosis of endometrial lesions is critical to avoid unnecessary surgical procedures and protect the patients’ fertility. Noninvasive pre-surgical evaluation of abnormalities in the uterine cavity remains to be challenging. The volumetric ADC histogram analysis provides a mechanism for quantifying the overall heterogeneity and comprehensive assessment of a given abnormality. We demonstrated that whole-lesion ADC histogram-based texture analysis could serve as a quantitative technique of differentiating benign endometrial lesions (BELs) from stage IA endometrial cancer (EC) preoperatively. The combined ADC histogram model showed high classification ability for both premenopausal and postmenopausal patients.
Introduction and Purpose
A global increase in the prevalence of endometrial pathologies parallels escalating levels of obesity, progressive aging of the population, and increasing trends in delaying childbearing1,2. It is vital to make an accurate preoperative diagnosis of endometrial abnormalities for radiologists and gynecologists, thus avoiding unnecessary surgical procedures and protecting the patients’ fertility. Endometrial sampling biopsy with curettage or hysteroscopy serves as the mainstay of diagnosis, while it is invasive and not always possible. In cases with inconclusive sonographic findings, MRI is recommended for further evaluation. Nevertheless, pre-surgical evaluation of abnormalities of the uterine cavity by conventional MRI remains to be challenging3. The aim of this study was to assess the value of whole-lesion ADC histogram and texture analysis in differentiating benign endometrial lesions (BELs) from stage IA endometrial cancer (EC) preoperatively.Methods
This retrospective study was approved by our institutional review board, with a waiver of written informed consent. A total of 232 patients (106 BELs and 126 stage IA EC) were retrospectively enrolled with preoperative MRI using 3.0T scanners (Signa HDxt and Discovery MR 750, GE Medical System). Benign pathologies included endometrial polyp (n=36), endometrial hyperplasia without atypia (n=8), and atypical endometrial hyperplasia (n=62). The volume of interest (VOI) covering the whole tumor was manually drawn along the boundary of the tumor or entire endometrium (if without visible tumor) on all slices of DWI images (b=800s/mm2) by two radiologists. Eighteen volumetric histogram parameters were extracted from the ADC map of each lesion. Inter- and intra-observer agreements of ADC histogram parameters were determined by calculating the intraclass correlation coefficients (ICC). The Mann-Whitney U or Student’s t-test was used to compare the differences between the two groups. Models based on clinical parameters and histogram features were established using multivariate logistic regression. ROC analysis and calibration curves were used to assess the models. Model internal validation was performed by the enhanced bootstrap resampling (n=1000). Statistical analyses were performed using R software (version 4.0.3; http://www.Rproject.org).Results
All measurements of whole-lesion histogram analysis showed excellent intra- and inter-observer reliability (ICC = 0.955-0.998 and ICC =0.926-0.987, respectively). Representative cases of BELs and stage IA EC are presented in Figure. 1. Stage IA EC showed significant lower ADC10th, ADC90th, ADCmin, ADCmax, ADCmean, ADCmedian, interquartile range, mean absolute deviation, robust mean absolute deviation (rMAD), root mean squared, energy, total energy, entropy, variance, and significant higher skewness, kurtosis and uniformity than BELs (all p < 0.05; Figure.2). Among them, ADCmedian yielded the highest AUC of 0.928 (95 % CI: 0.895-0.960; cut-off value = 1.161 × 10⁻³ mm2/s; sensitivity = 88.9 %; specificity = 83.0 %) for differentiating BELs from stage IA EC, followed by ADCmean, RMS, and ADC10th (Table 1). Multivariate analysis demonstrated ADC-score (ADC10th + rMAD + total energy + skewness) was the only significant independent predictor (OR = 2.641, 95% CI: 2.045-3.411; p<0.001) for stage IA EC,when considering clinical parameters (Table 2). This ADC histogram model (ADC-score) achieved an AUC of 0.941 and bias-corrected AUC of 0.937, and performed well for both premenopausal (accuracy = 0.871) and postmenopausal (accuracy = 0.905) patients (Figure.3).Discussion and Conclusion
Whole-lesion ADC histogram analysis represents texture-based statistics of the variation and frequency of ADC values within a given tissue and assesses deviation of the histogram from a normal distribution as a marker of structural heterogeneity and complexity. Most previous studies demonstrated greater heterogeneity in more aggressive lesions4,5. Besides the quantitative ADC values, it was rational that texture-based features, such as rMAD, total energy, and skewness, could effectively discriminate these two lesions with distinct neoplasia-related cellularity. In conclusion, whole-lesion ADC histogram and texture analysis can be helpful for noninvasive preoperative differentiation of BELs from stage IA EC and personalized clinical management for both premenopausal and postmenopausal patients.Acknowledgements
The authors acknowledge grant support from the Special Research Fund for Central Universities, Peking Union Medical College (No. 3332021032).References
Figures

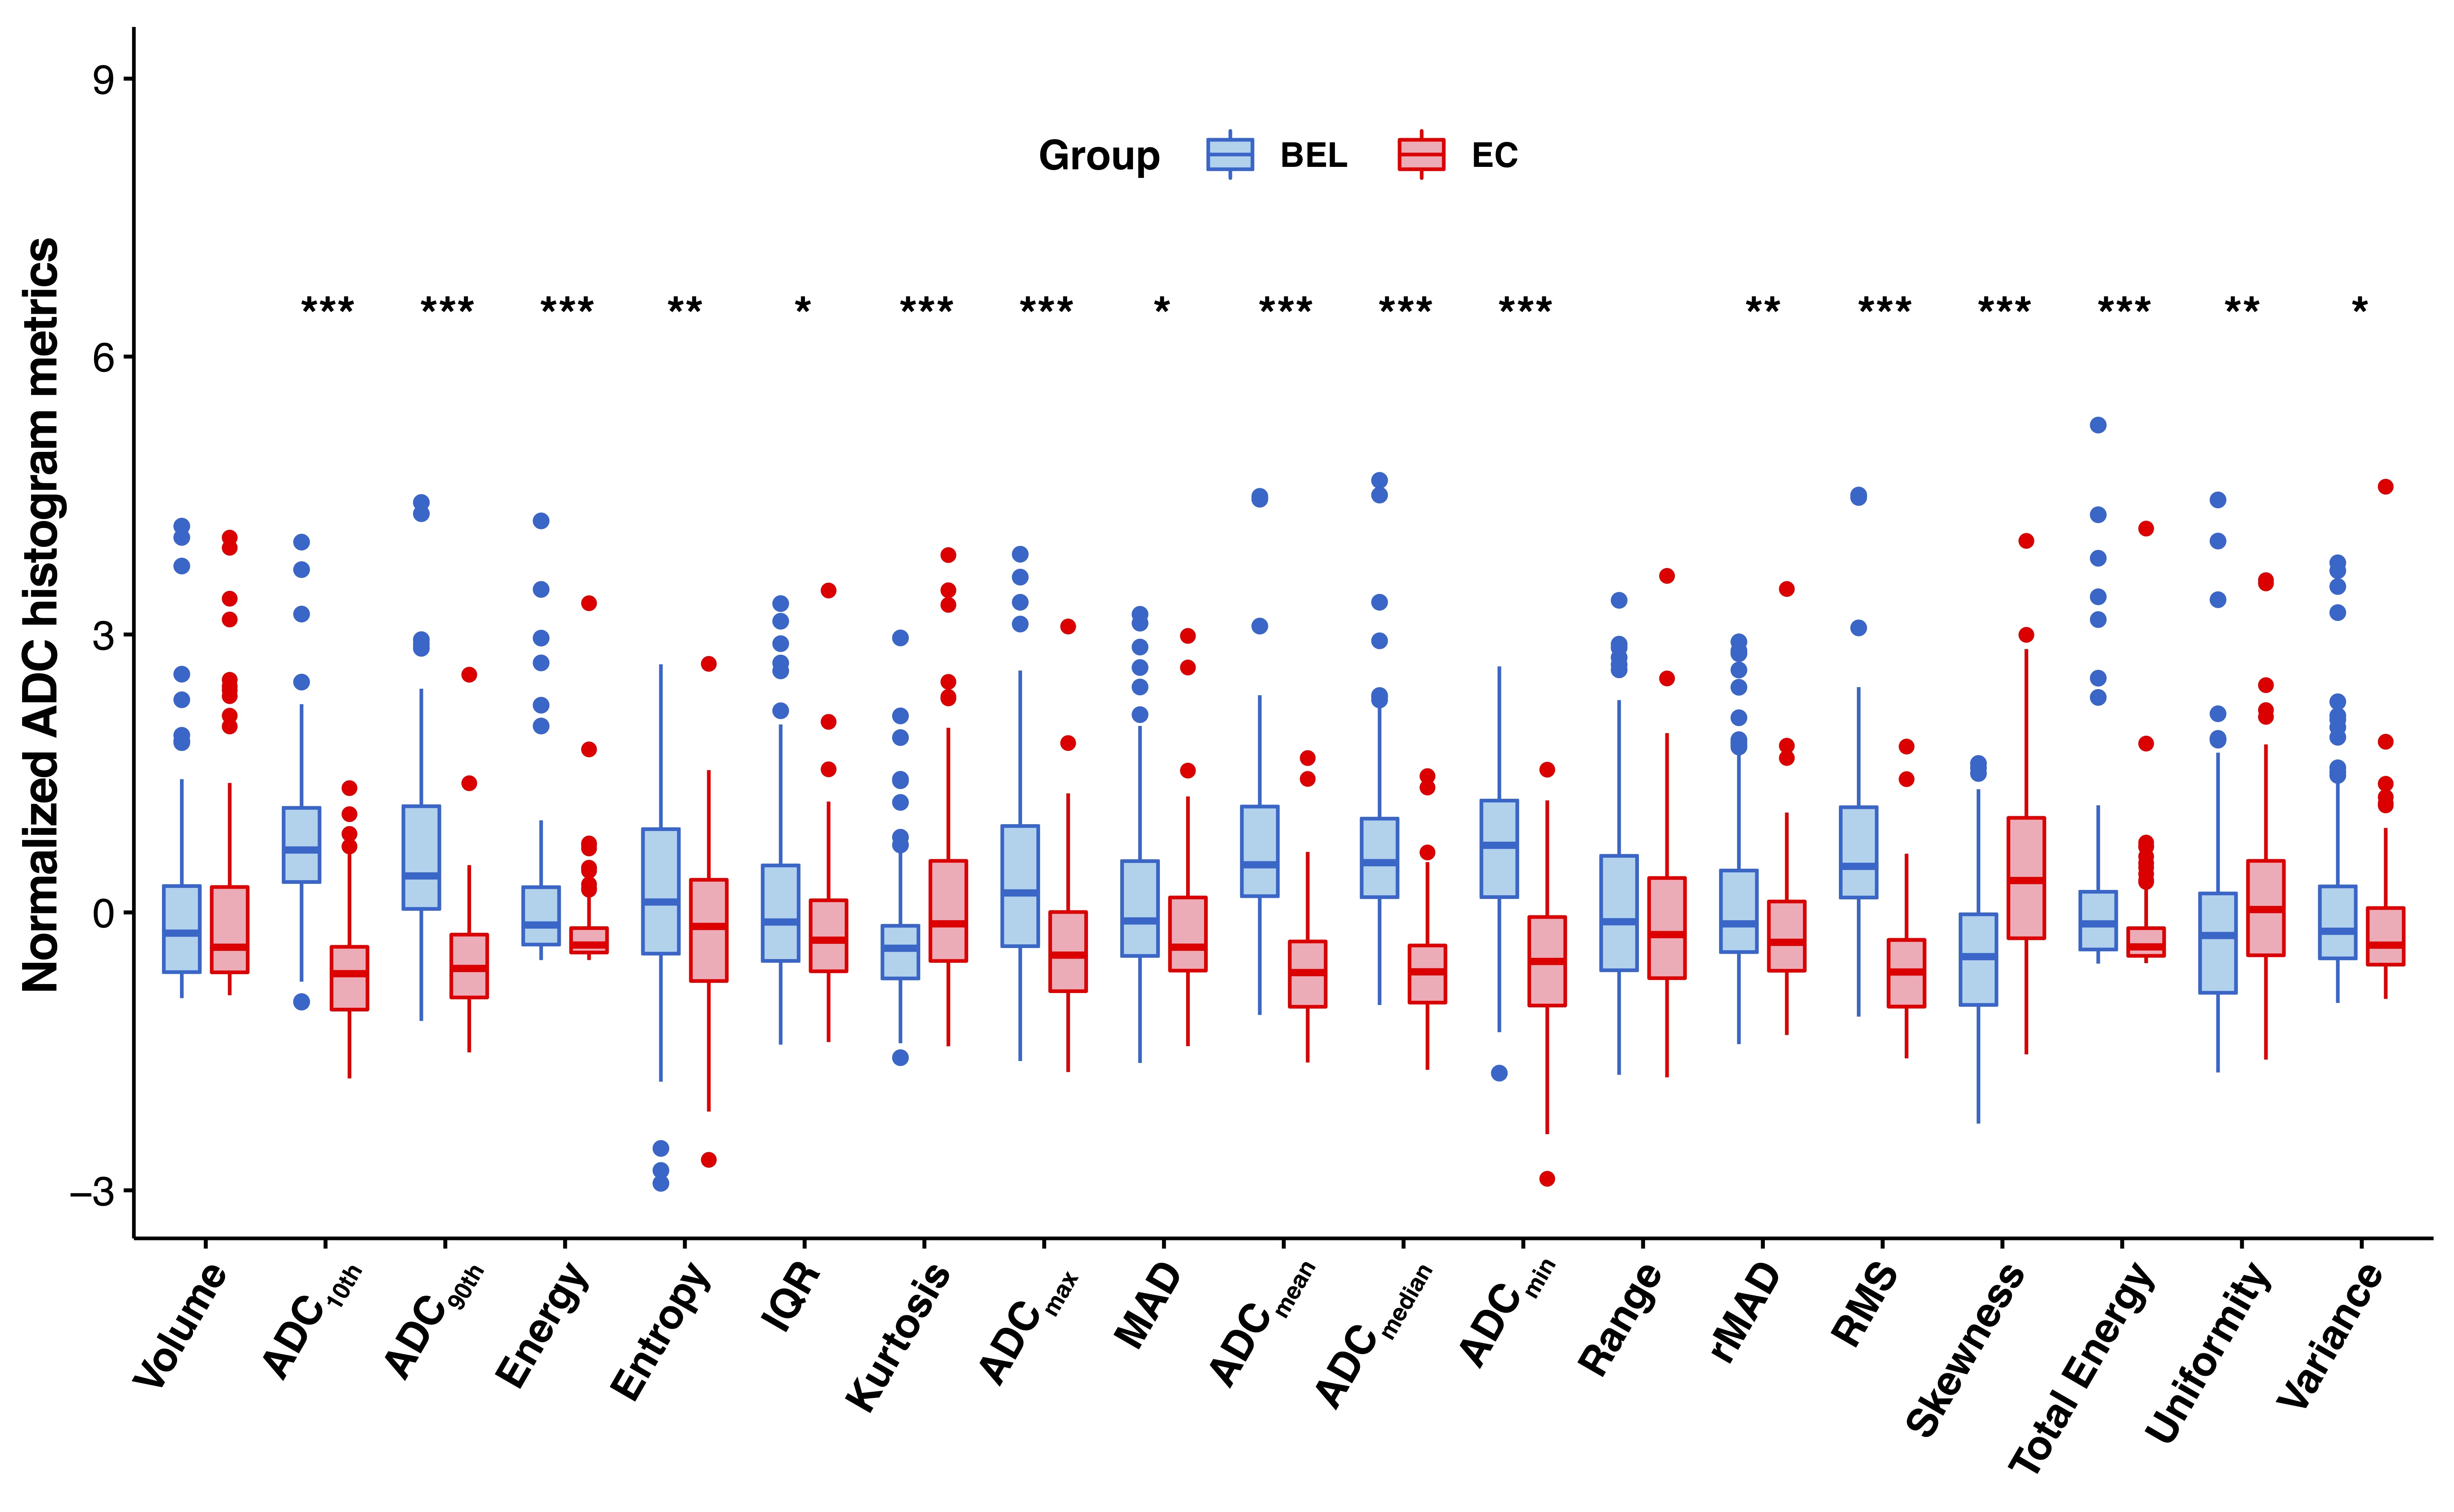
Figure.2 Boxplots graphically depict the quartiles and distributions of normalized volumetric ADC histogram parameters between benign endometrial lesions (BELs) and stage IA endometrial cancer (EC). The colors are grouped by histopathological results: BEL in red, EC in blue. Significance level: *p < 0.05, **p < 0.01, ***p < 0.001.
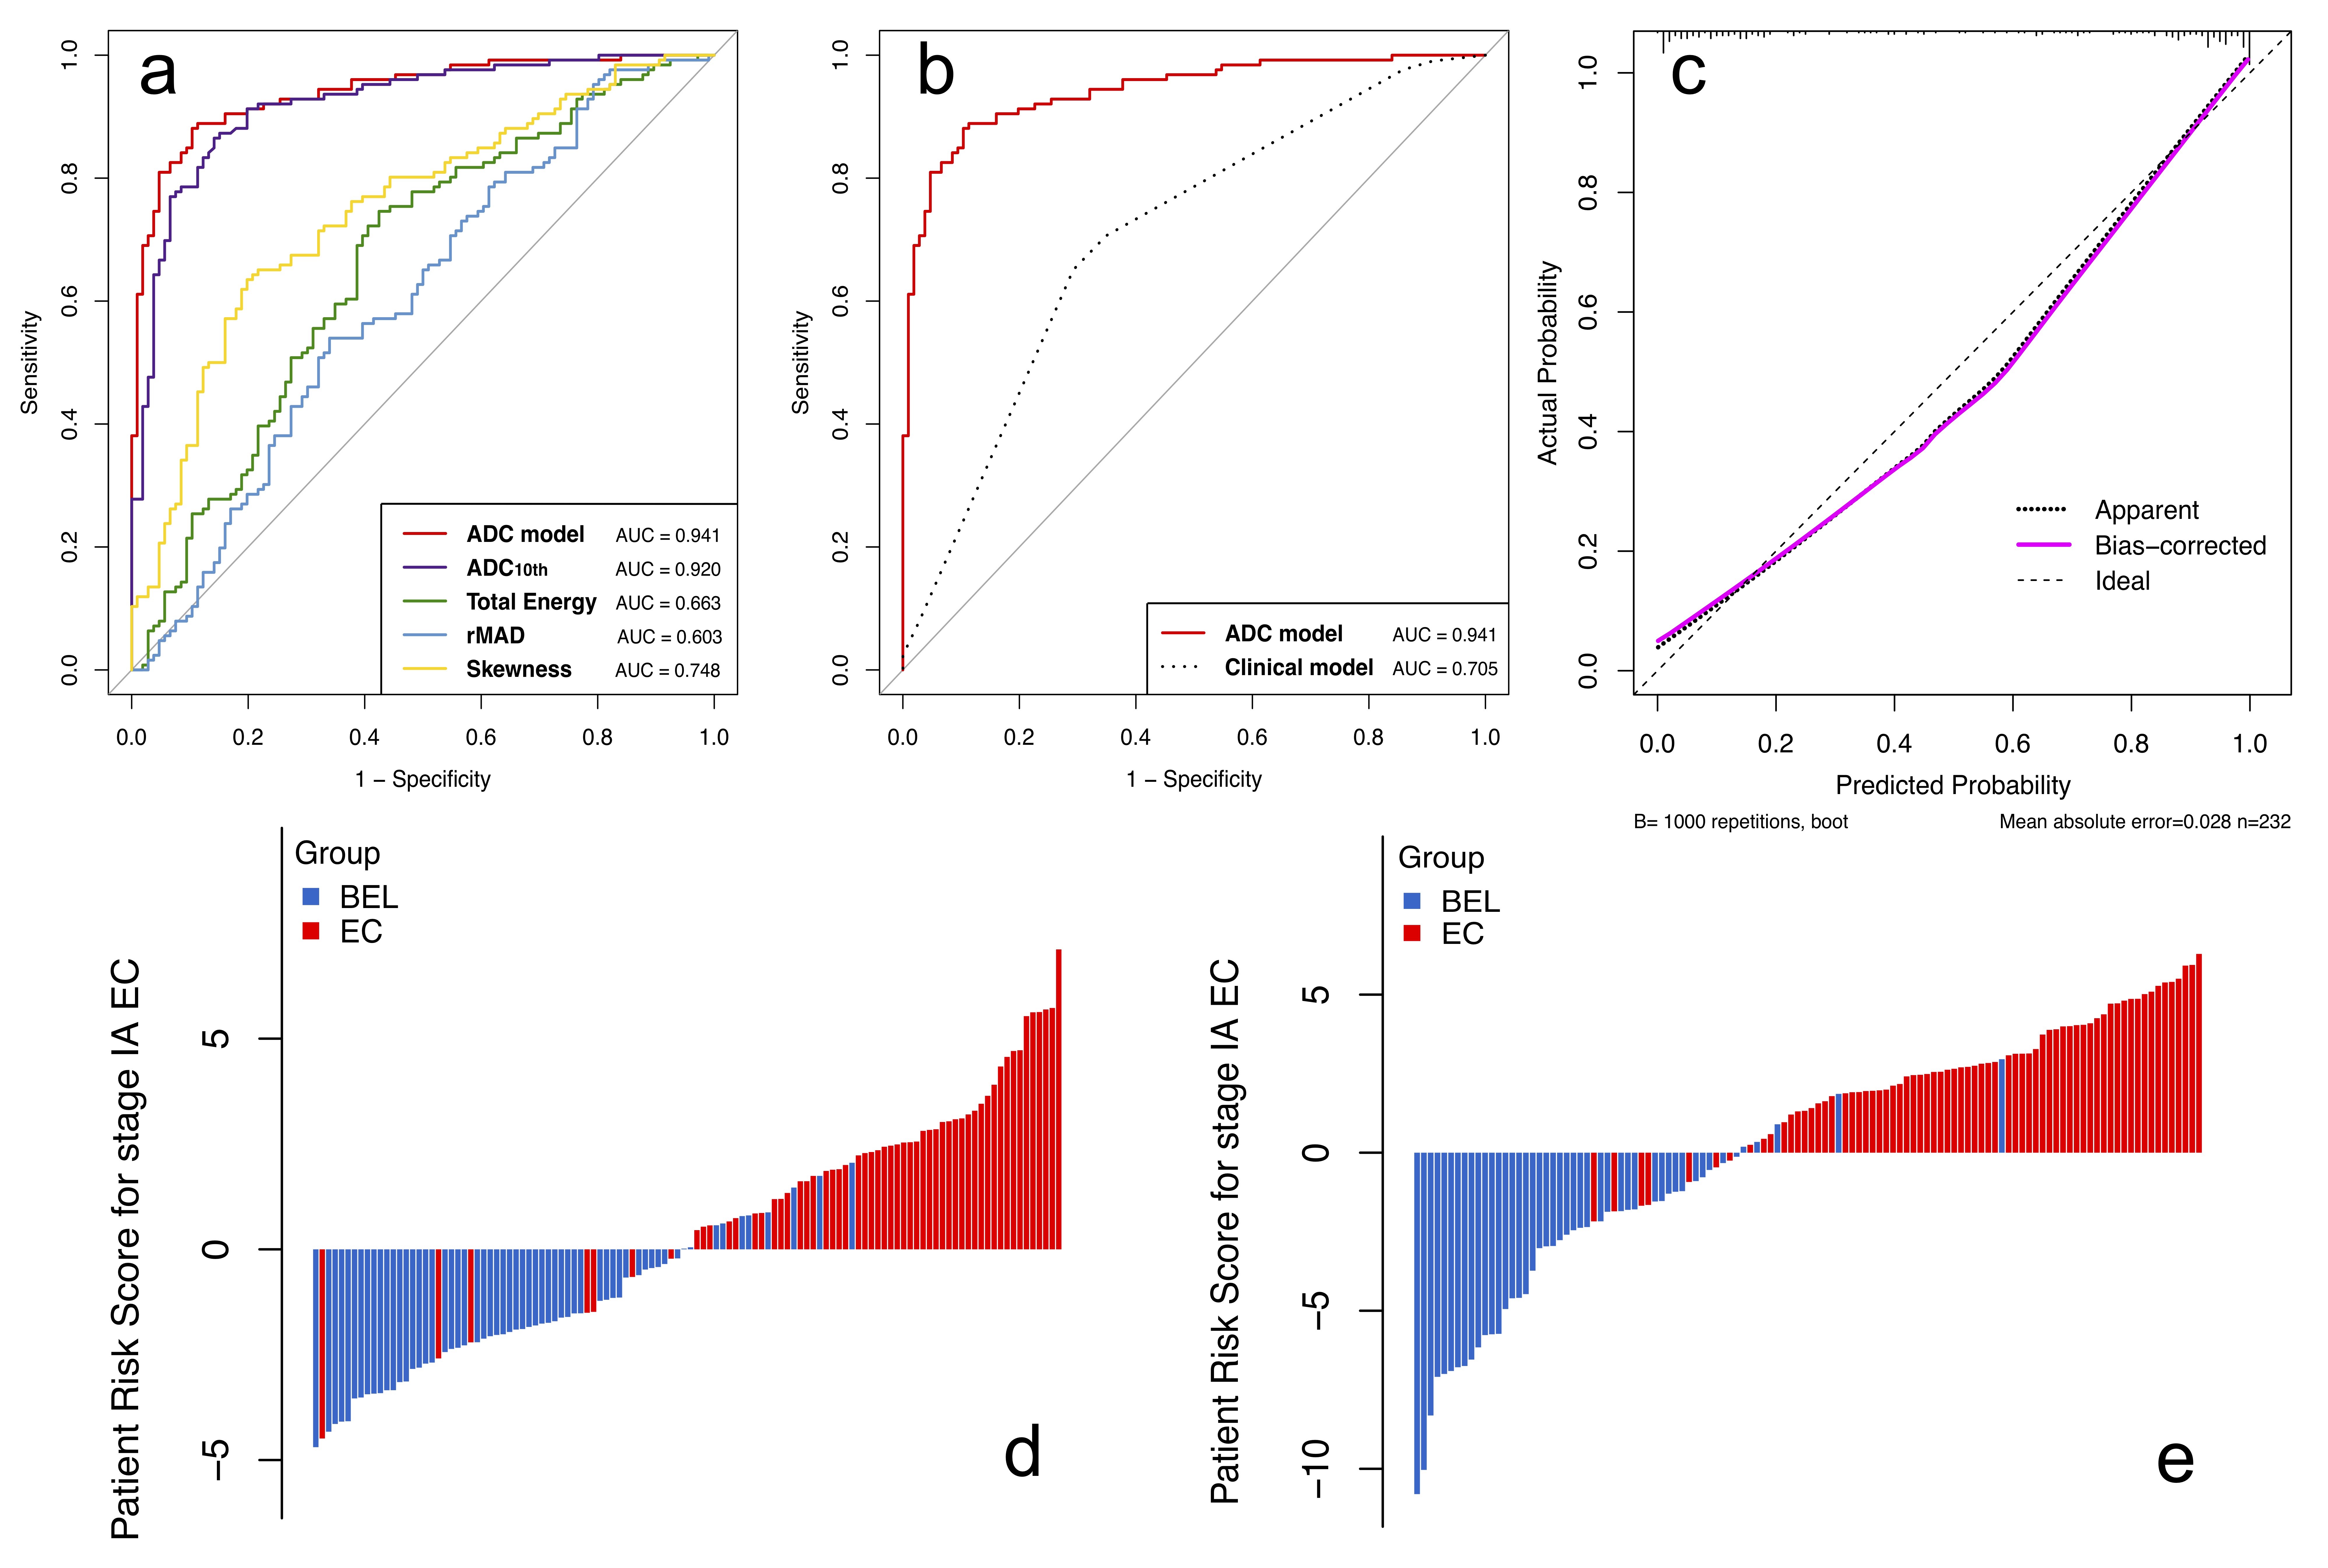
Figure.3 (a) ROCs of the ADC histogram parameters and combined ADC histogram model. (b) ROCs of the ADC histogram model and clinical model. (c) The calibration plot of the ADC histogram model. Patient risk scores output by the ADC histogram model for (d) premenopausal and (e) postmenopausal patients, while red bars show scores for those who have stage IA endometrial cancer.
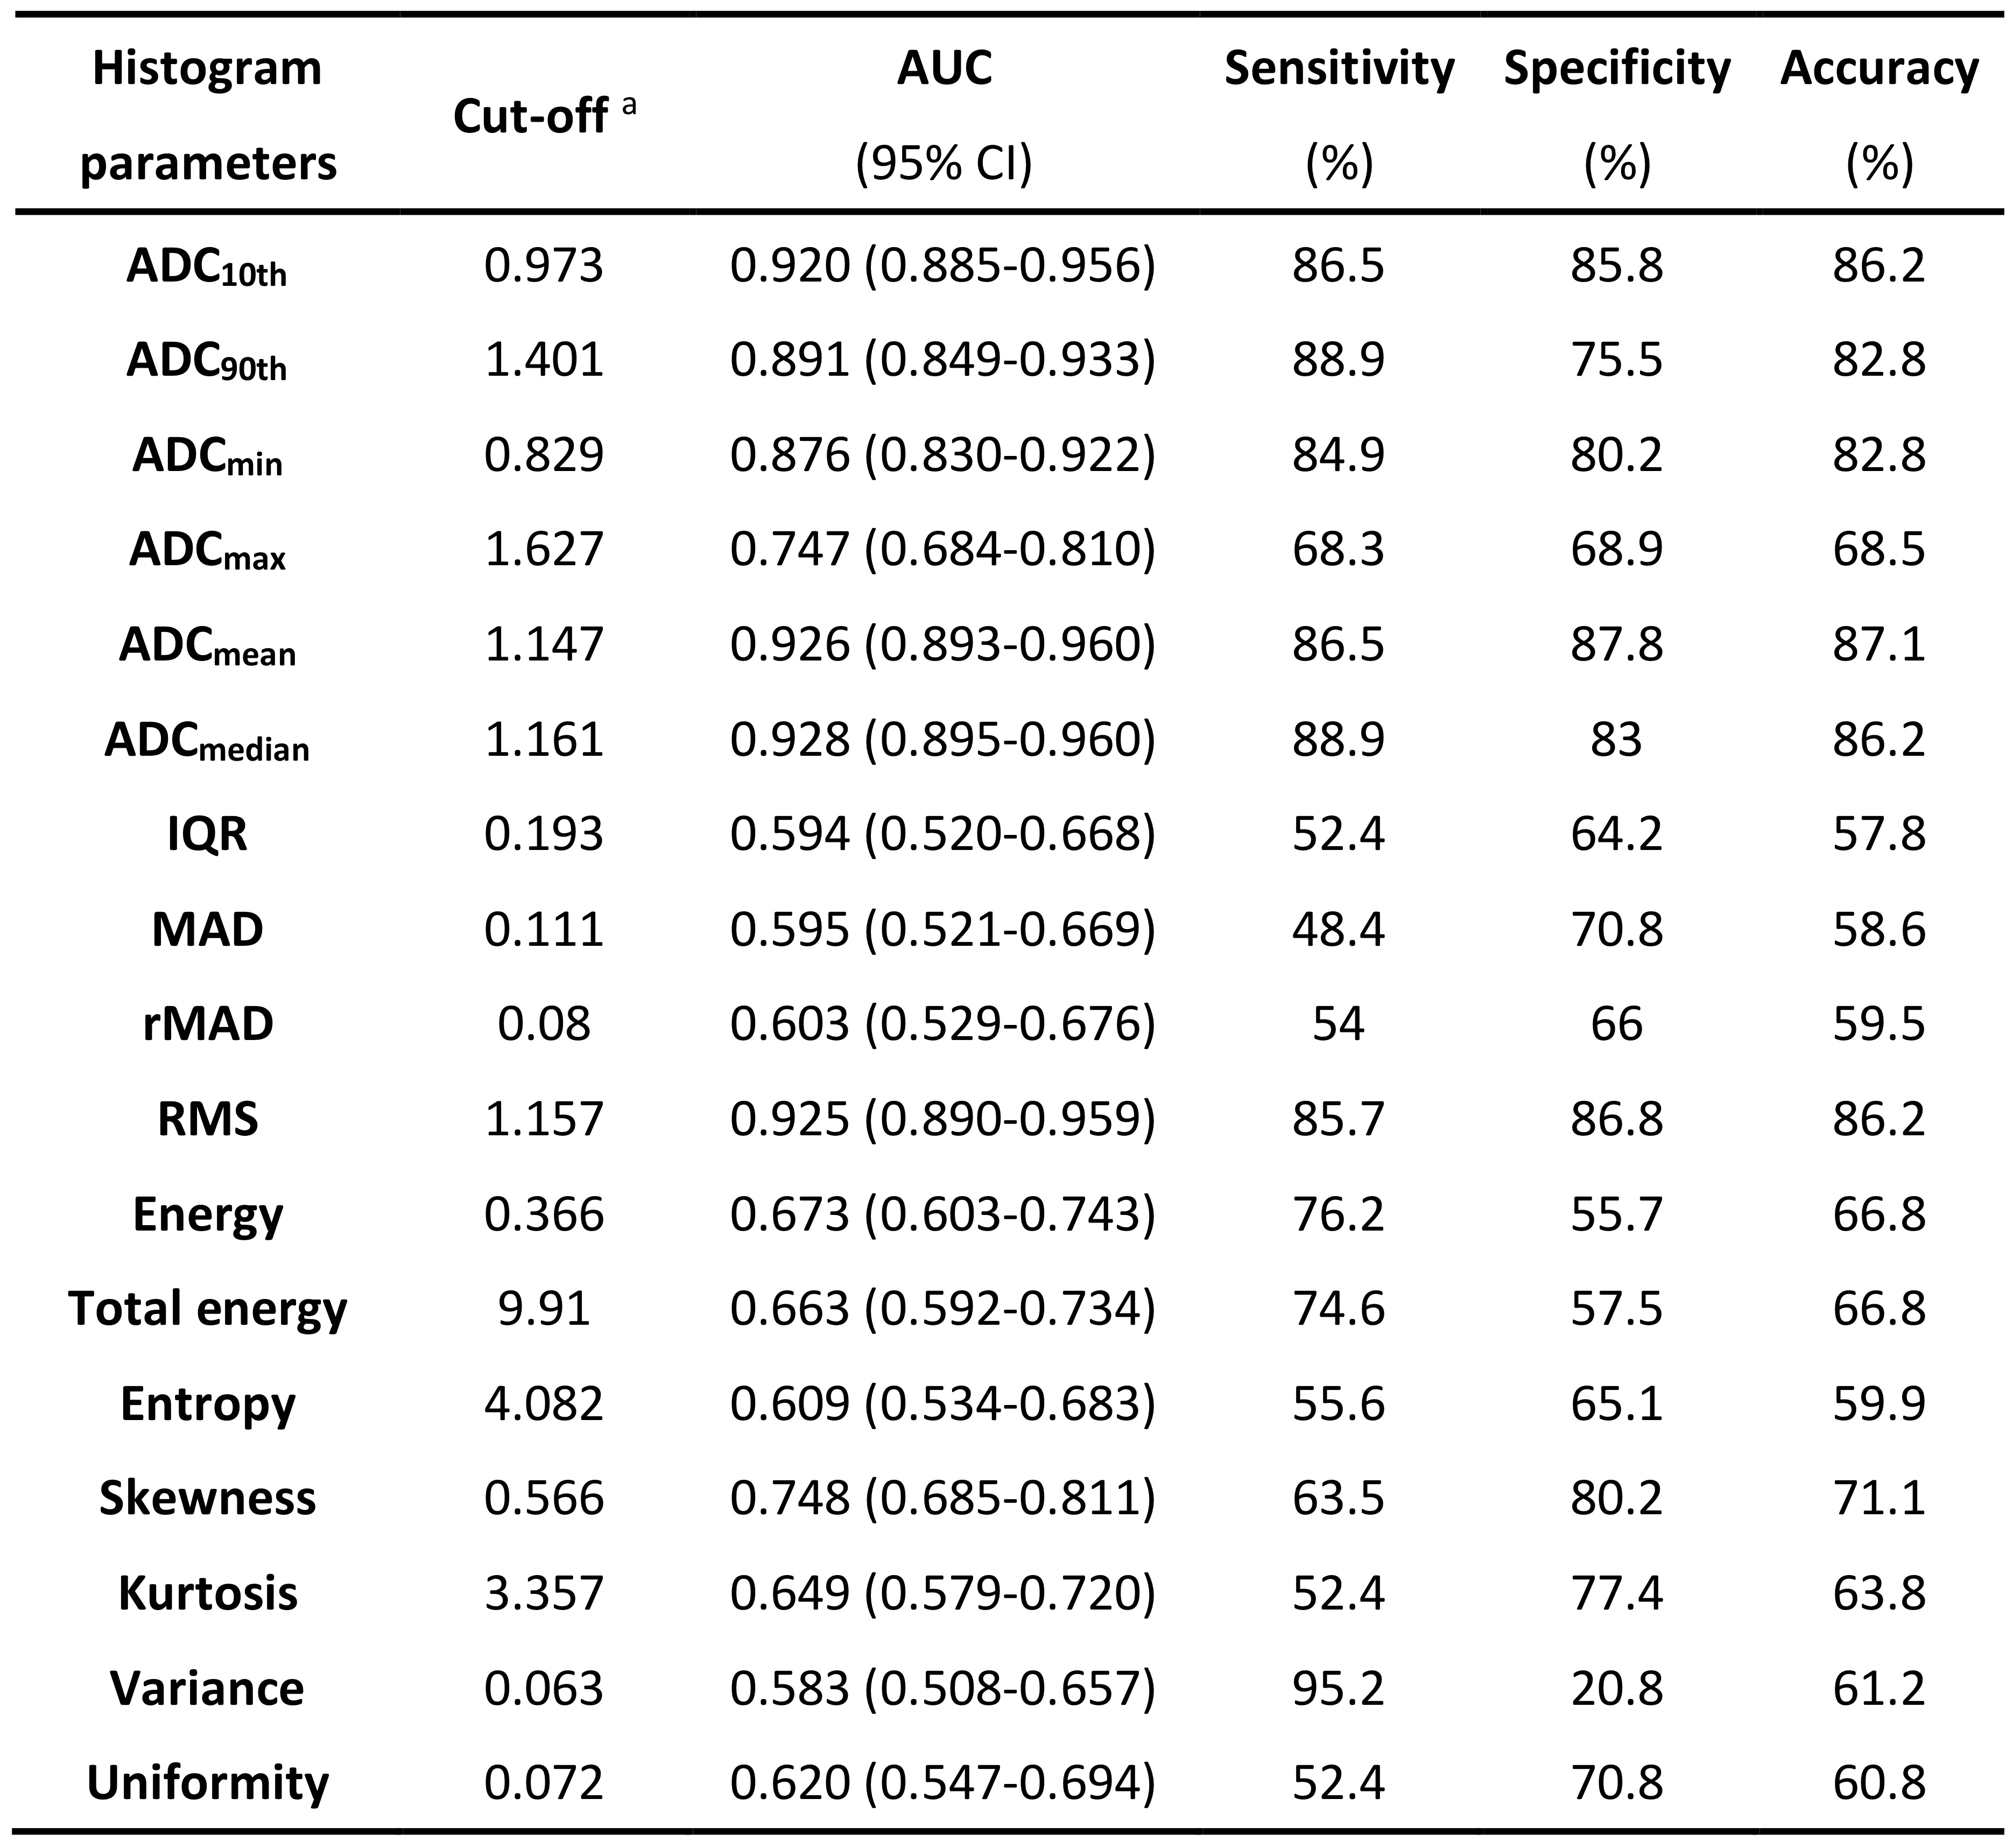
Table 1. Diagnostic performance of volumetric ADC histogram parameters in differentiating between benign endometrial lesions (BELs) and Stage IA endometrial cancer (EC).
aAll ADC values and interquartile range (IQR) are in units of 10-3mm2/s. Energy, total energy, mean absolute deviation (MAD), robust mean absolute deviation (rMAD) and root mean squared (RMS) are in the units of 10-3. Entropy, kurtosis, skewness, uniformity and variance are in the units of 10-6.
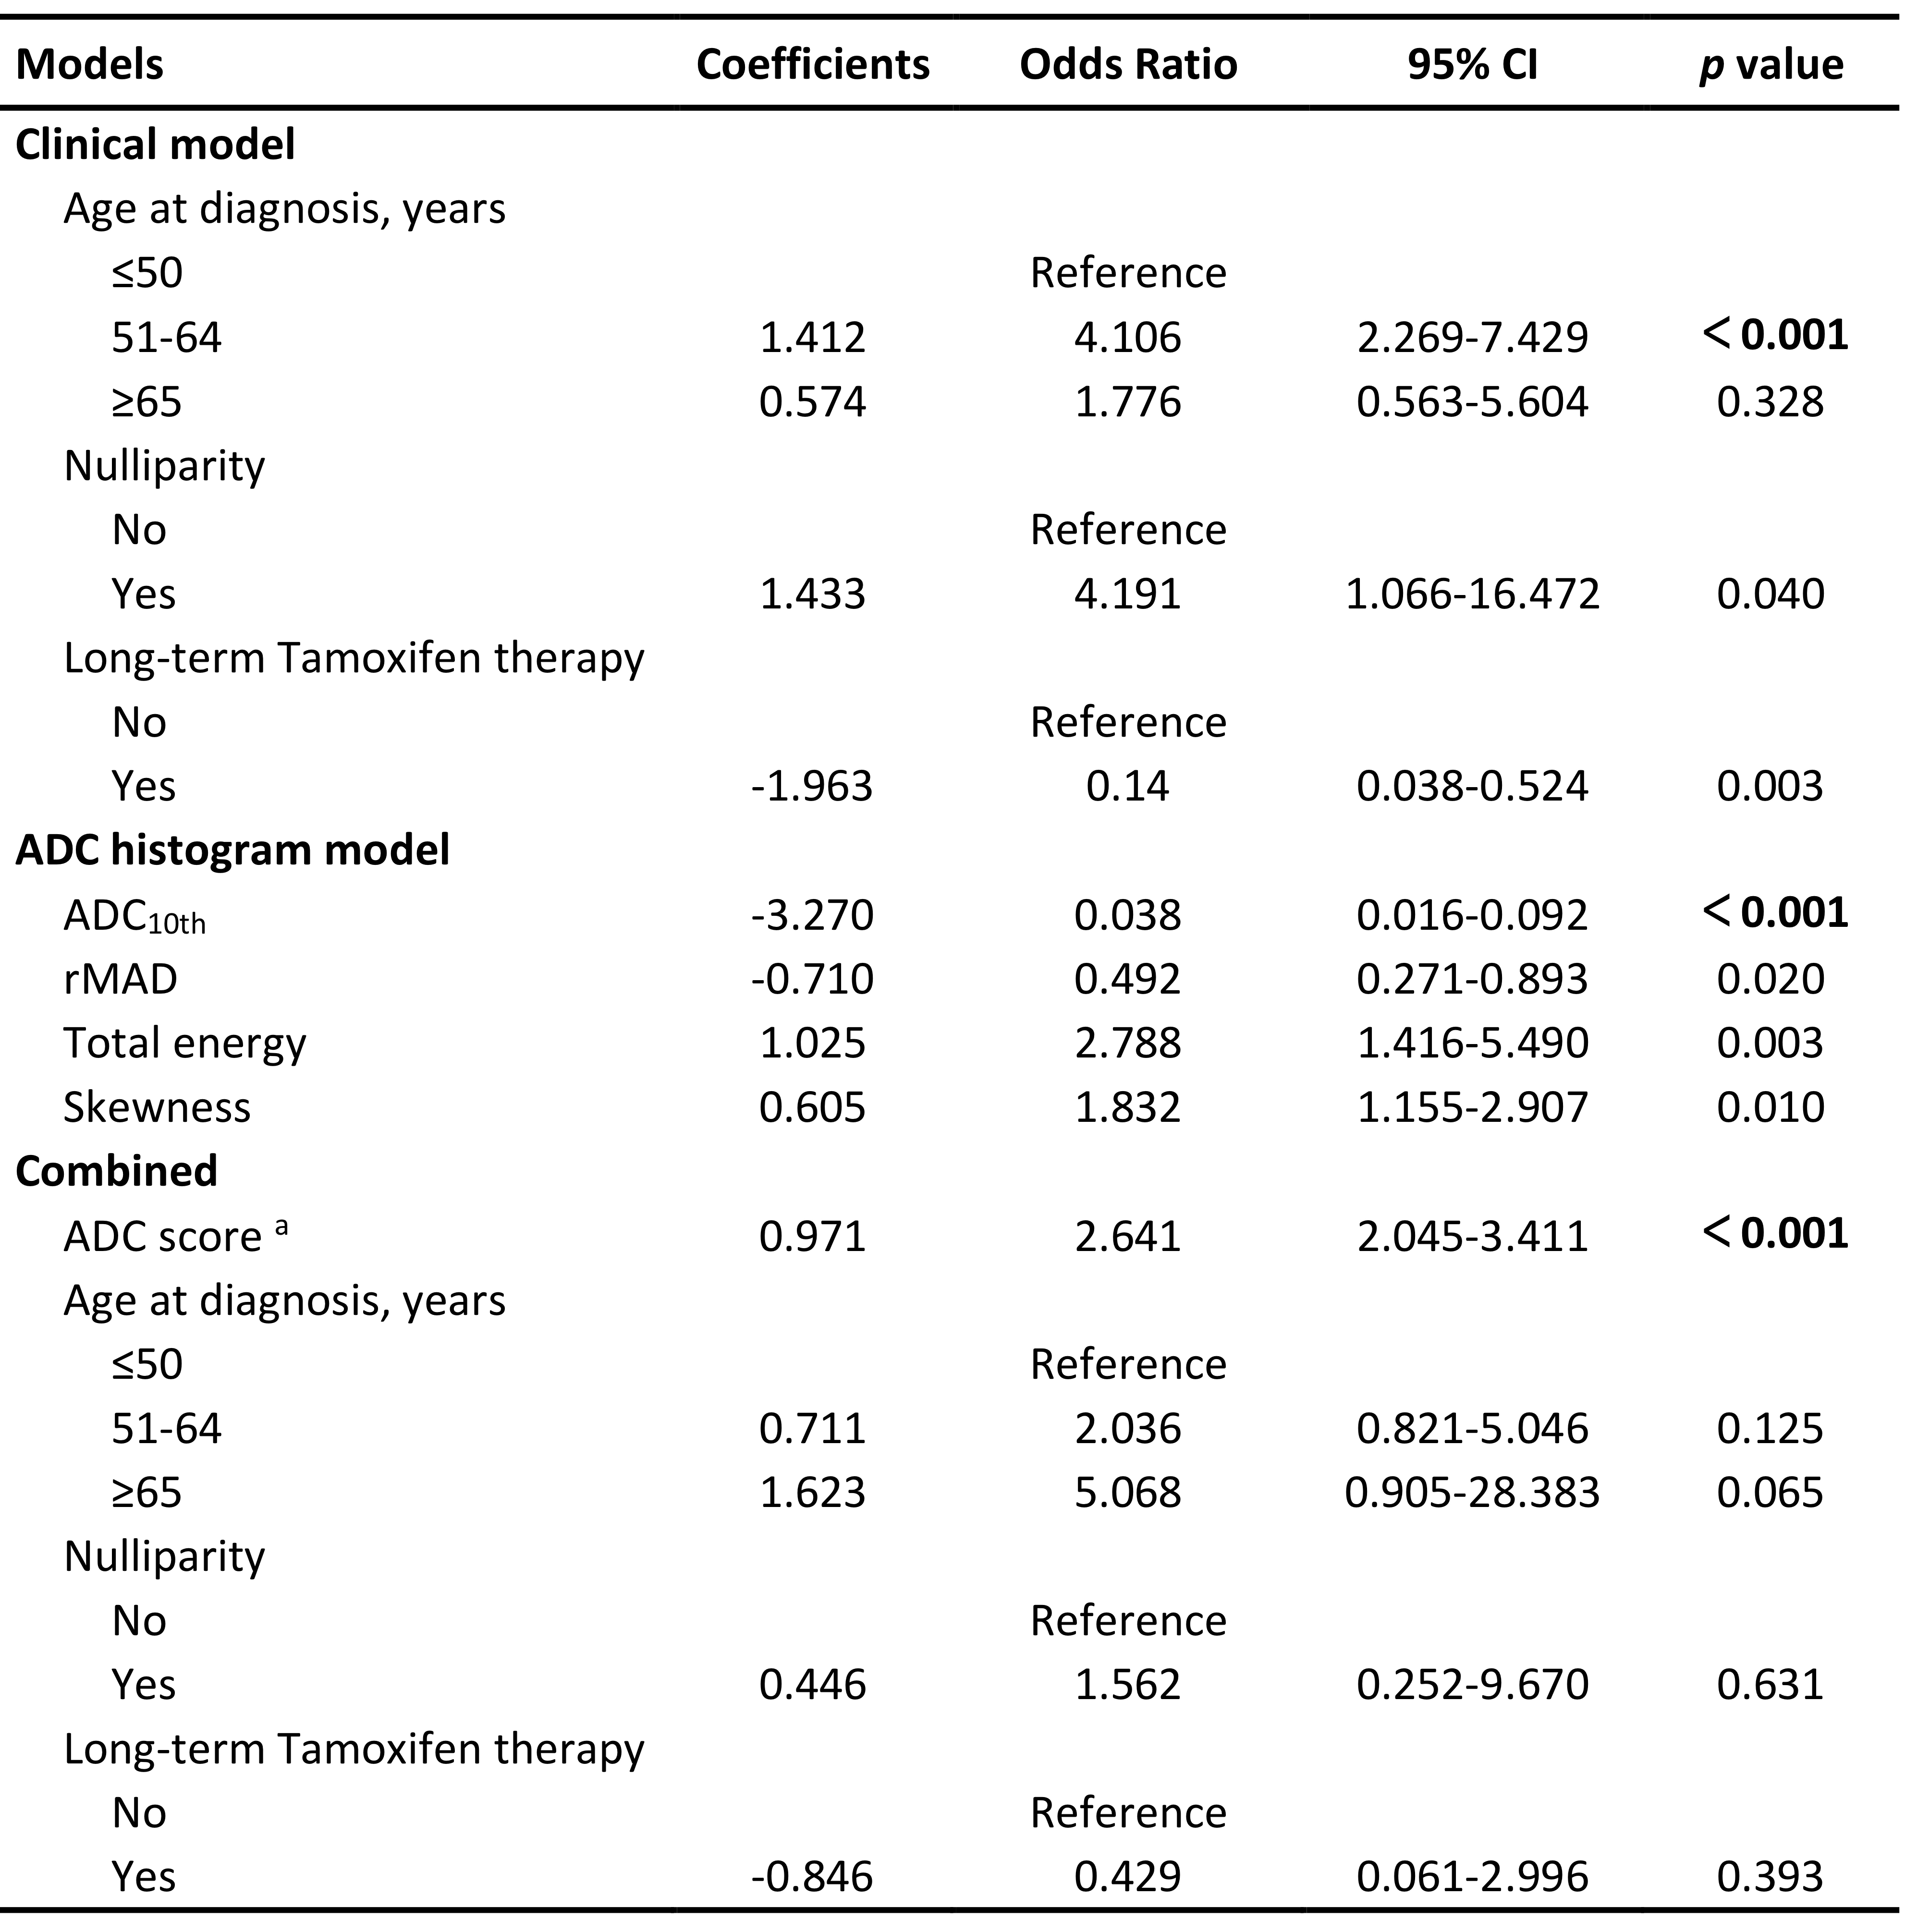
Table 2. Results of multivariate logistic regression models for differentiating BELs from Stage IA EC.
aADC score = 0.257 + -3.270× ADC10th + -0.710× rMAD + 1.025× total energy + 0.605× skewness. All ADC histogram features were standardized by Z-score normalization.