3995
Multi-site, longitudinal assessment of quantitative breast MRI variability using the CaliberMRI phantom1University of California, San Francisco, San Francisco, CA, United States, 2CaliberMRI, Boulder, CO, United States, 3National Institute of Standards and Technology, Boulder, CO, United States
Synopsis
Quantitative breast MRI data was acquired at seven clinical sites using the CaliberMRI phantom. T1 and DWI data were acquired, and the qCal software was used for analysis. Protocol adherence was assessed, quantitative measures were automatically derived, and variability between measurements was evaluated. Going forward, the phantom will be used for calibration as part of a program to assess quantitative accuracy in a large multi-site clinical trial. The phantom program will be expanded to other sites in the trial, with standardized reporting used to understand variability across sites.
Introduction
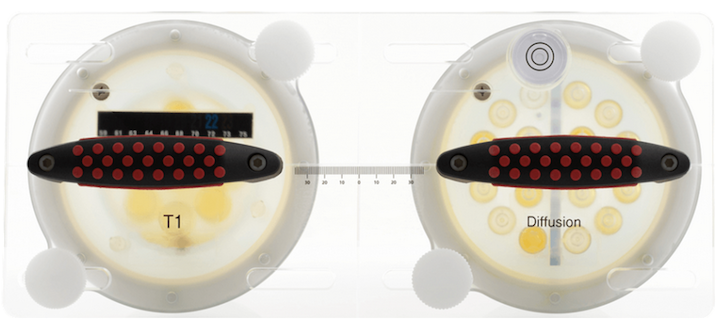
Quantitative MRI phantoms allow standardized measurements derived from MRI to be compared longitudinally across sites and vendors. Measurements can be repeated at sites over time, and scan protocols can be optimized to improve image quality and measurement accuracy. A breast phantom-based calibration program using the CaliberMRI Breast Standard Model 131 (CaliberMRI, Boulder CO) is being implemented in the I-SPY 2 trial, a multi-site clinical trial for patients with early-stage breast cancer.The phantom, developed in collaboration with UCSF and NIST, includes T1 and diffusion subunits (figure 1).
The phantom can be used to assess the accuracy and precision of T1 and T2 values, apparent diffusion coefficient (ADC) measurements, spatial resolution, signal-to-noise ratio (SNR), fat suppression, gradient non-linearity, system center frequency drift, B0 and B1 non-uniformity, and geometric distortion1. MRI-visible liquid crystal (LC) thermometer measurements allow precise calculation of ADC for tissue and fat mimics within the phantom, and comparison can be made to NIST values2.
The purpose of this study was to assess the variability in quantitative measurements across I-SPY 2 clinical sites by distributing the phantom to a subset of sites for monthly calibration scans.
Methods
In collaboration with CaliberMRI, phantoms were distributed to four I-SPY 2 clinical sites in June 2021. Three additional sites already had phantoms. The scan acquisition protocol used for I-SPY 2 patient MRI exams was modified for the phantom calibration scans, and a comprehensive manual was created for distribution to sites. Using the modified scan protocol, sites acquired T1-weighted (T1-w) images that can be used to evaluate fat suppression and SNR. In addition, DWI acquisitions can be used to assess image quality issues, including SNR, distortion, and fat suppression, and to improve the accuracy of calculated ADC values. An internal MRI-visible LC thermometer was used for automated temperature corrections when calculating the bias of ADC measurements with respect to the NIST tabulated values. The external LC temperature strip provided additional information about phantom temperature.Sites were instructed to allocate one hour of scan time per month to scan the phantom and were asked to store the phantom in the scan room for temperature equilibration. At least 24 hours before the scan, the phantom was inspected for abnormalities. The phantom was scanned in the breast coil used for clinical scans. The scan protocol included the following sequences: 3D localizer; NFS T1-w; FS T1-w (repeated four times); NFS T1-w for internal thermometry measurement; 2-b value DWI (repeated four times); NFS T1-w. External temperature was recorded before and after the scan.
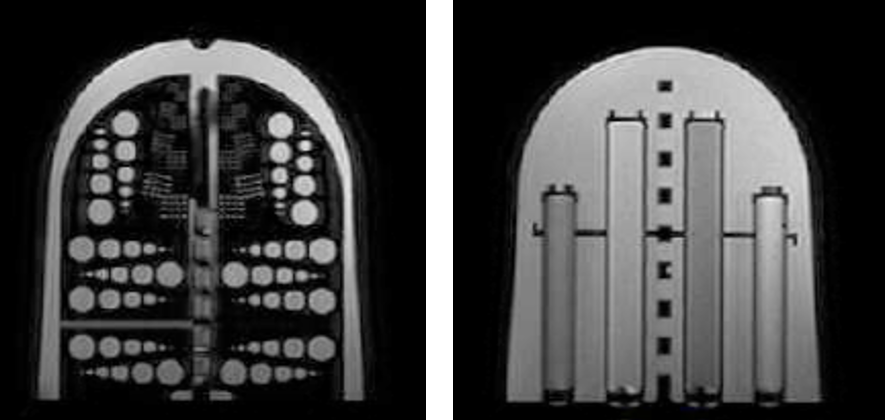
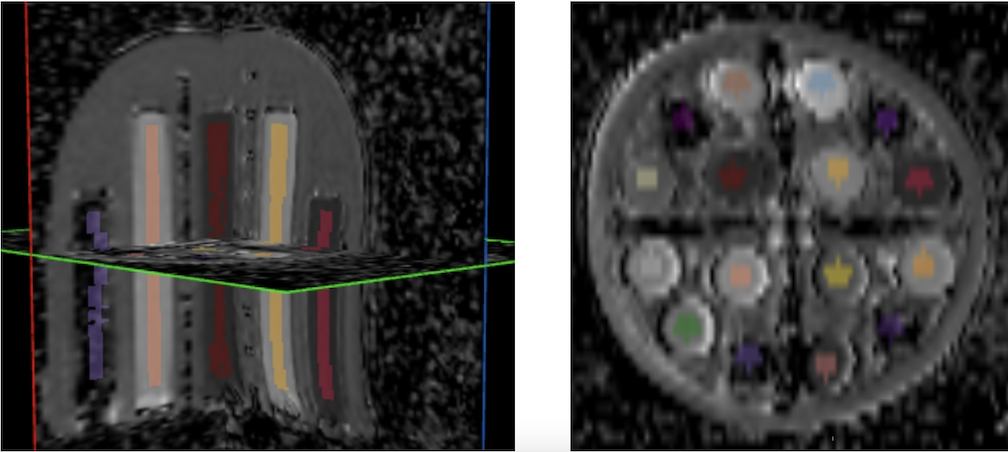
Scans were submitted to the TRIAD software (American College of Radiology, Reston, VA) and starting and ending temperature were reported. CaliberMRI used the qCal software for analysis. Figure 2 shows images from the DWI subunit, and figure 3 shows automated qCal regions of interest (ROIs) in the DWI subunit.
Results
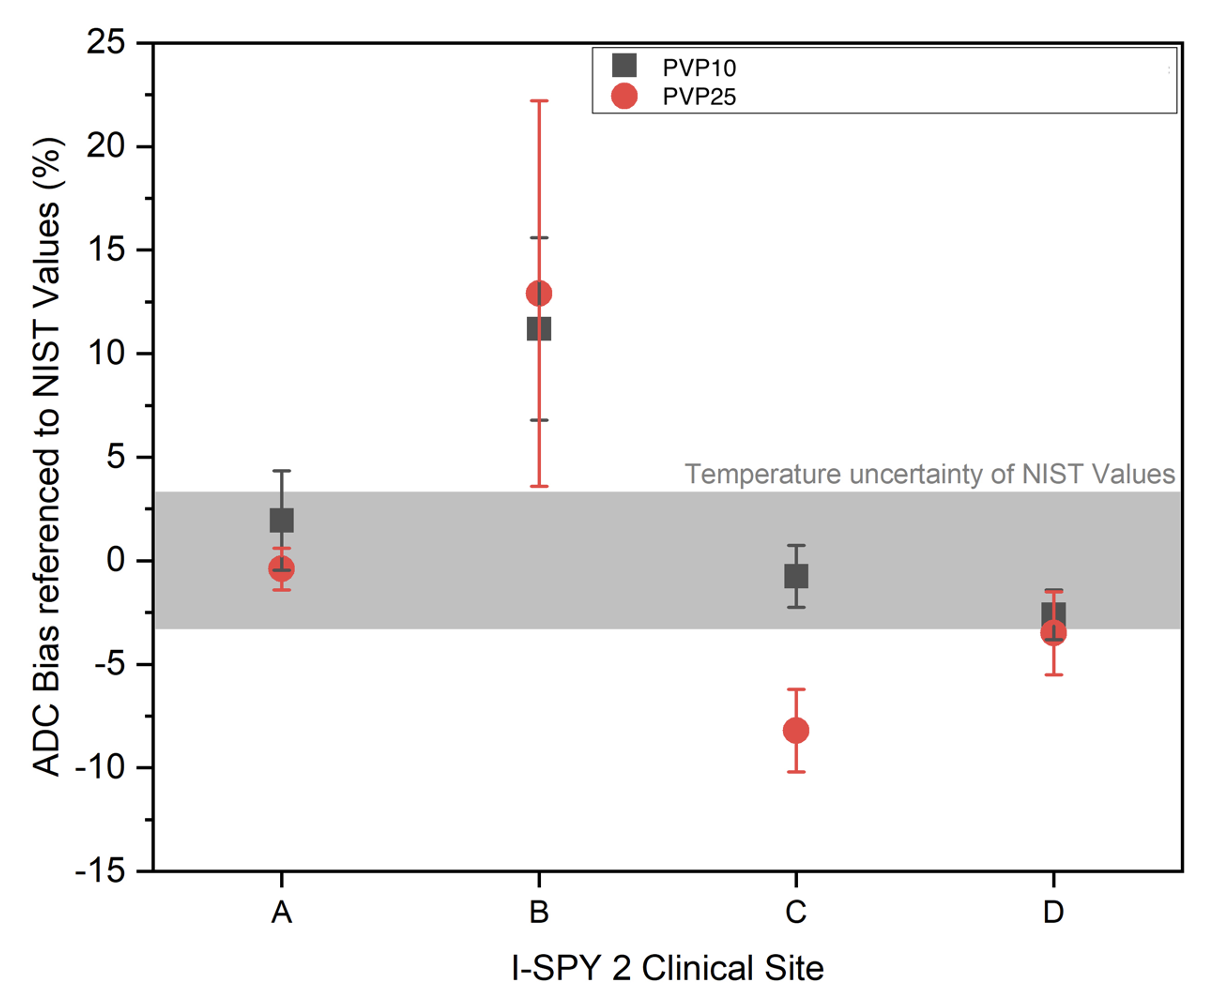
To date, 17 phantom scans were submitted by seven sites. Two sites have performed monthly calibration scans since receiving phantoms in June. All exams were at least partially adherent to protocol parameters. Minor issues with protocol adherence were documented, and feedback was given to sites for future scans.Mean bias in ADC was automatically calculated by the qCal software. Representative ADC values were measured in the fibroglandular tissue mimic (PVP 10, higher ADC) and the malignant tissue mimic (PVP 25, lower ADC). Figure 4 shows the bias in mean ADC relative to NIST reference values for four I-SPY 2 sites (sites A-D). Variation between sites is demonstrated. For example, fibroglandular and malignant tissue mimic values for site A fall within the expected NIST range, while values for site B are outside the expected range (12% positive bias for both higher and lower ADC values).
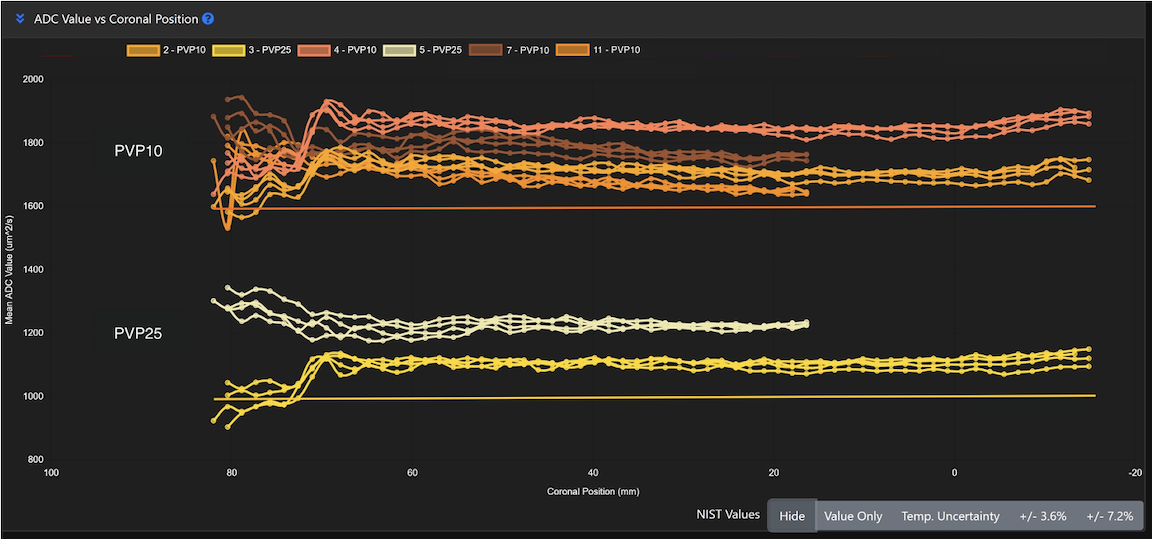
Figure 5 shows spatial variation in ADC values for fibroglandular and malignant tissue mimics moving from the anterior chest plate to the posterior aspect of the phantom for Site B. Measurements are shown for four fibroglandular tissue mimics (PVP 10) and for two malignant tissue mimics (PVP 25). Values for both mimics are higher than the NIST reference values but do not show major variations in the anterior-posterior direction. Clustering of ADC values from four repeat DWI acquisitions during the same scanning session indicate that test-retest repeatability for this site is generally high. Larger location-dependent differences in ADC were observed, likely due to gradient non-linearity.
Discussion
Prior work emphasized the need to use phantoms to validate imaging biomarkers and assess their repeatability and reproducibility across time at different sites using multiple vendors3. The multi-site data from this study demonstrate the feasibility of deploying a phantom to clinical sites and provide insight into potential root causes of variability between sites. This information can be used for troubleshooting with site personnel and vendors.Conclusion
Phantom data is being integrated into a study-wide quality monitoring program in I-SPY 2 to assess quantitative imaging performance. This work is in progress, and more information on variability between sites and vendors will be available as additional data is collected and analyzed.Acknowledgements
NIH/NCI R01 CA132870, U01 CA225427References
1. Imaging Phantoms and Software for qMRI Standardization- CaliberMRI. https://qmri.com/.
2. Wilmes, L. (ISMRM 2020) Multi-site evaluation of MR breast phantom with internal MR-visible liquid crystal thermometer: initial temperature and DWI measurements. https://archive.ismrm.org/2020/4777.html.
3. Keenan, K. E. et al. Quantitative magnetic resonance imaging phantoms: A review and the need for a system phantom. Magn. Reson. Med. 79, 48–61 (2018).
Figures