3994
Association of Fibroglandular Tissue ADC features on Diffusion-weighted MRI with Breast Cancer Risk
Wesley Surento1, Anum S. Kazerouni2, Janis Yee2, Debosmita Biswas2, Daniel S. Hippe3, Habib Rahbar2, and Savannah C. Partridge2
1Department of Biomedical Informatics and Medical Education, University of Washington, Seattle, WA, United States, 2Department of Radiology, University of Washington, Seattle, WA, United States, 3Clinical Research Division, Fred Hutchinson Cancer Research Center, Seattle, WA, United States
1Department of Biomedical Informatics and Medical Education, University of Washington, Seattle, WA, United States, 2Department of Radiology, University of Washington, Seattle, WA, United States, 3Clinical Research Division, Fred Hutchinson Cancer Research Center, Seattle, WA, United States
Synopsis
In this study, we investigated the association of fibroglandular tissue (FGT) apparent diffusion coefficient (ADC) measures with risk of breast cancer. Whole breast FGT regions were segmented on diffusion-weighted MRI (DWI) using a semi-automated fuzzy c-means-based algorithm. In high-risk screening cohort, ADC measures of FGT were compared in subjects with subsequent cancer diagnosis versus matched negative controls. Our findings indicate a modest negative association between FGT ADC and subsequent cancer diagnosis, with greater predictive value than mammographic density in the same cohort, pointing to the possible utility of DWI in the assessment of breast cancer risk.
Introduction
There is strong interest to develop better prediction models of individual breast cancer risk to facilitate risk-based screening and management. It is well-recognized that imaging can improve such prediction, with mammographic density and its MRI correlate of fibroglandular tissue (FGT) established markers of elevated risk1. More recently, background parenchymal enhancement (BPE) on dynamic contrast-enhanced (DCE)-MRI, reflecting the fraction of FGT that enhances, has emerged as a potentially more sensitive functional marker of susceptibility to breast cancer2. Diffusion-weighted MRI (DWI) enables characterization of FGT microstructure, which may provide unique and complementary insight to tissue predisposed to cancer development without need for any contrast agent3. The purpose of this study was to explore the association of DWI characteristics of FGT with breast cancer diagnosis in women at high risk.Methods
Study populationIn this IRB-approved retrospective study, we evaluated a previously described 1:1 matched case:control cohort2. The prior study investigated BPE association with breast cancer risk, while for this study we investigated DWI characteristics in the same cohort. The cohort included women who received a high-risk screening MRI between 2006 to 2013 at our institution. Patients diagnosed with a breast cancer after their screening MRI were considered cancer cases, and controls were identified through one-to-one matching for age and BRCA mutation status (selected to maximize follow-up time). Negative status for controls was confirmed by linkage to the regional SEER cancer registry and medical record review at most recent follow-up (October 2021).
MRI acquisition and analysis
Over the study timeframe, several protocols and MRI scanners were used for screening breast MRI exams. From 2006-2009, imaging was performed on a 1.5T GE Signa scanner (GE Healthcare, Waukesha, WI) and from 2010-2013 on a 3T Philips Achieva scanner (Philips Healthcare, Best, the Netherlands). All protocols were in line with ACR breast MRI accreditation guidelines and included T2-weighted, DCE-MRI, and DWI sequences. DWI was acquired with a single shot echo-planar imaging sequence using TR/TE=5335-7156/61.2-90.0 ms, and b-values=0/600s/mm2 (at 1.5T) or 0/800s/mm2 (at 3T). During clinical interpretation, BPE was assessed qualitatively by radiologists according to BI-RADS (1=minimal/2=mild/3=moderate/4=marked) and mammographic density was recorded.
Image analysis & ADC measurement of FGT
An image processing pipeline was developed in MATLAB (MathWorks, Natick, MA), enabling semi-automated segmentation of FGT for each breast volume. Using b=0 images and a reader-selected signal intensity threshold, a whole-breast mask was generated. This mask was then applied to the b=0 image; masked voxels were then clustered using fuzzy c-means clustering for segmentation of breast FGT (Figure 1). The apparent diffusion coefficient (ADC) was calculated using a monoexponential fit to DWI. Histogram-based ADC metrics were derived for the FGT volume including mean, standard deviation, max, min, interquartile range, and skew. FGT segmentation and ADC calculation was performed independently by two readers blinded to cancer outcomes.
Statistical analysis
Reader agreement of FGT segmentation and ADC quantitation was assessed using Dice similarity index and intraclass correlation (ICC), respectively. The two readers’ measurements were averaged for subsequent analysis. Only the contralateral breast was evaluated in women with subsequent cancer diagnosis, and the same laterality in matched controls. Association between ADC and cancer outcome was assessed using the area under the receiver operating characteristic curve (AUC), the conditional odds ratio (OR) from conditional logistic regression (CLR), and Wilcoxon signed-rank test. Exploratory multivariable modeling was conducted using CLR models, with AUC estimated from the entire cohort (training set) and using leave-one-pair-out cross-validation (LOOCV).
Results
From the previously described cohort2, 19 matched case-control pairs were evaluated for this study (control follow-up time: 9.83 yrs (range: 6.58-11.2 yrs); Table 1), while four pairs excluded as DWI was not obtained during their MRI exams. Between-reader agreement was high for ADC measurements, with ICC = 0.95 for mean ADC calculation and Dice coefficient = 0.86 for FGT segmentations. Amongst the various ADC metrics examined, mean ADC showed the strongest association with cancer outcome (AUC=0.63; Table 1, Figure 2), followed by skew ADC (AUC=0.61). Subjects with subsequent cancer exhibited lower mean and higher skew of FGT ADC values compared to matched controls, although these differences did not reach significance (p=0.17 and p=0.13, respectively). Compared with conventional imaging markers, mean ADC exhibited predictive value comparable to BPE (AUC=0.63) and higher than mammographic density (AUC=0.52, Figure 3). Exploratory multivariable modeling combining mean ADC with BPE increased the AUC slightly (training set AUC: 0.68; LOOCV AUC: 0.65).Discussion and Conclusion
Our study identified a weak but compelling negative association of FGT ADC with subsequent cancer diagnosis. The predictive value of ADC (AUC=0.63) equaled that of BPE in this study cohort and is comparable to the performance of breast MRI and BPE characteristics for assessing cancer risk reported in prior studies (range 0.60 – 0.71)4–7, which were also shown to be higher than conventional risk models in clinical use7. ADC measures may provide comparable or synergistic value to BPE as a mutable biomarker to aid in risk-based screening and prevention strategies in high-risk women, but as this study cohort was small, this requires further validation. Nonetheless, results of the study warrant further investigation of DWI in larger cohorts as a potential marker of breast cancer risk.Acknowledgements
Supported by NIH/NCI research grants R01CA207290 and R01CA203883.References
1. Boyd, N. F. et al. Mammographic Density and the Risk and Detection of Breast Cancer. N. Engl. J. Med. 356, 227–236 (2007).2. Dontchos, B. N. et al. Are Qualitative Assessments of Background Parenchymal Enhancement, Amount of Fibroglandular Tissue on MR Images, and Mammographic Density Associated with Breast Cancer Risk? Radiology 276, 371–380 (2015).
3. McDonald, E. S. et al. Diffusion-Weighted MRI: Association Between Patient Characteristics and Apparent Diffusion Coefficients of Normal Breast Fibroglandular Tissue at 3 T. Am. J. Roentgenol. 202, W496–W502 (2014).
4. King, V. et al. Background Parenchymal Enhancement at Breast MR Imaging and Breast Cancer Risk. Radiology 260, 50–60 (2011).
5. Grimm, L. J. et al. Relationship between Background Parenchymal Enhancement on High-risk Screening MRI and Future Breast Cancer Risk. Acad. Radiol. 26, 69–75 (2019).
6. Arasu, V. A. et al. Population-Based Assessment of the Association Between Magnetic Resonance Imaging Background Parenchymal Enhancement and Future Primary Breast Cancer Risk. J. Clin. Oncol. 37, 954–963 (2019).
7. Portnoi, T. et al. Deep Learning Model to Assess Cancer Risk on the Basis of a Breast MR Image Alone. Am. J. Roentgenol. 213, 227–233 (2019).
Figures

Figure 1. Shown are
an example b=0 DWI (a), calculated
ADC map (b), fibroglandular tissue probability map within the breast (c), and
outline of the final FGT segmentation (d).

Figure 2. a) Box
plot of fibroglandular tissue mean ADC values in women who were (cases) and
were not (matched controls) later diagnosed with cancer, b) Line plot depicting
mean ADC measures for each case and matched control pair.
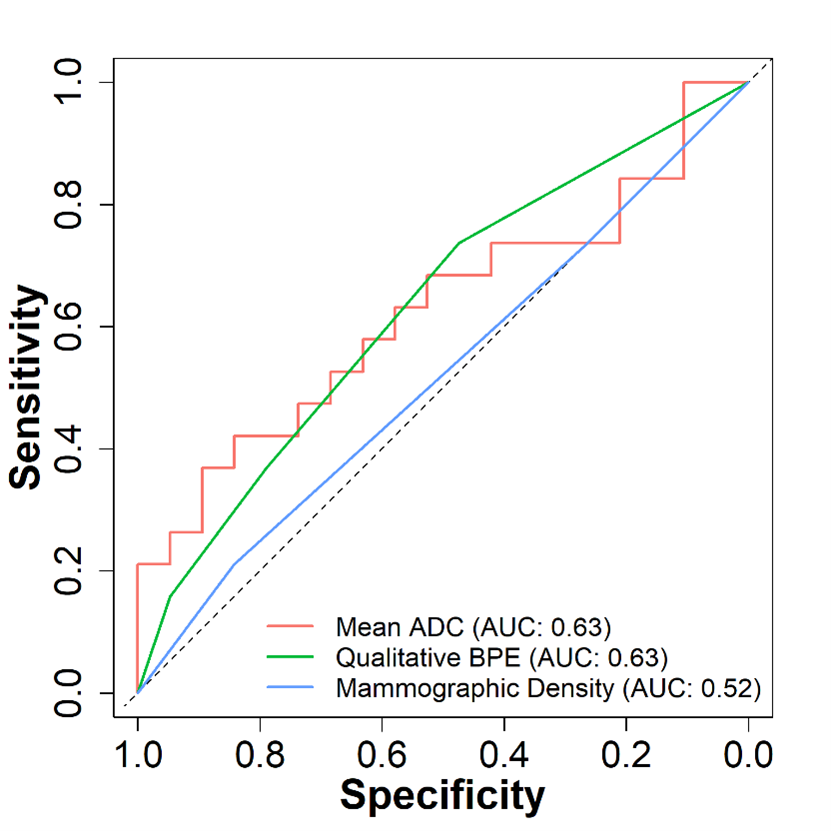
Figure 3. Receiver operator
characteristic curves for distinguishing cancer cases and controls based on fibroglandular tissue imaging
features.
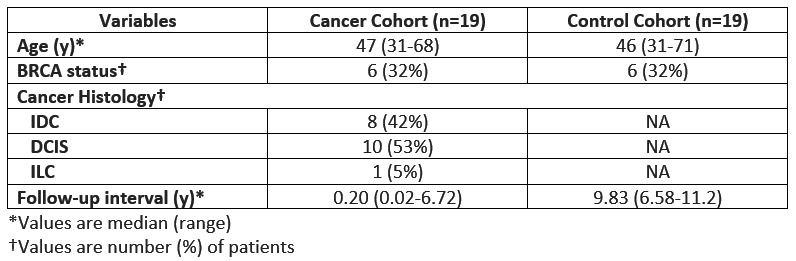
Table 1. Demographic
characteristics of the study population
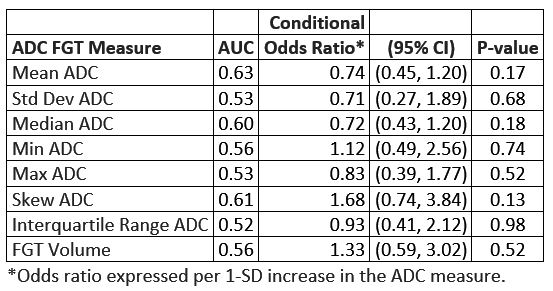
Table 2. Comparisons
of fibroglandular tissue ADC measures in high-risk women with subsequent cancer
diagnosis versus matched negative controls.
DOI: https://doi.org/10.58530/2022/3994