3993
Hippocampal Glx in RRMS: A potential therapeutic indicator in fingolimod and injectables1School of Health Sciences, University of Newcastle, Newcastle, Australia, 2Hunter Medical Research Institute, Newcastle, Australia, 3Department of Neurology, John Hunter Hospital, Newcastle, Australia, 4School of Medicine and Public Health, University of Newcastle, Newcastle, Australia
Synopsis
This novel longitudinal study evaluates the hippocampal metabolic and morphologic effects of different DMTs on the RRMS brain. RRMS patients were on fingolimod(N=36), injectables(N=29) and HCs cohort(N=44). MRS was acquired from hippocampus. Findings revealed that fingolimod is associated with a larger statistically significant reduction in hippocampal Glx (p=0.003) compared to injectable (p=0.01) and trending lower compared to HCs (p=0.09). Hippocampal NAA levels showed statistically significant increase in the fingolimod cohort (p≤0.0001) compared to HCs over the 2-years follow-up. These results demonstrate that fingolimod has a more potent effect on hippocampal Glx and NAA profiles than injectable DMTs.
Background
Disease modifying therapies (DMTs) can reduce the frequency of relapses and mitigate the long-term damage caused by these relapses in multiple sclerosis (MS) patients. MRI has been used as outcome measure in therapeutic trials for injectables such as glatiramer acetate (GA) and interferon (IFN-b), as well as oral treatments such as fingolimod1. Their efficacy has been demonstrated in relapse-remitting MS (RRMS) via reduced contrast enhancement on T1 and reduced new lesion formation on T2 sequences2. However, these structural MRI features are not specific and only partially correlate with the pathological substrates leading to permanent disability. MS pathophysiology and the resulting symptoms may be better understood by using novel proton magnetic resonance spectroscopy (H-MRS) techniques to aid in the development of new treatments. The efficacy of DMTs in RRMS monitored by H-MRS is underrepresented in the literature3-5. The results of these studies were conflicting between stable and increased levels of N-acetylaspartate (NAA) and other neurometabolites in white matter lesions (WML) and normal appearing white matter (NAWM) after DMT intervention3-6. The longitudinal effect of DMT on hippocampal metabolism is of great importance for the evaluation of disease progression and has not yet been explored in-vivo. Hippocampal demyelination is prominent in MS patients where dysfunction of a major excitatory neurotransmitter (glutamate +glutamine) (Glx) in this region is associated with memory impairment7. To our knowledge this is the first longitudinal study to evaluate RRMS morphologic and hippocampal neurometabolic measures after fingolimod and injectable DMT interventions in comparison to healthy controls (HCs).Materials and Methods
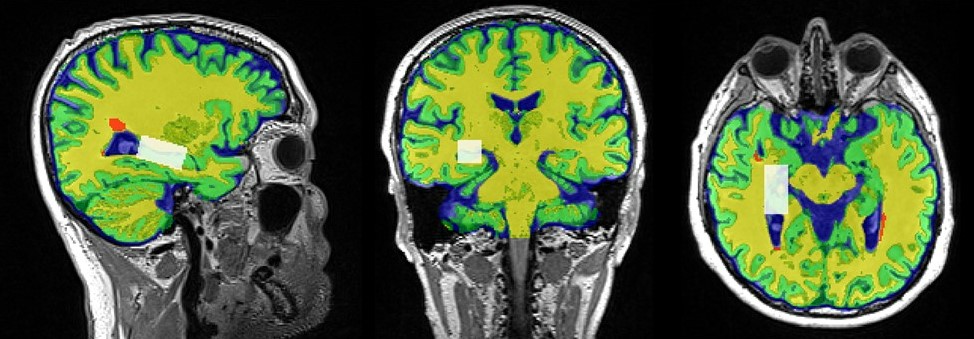
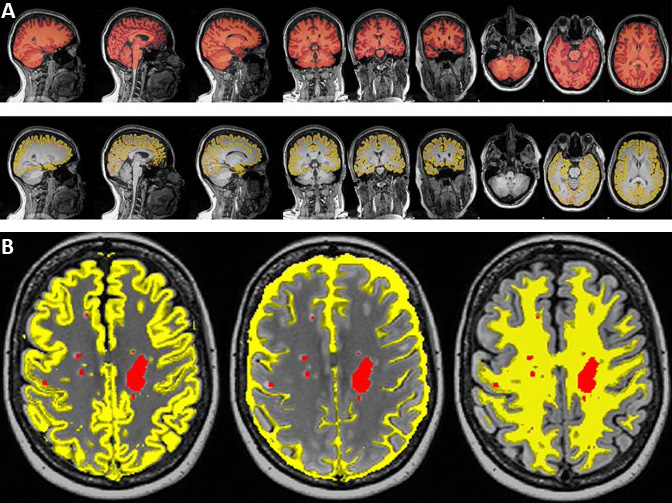
A total of 65 RRMS patients aged between 20 to 55 years were on fingolimod (N=36) and INF-b or GA (injectables, N=29). HCs (N=44) were age and sex matched to the RRMS cohort. All MRI/MRS were undertaken on a 3T (Prisma, Siemens) MRI scanner equipped with a 64-channel coil. MRI/MRS data was acquired from the RRMS cohort and HCs at 2-time points; Baseline and 2 years post inception of fingolimod and injectable treatment onset. All patients underwent cognitive, fatigue and mental health assessment as well as Expanded Disability Status Scale (EDSS). Structural imaging using 3D T1-MPRAGE (TR/TE/TI=2000/3.5/1100 ms, 7° flip angle, FOV=256x256mm2, voxel size:1mm3) as well as 3D T2-FLAIR (TR/TE/TI=5000/386/1800ms, 12° flip angle, FOV=256x256 mm2, voxel size: 1mm3) were acquired. H-MRS was applied using a Point RESolved Spectroscopy (PRESS) sequence acquired from the hippocampus (Figure 1) with the following acquisition parameters: TR/TE=2000/30ms, hippocampal voxel size =30x15x15 mm3, averages= 96 with water suppression. FSL and SPM12 were used for total brain volume, grey matter (GM), white matter (WM), CSF volumes and segmentation of lesion and MRS voxels8-10 (Figure 2). MRS data was exported offline and analysed with LCModel using a basis set specifically for 3T and TE=30 ms with water normalization. Volumetric measures and the level of significant change in metabolite levels associated with DMTs were assessed using repeated measures ANOVA, with disease duration and age as covariates, followed by post hoc testing using Bonferroni.Results
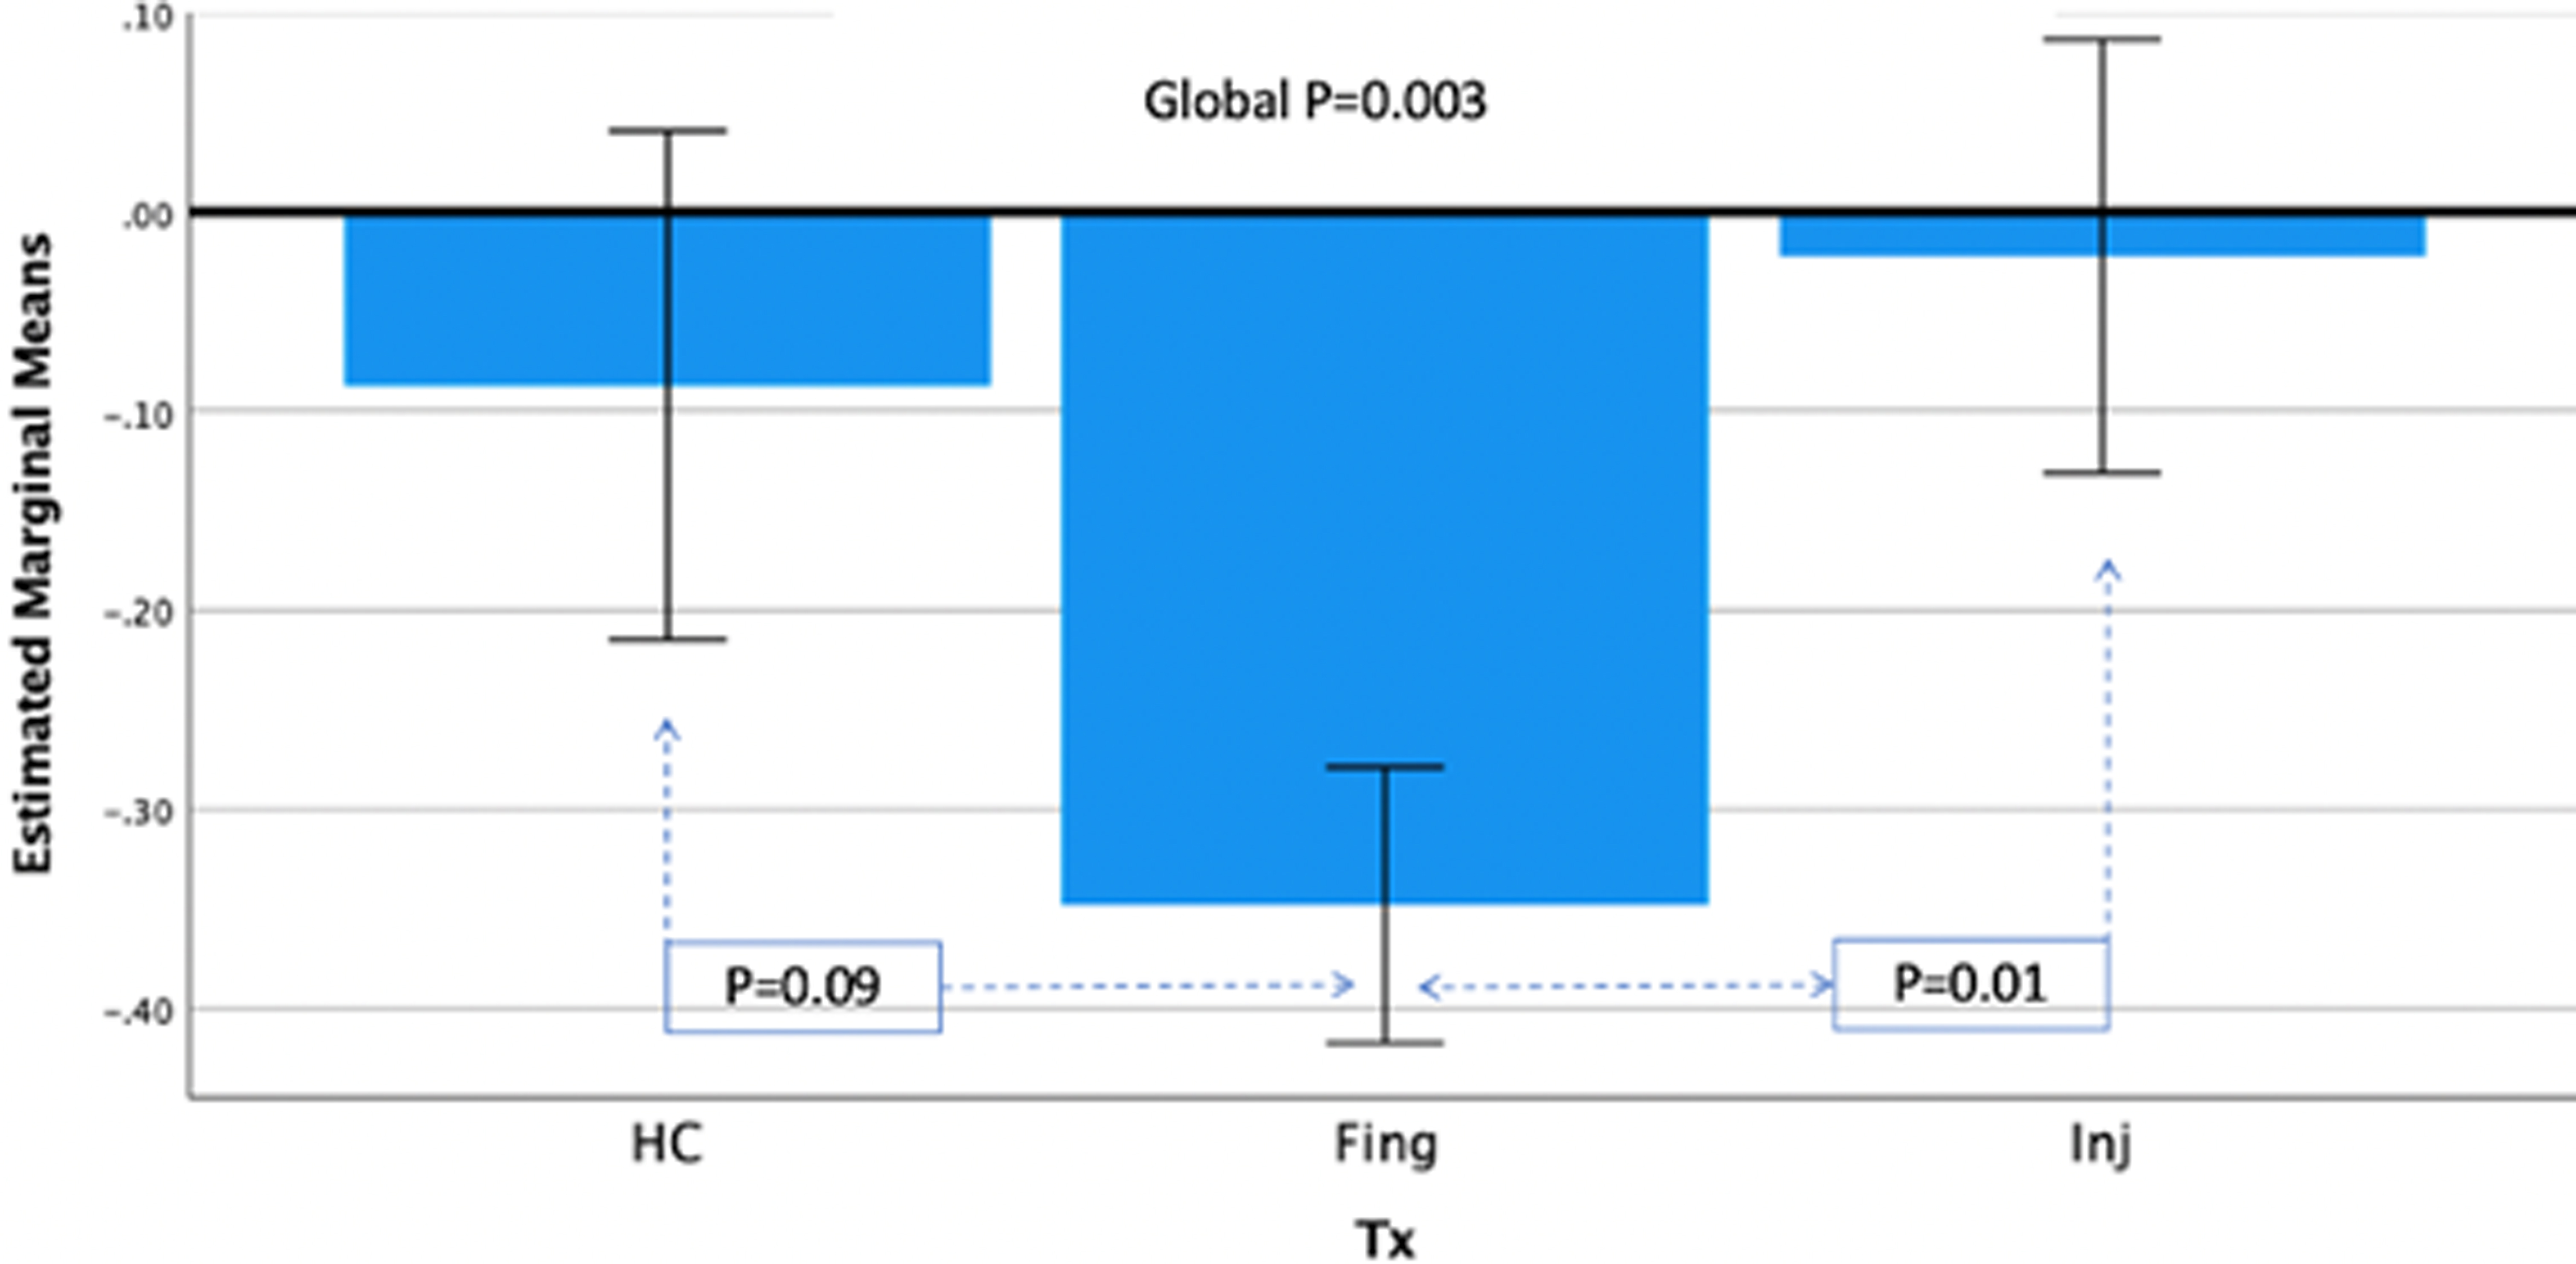
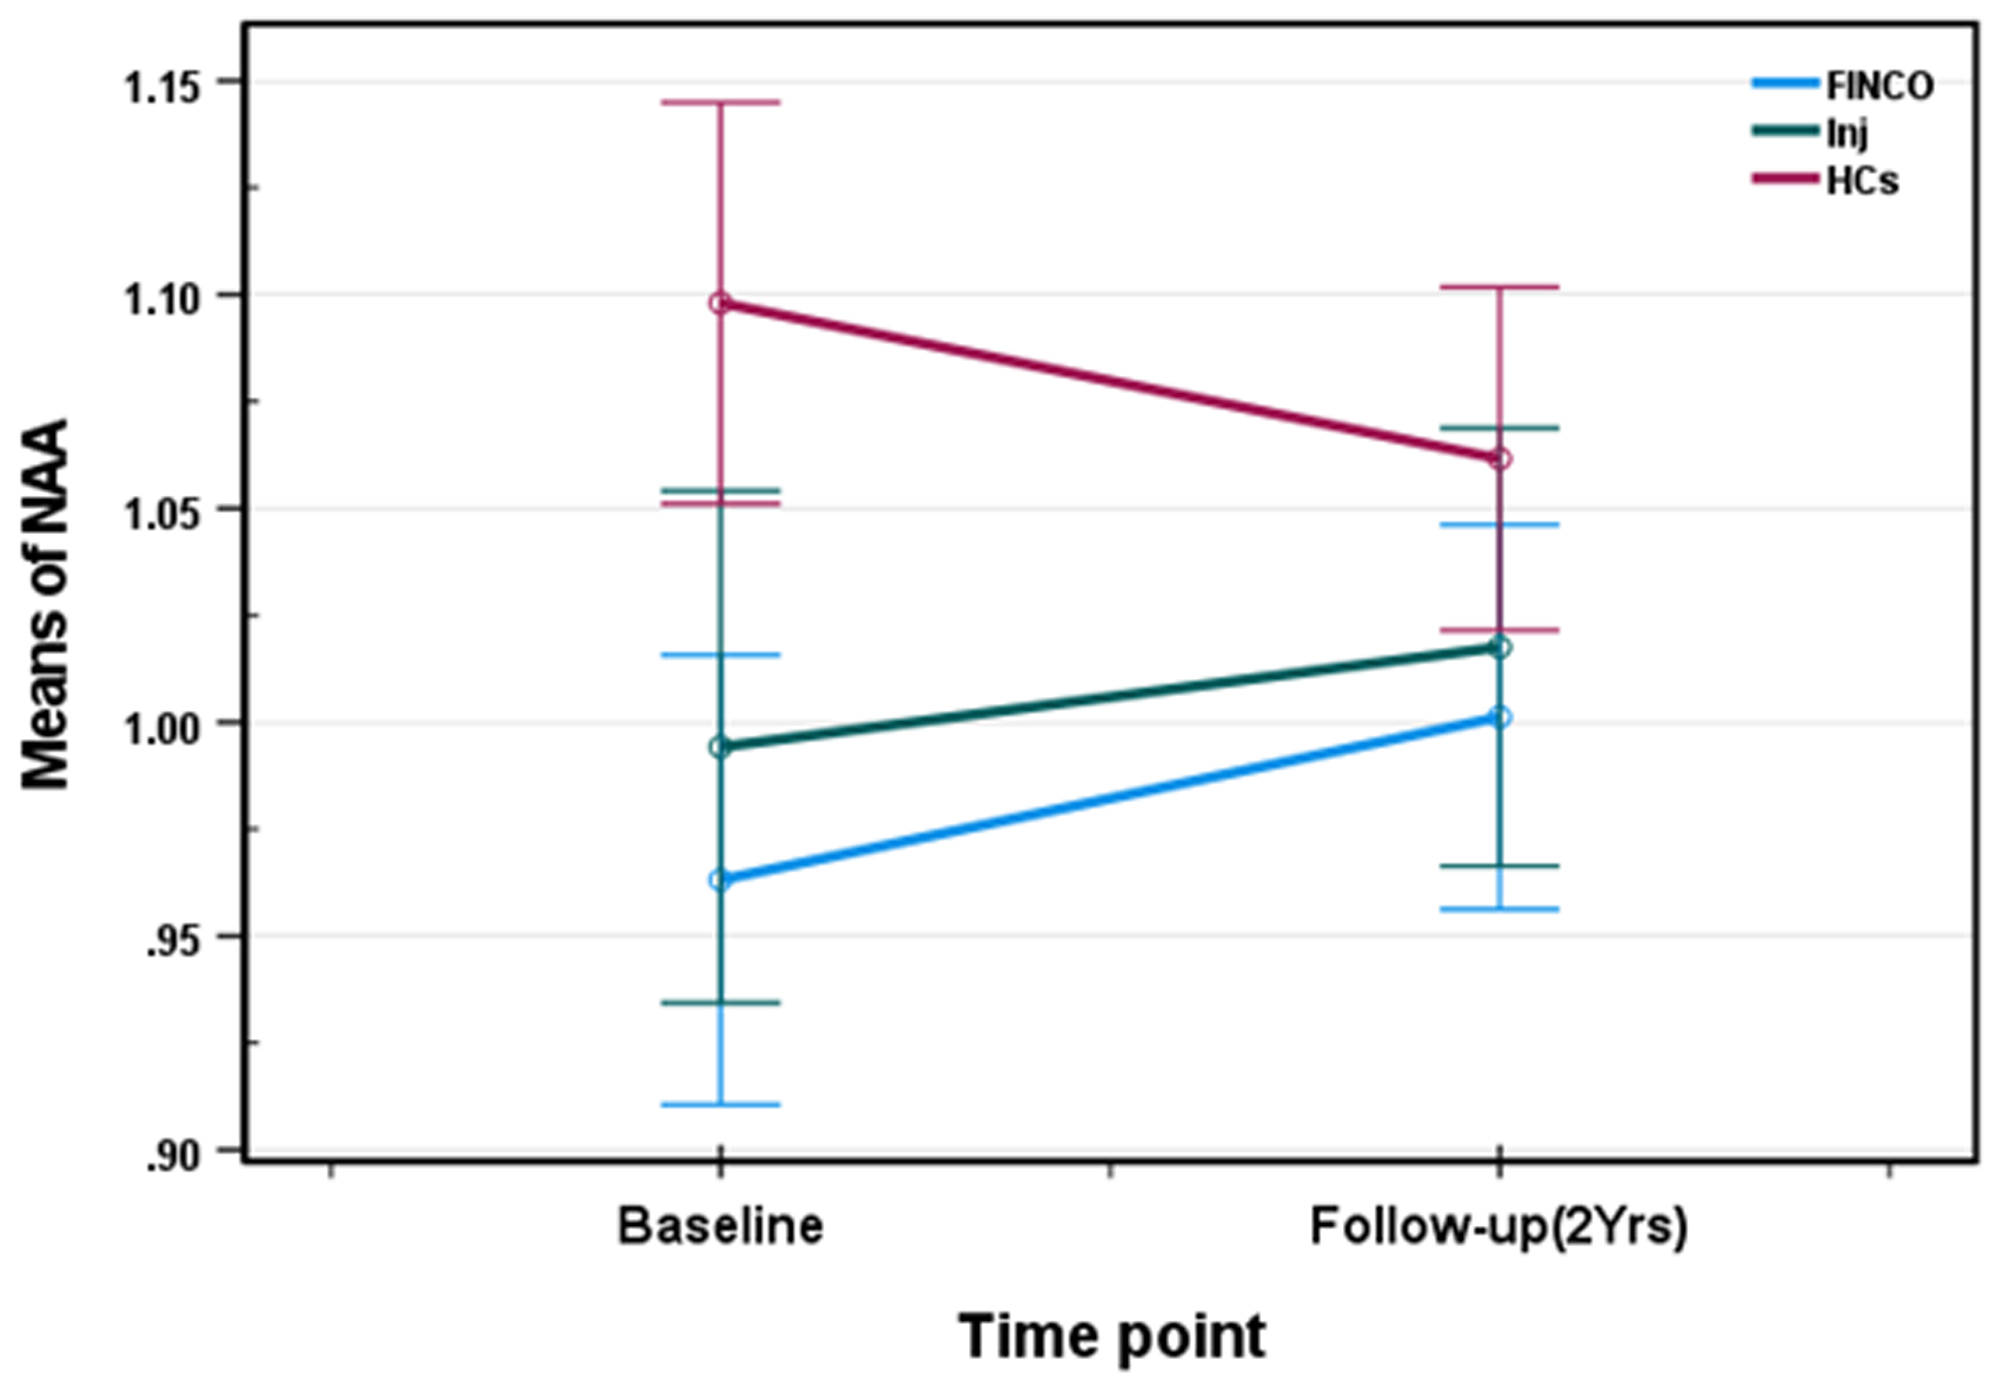
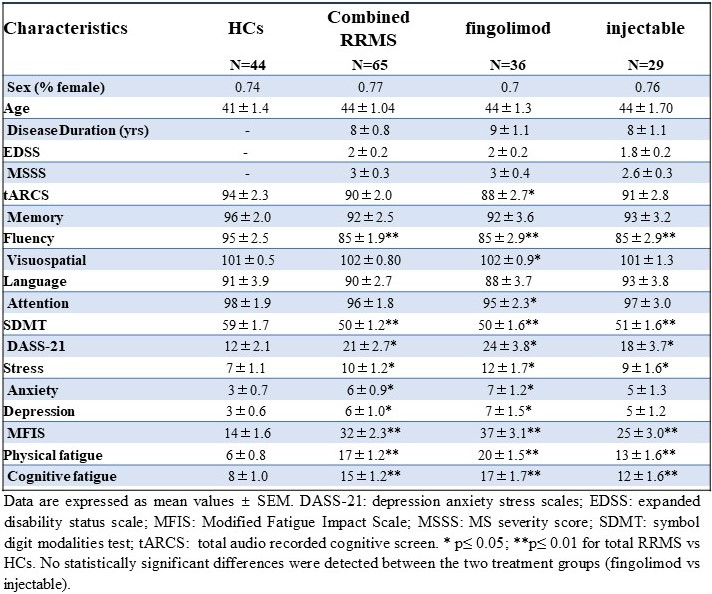
Demographic and clinical parameters of the three study cohorts are shown in Table 1. Individual and combined RRMS cohorts showed similar statistically significant volumetric differences compared to HCs: GM (-4%), WM (-5%) and CSF (+28%). Longitudinal analysis showed the pre- and post- mean hippocampal Glx levels were significantly altered over the 2 years in the treatment cohorts: fingolimod (1.473 ± 0.51 vs 1.058 ± 0.39), injectable (1.333 ± 0.06 vs 1.164 ± 0.04) but HCs remained stable (1.161 ± 0.46 vs 1.158 ± 0.35). However, post hoc tests revealed that fingolimod is associated with a larger statistically significant reduction in hippocampal Glx (p=0.003) compared to injectable (p=0.01) and a trend to be lower compared to HCs (p=0.09) (Figure 3). Hippocampal NAA levels showed statistically significant increase in the fingolimod cohort (p≤0.0001) compared to HCs whereas the injectable cohort only showed a non-statistically significant increasing trend (p=0.08) over the 2-yrs follow-up (Figure 4).Discussion
We confirmed significant neurometabolic and volumetric differences between MS patients and HCs 11,12.. Longitudinally, we found a significant reduction in hippocampal Glx and an increase in NAA in RRMS in fingolimod compared to the injectable and HC cohort. These changes were associated with morphological changes over 2-yrs. Glx plays a critical role in important metabolic functions including oxidative energy supply to neurons/astrocytes and production of GABA where excessive amount of Glx can lead to neurotoxicity, neurodegeneration and dysfunction in the glutamatergic pathway in addition to abnormal neuronal signalling. Glutamate-induced activation of T cells and release of proinflammatory cytokines, have detrimental effects in MS patients13. Previous studies have shown that glutamate toxicity in MS correlated with a reduction of NAA, cerebral volume decline7,14, reinforcing the role of NAA as a marker for neuronal integrity, and a sensitive predictor of brain atrophy.Conclusions
The current study is the first longitudinal in-vivo investigation comparing the impact of fingolimod, IFN-b or GA on the hippocampal metabolism in RRMS patients. The findings demonstrate that fingolimod has a more potent effect on hippocampal Glx and NAA profiles then injectable DMTs in the MS brain. Our results therefore suggest that MRS might be used as therapeutic indicator.Acknowledgements
This study’s funding was provided by Novartis Pharmaceuticals Australia Pty Ltd. The authors gratefully acknowledge the patients and healthy controls who participated in this study and Hunter Medical Research Institute Imaging Centre (HMRI-IC) of the University of Newcastle.References
1. Radue EW, O'Connor P, Polman CH, et al. Impact of fingolimod therapy on magnetic resonance imaging outcomes in patients with multiple sclerosis. Archives of neurology 2012;69(10):1259-1269. 2. Hutchinson M. Natalizumab: A new treatment for relapsing remitting multiple sclerosis. Ther Clin Risk Manag 2007;3(2):259-268.
3. Narayanan S, De Stefano N, Francis GS, et al. Axonal metabolic recovery in multiple sclerosis patients treated with interferon beta-1b. Journal of neurology 2001;248(11):979-986.
4. Toprak MK, Cakir B, Ulu EM, et al. The effects of interferon beta-1a on proton MR spectroscopic imaging in patients with multiple sclerosis, a controlled study, preliminary results. The International journal of neuroscience 2008;118(12):1645-1658.
5. Yetkin MF, Mirza M, Donmez H. Monitoring interferon beta treatment response with magnetic resonance spectroscopy in relapsing remitting multiple sclerosis. Medicine (Baltimore) 2016;95(36):e4782.
6. Sarchielli P, Presciutti O, Tarducci R, et al. 1H-MRS in patients with multiple sclerosis undergoing treatment with interferon beta-1a: results of a preliminary study. Journal of neurology, neurosurgery, and psychiatry 1998;64(2):204-212.
7. Muhlert N, Atzori M, De Vita E, et al. Memory in multiple sclerosis is linked to glutamate concentration in grey matter regions. J Neurol Neurosur Ps 2014;85(8):834-840.
8. Ashburner J, Barnes G, Chen C , et al. SPM12 2015.
9. Smith SM, Jenkinson M, Woolrich MW, et al. Advances in functional and structural MR image analysis and implementation as FSL. NeuroImage 2004;23 Suppl 1:S208-219.
10. Quadrelli S, Mountford C, Ramadan S. Hitchhiker's Guide to Voxel Segmentation for Partial Volume Correction of In Vivo Magnetic Resonance Spectroscopy. Magn Reson Insights 2016;9:1-8. 11. Rovira À, Alonso J. 1H Magnetic Resonance Spectroscopy in Multiple Sclerosis and Related Disorders. Neuroimaging Clinics 2013;23(3):459-474.
12. Chard DT, Griffin CM, McLean MA, et al. Brain metabolite changes in cortical grey and normal-appearing white matter in clinically early relapsing-remitting multiple sclerosis. Brain : a journal of neurology 2002;125(Pt 10):2342-2352.
13. Tisell A, Leinhard OD, Warntjes JBM, et al. Increased concentrations of glutamate and glutamine in normal-appearing white matter of patients with multiple sclerosis and normal MR imaging brain scans. PloS one 2013;8(4):e61817.
14. Rahimian N, Saligheh Rad H, Firouznia K, et al. Magnetic resonance spectroscopic findings of chronic lesions in two subtypes of multiple sclerosis: primary progressive versus relapsing remitting. Iranian journal of radiology : a quarterly journal published by the Iranian Radiological Society 2013;10(3):128-132.
Figures