3992
Administration of ketone beta-hydroxybutyrate modulates 1H-MRS cortical GABA and Glu in healthy adults1Harvard Medical School/Massachusetts General Hospital, Boston, MA, United States, 2Biomedical Engineering, Stony Brook University, Stony Brook, NY, United States, 3Children's National Hospital, Washington D.C., DC, United States
Synopsis
Brain aging is highly correlated with deficiencies in glucose metabolism. Ketone beta-hydroxybutyrate (d-βHB) may represent an alternative fuel for energy metabolism in brain aging. This study assesses the neurochemical effect of an acute administration of d-βHB in the healthy human brain using MR spectroscopy. Results show that levels of GABA and Glu were significantly reduced in the posterior cingulate region after administration of d-βHB, but not glucose. Additionally, older age significantly predicted higher decreases in levels of both GABA and Glu. This suggests that administration of d-βHB alters normal cerebral metabolic profile in physiological brain aging.
Introduction
Brain aging is highly correlated with deficiencies in glucose metabolism. Importantly, deficiencies in glucose metabolism are causally linked to onset of Alzheimer’s disease and cognitive decline. Previous works suggest that ketone beta-hydroxybutyrate (d-βHB) may represent an alternative fuel for cerebral energy metabolism in normal brain aging and AD [1]. Moreover, studies have suggested that ketones may exert anti-epileptic effect in drug-resistant epilepsy [2]. Magnetic resonance spectroscopy (MRS) is an interesting tool in metabolism studies as it can assess static and dynamic changes in brain metabolism following an intervention or physiological challenge [3]. The aim of this study is to provide an understanding of the neurochemical effect of an acute administration of d-βHB in the healthy human brain using MRS.Design: this study is a within-subject metabolic intervention. Subjects came in for two visits and allocation of the d-βHB or glucose bolus was randomized on the first visit. MR acquisitions and blood levels of d-βHB were obtained before and after administration of the d-bHB or glucose bolus.
Bolus: d-βHB and glucose boluses were administered as liquid drinks in unlabeled containers. Concentrations of d-βHB (0.4 g/mL) and glucose (0.25 g/mL) were calculated relative to subjects’ weight (d-βHB 395 mg/kg). Glucose was calorie-matched with d-βHB drink for within-subject control of caloric intake.
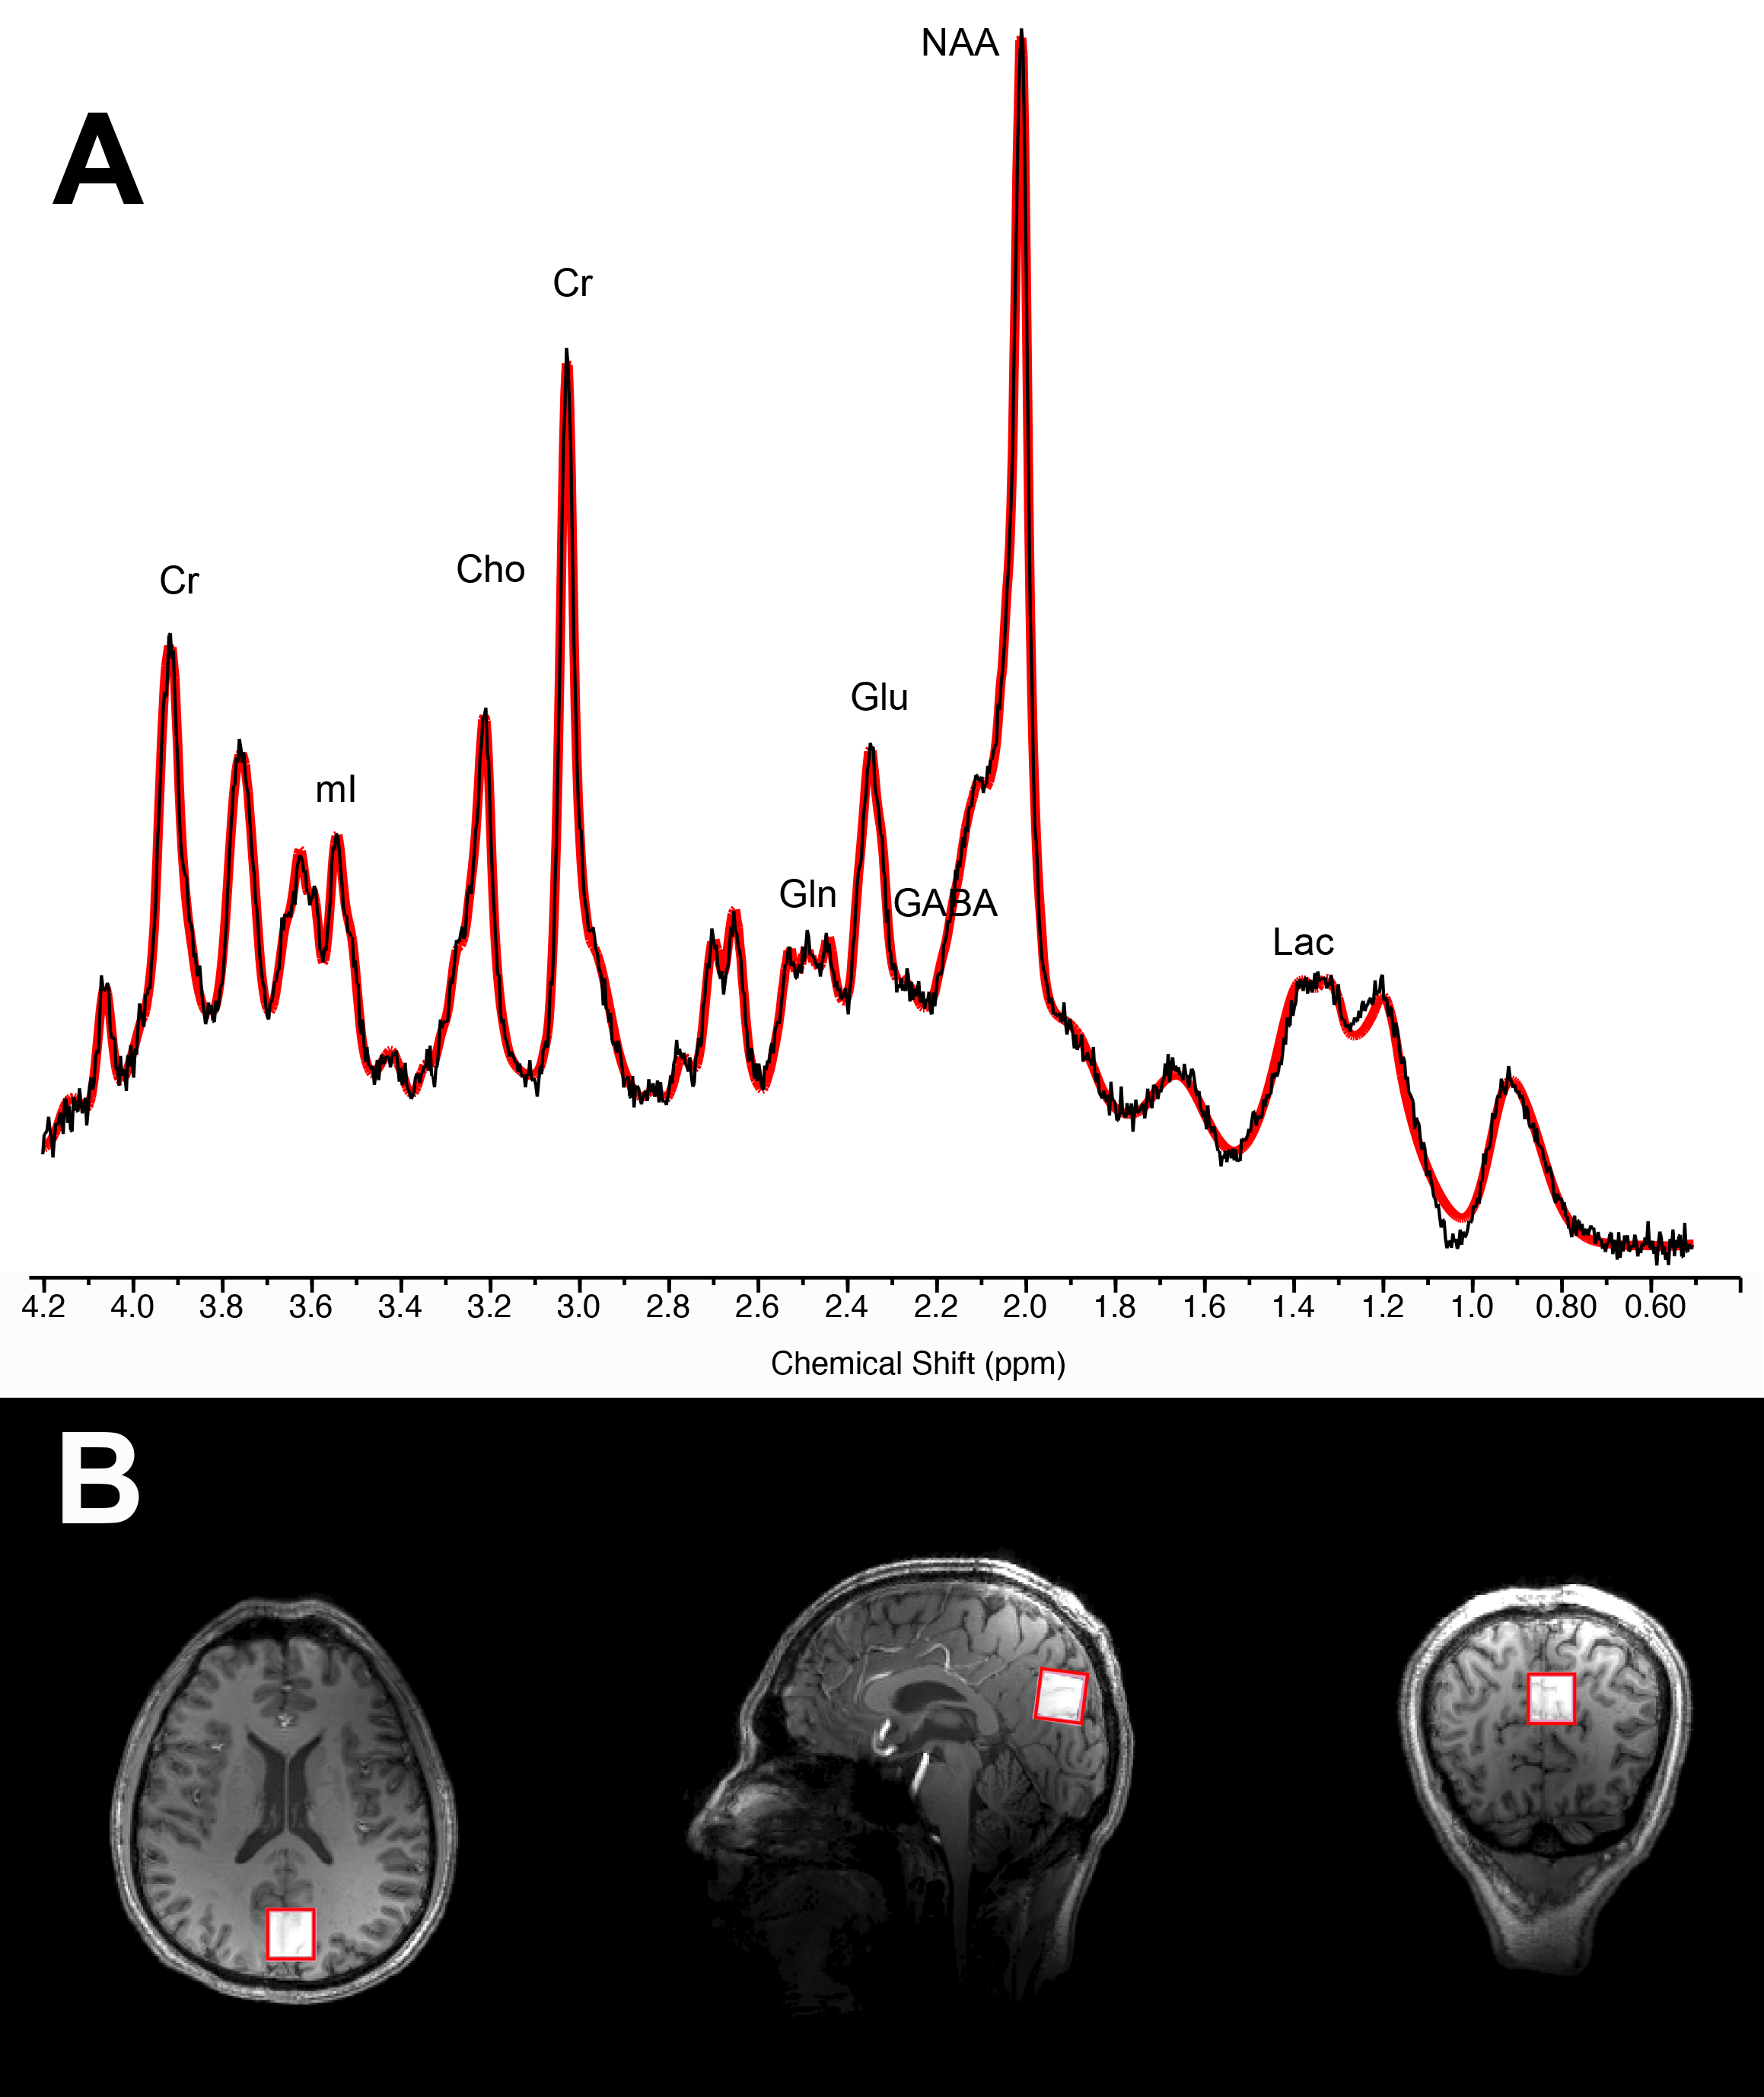
MR spectroscopy: data were acquired from 7T Siemens scanner with single-voxel stimulated echo acquisition mode TE 5.00ms, TR 4500ms, TM 75ms, water suppression bandwidth 132Hz, 80 averages, acquisition bandwidth 4000Hz, acquisition duration 512ms, vector size 2048 points, RF pulse duration 3200ms and with 3D outer volume suppression interleaved with variable power and optimized relaxation (VAPOR) water suppression, 2x2x2cm voxel positioned over the posterior cingulate cortex (see Figure 1). Concentration levels were estimated with LC Model and data were excluded when Cramer-Rao Lower Bounds exceeded 15%. Metabolites were analyzed in absolute concentration and normalized to creatine+phosphocreatine to ensure intrasubject control for changes in basal cell metabolism. Segmentation of the voxel was performed prior to statistical analyses.
Statistical analyses: Repeated-measures ANOVA with two factors were computed to assess the effect of 1) Treatment (d-βHB v glucose), and 2) Time (pre- and post-bolus) on levels of MRS metabolites (as dependent variables). Linear regression models were used to assess the effect of 1) Age and 2) blood-levels of d-βHB (as predicting variables) on levels of MRS metabolites (as dependent variables) in the posterior cingulate voxel.
Results
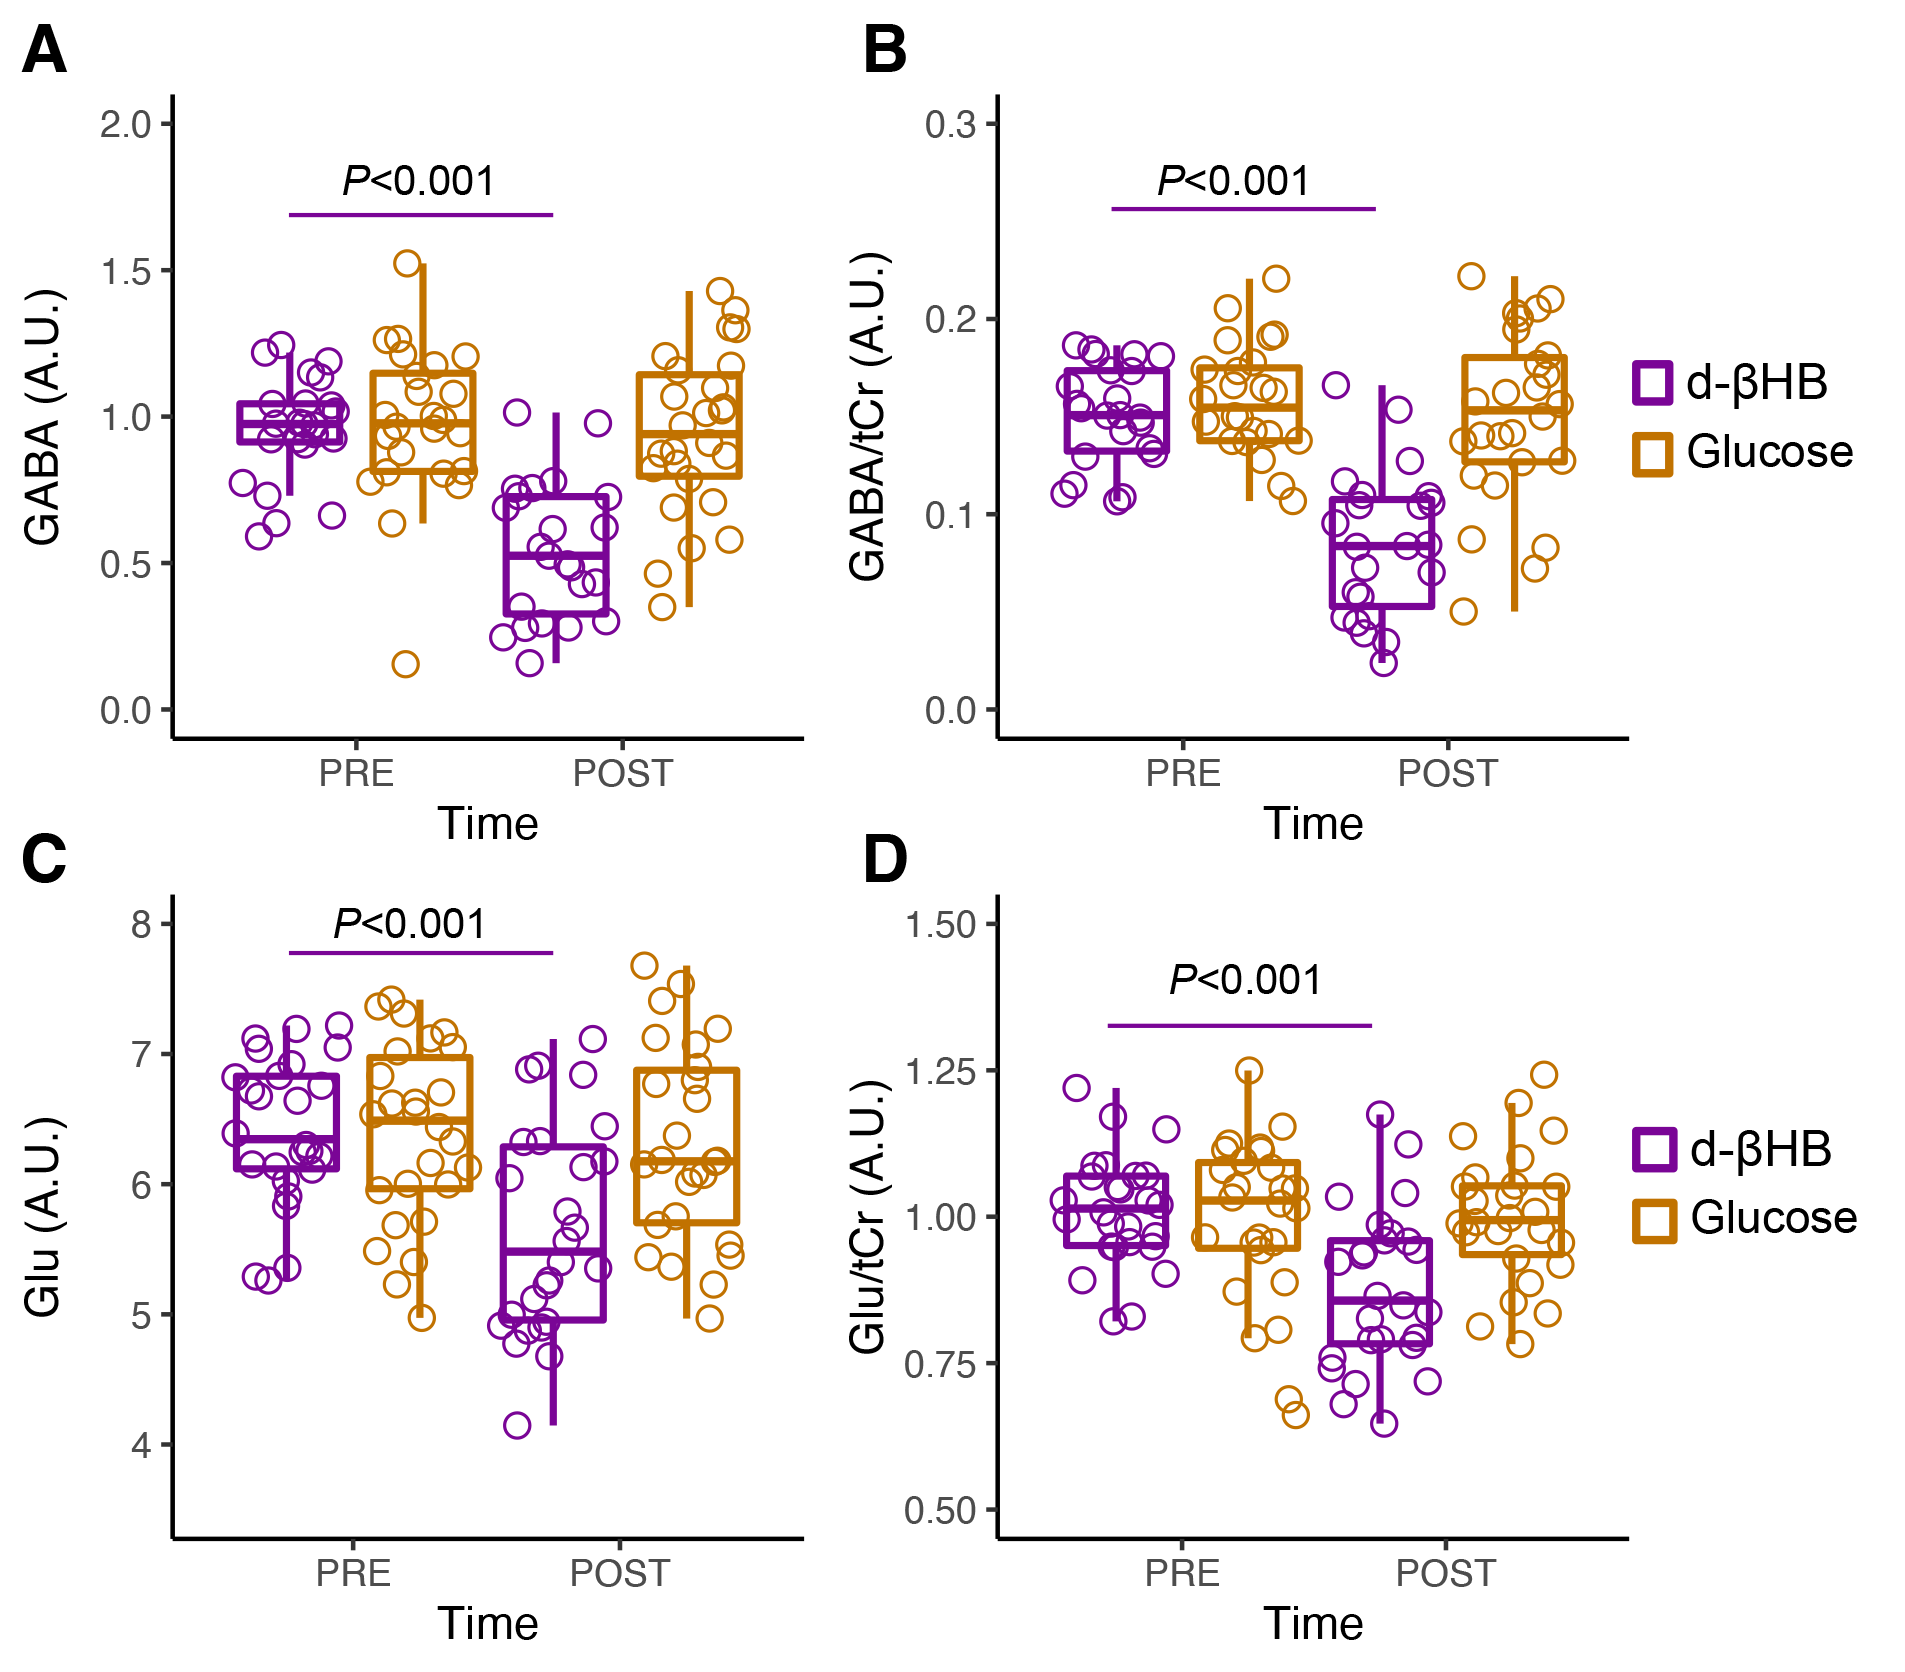
GABA significantly decreased between pre- and post-bolus in the d-βHB condition (P<0.001) but not glucose (P=0.685). Glu significantly decreased between pre- and post-bolus in the d-βHB condition (P<0.001) but not glucose (P=0.875)(see Figure 2).Linear regression models showed that age predicted changes in levels of posterior GABA (ΔGABA; adjR2=0.172, b=-0.46, P=0.031) and Glu (ΔGlu; adjR2=0.225, b=-0.51, P=0.009) (see Figure 3 A-B).
Linear regression models controlled for age showed that blood levels of d-bHB (Δd-βHB) predicted changes in levels of posterior GABA (ΔGABA; adjR2=0.26, b=-0.54, P=0.009) and Glu (ΔGlu; adjR2=0.285, b=-0.56, P=0.004) (see Figure 3 C-D).
Discussion
In this report, we show that levels of GABA and Glu were significantly reduced in the posterior cingulate region after administration of d-βHB, but not glucose, in healthy adults in moderate hypoglycemia. Additionally, older age significantly predicted higher decreases in levels of both GABA and Glu. This suggests that administration of d-βHB alters the normal cerebral metabolic profile compared to glucose. This also seems to be exacerbated in older people, who are more at risk of exhibiting glucose metabolism deficiencies. Our results also show that higher levels of blood d-βHB significantly predicted higher decreases in levels of both GABA and Glu. This suggests that higher levels of plasma ketones are correlated to a larger effect in the brain. Importantly, our results showing decreased glutamatergic and GABAergic outputs concur with anti-epileptic and anti-inflammatory effects of d-βHB and the ketogenic diet described in the literature [4]. Alternatively, our results also concur with molecular works suggesting that Glu may be used as second-choice anaplerotic substrate for energy metabolism in hypoglycemia, which could transiently decrease its concentration levels.Conclusion
We believe this study shows the relevance of MRS in studying dynamic metabolic challenges in physiological brain aging. This suggests the study of the neurochemical characterization of d-βHB should be replicated with additional imaging modalities and robust sample size.Acknowledgements
This research was funded by the W. M. Keck Foundation (L.R.M.-P.), the White House Brain Research Through Advancing Innovative Technologies (BRAIN) Initiative (Grants NSFECCS1533257 and NSFNCS-FR 1926781 to L.R.M.-P.), and the US National Academies (Grant NAKFICB8 to L.R.M.-P. and E.M.R).
This research was carried out in whole or in part at the Athinoula A. Martinos Center for Biomedical Imaging at the Massachusetts General Hospital, using resources provided by the Center for Functional Neuroimaging Technologies, P41EB015896, a P41 Biotechnology Resource Grant supported by the National Institute of Biomedical Imaging and Bioengineering (NIBIB), National Institutes of Health.
References
[1] Cunnane SC, Courchesne‐Loyer A, St‐Pierre V, Vandenberghe C, Pierotti T, Fortier M, Croteau E, Castellano CA (2016) Can ketones compensate for deteriorating brain glucose uptake during aging? Implications for the risk and treatment of Alzheimer's disease. Annals of the New York Academy of Sciences 1367, 12-20.
[2] Grammatikopoulou MG, Goulis DG, Gkiouras K, Theodoridis X, Gkouskou KK, Evangeliou A, Dardiotis E, Bogdanos DP (2020) To keto or not to keto? A systematic review of randomized controlled trials assessing the effects of ketogenic therapy on Alzheimer disease. Advances in Nutrition 11, 1583-1602.
[3] Mullins R, Reiter D, Kapogiannis D (2018) Magnetic resonance spectroscopy reveals abnormalities of glucose metabolism in the Alzheimer's brain. Annals of clinical and translational neurology 5, 262-272.
[4] Achanta LB, Rowlands BD, Thomas DS, Housley GD, Rae CD (2017) β-Hydroxybutyrate boosts mitochondrial and neuronal metabolism but is not preferred over glucose under activated conditions. Neurochemical research 42, 1710-1723.
Figures