3991
Mapping of Early-Stage Changes in Cerebral Glutamate in APPNL-F/NL-F Mouse Model of Alzheimer’s Disease Using GluCEST MRI1Department of Radiology, Center for Advanced Metabolic Imaging in Precision Medicine, Perelman School of Medicine, University of Pennsylvania, Philadelphia, PA, United States
Synopsis
Alzheimer’s disease (AD) is characterized by progressive loss of cognitive abilities. Glutamate being the major excitatory neurotransmitter in mammalian brain, regulates various cognitive functions. Reports suggesting compromised cerebral glutamate homeostasis in AD indicates the potential of glutamate mapping in early diagnosis of AD. In the current study, we have used glutamate weighted Chemical Exchange Saturation Transfer (GluCEST) MRI to investigate changes in cerebral glutamate in 6-month-old APPNL-F/NL-F mouse model of AD. Our findings suggest reductions in the levels of cortical and hippocampal glutamate in APPNL-F/NL-F mice. A longitudinal study is ongoing to understand the pattern of perturbation with disease progression.
Introduction
Alzheimer’s disease (AD) is the most common neurodegenerative disorder characterized by progressive loss of cognitive and intellectual abilities including memory1. Glutamate is the major excitatory neurotransmitter in the mammalian central nervous system2. It plays major roles in glucose and energy metabolism, cortical excitability and cognitive functions including learning and memory3. 1H NMR spectroscopic studies conducted with AD animal models4,5 and human subjects6 have revealed a consistent reduction in the levels of cortical glutamate. These reports point towards the importance of cerebral glutamate mapping in early diagnosis of AD. In the current study, our objective was to perform GluCEST imaging-based, region-wise in vivo mapping of cerebral glutamate in a 6-month-old APPNL-F/NL-F mouse model of AD. Our initial findings indicate significant reductions in the levels of glutamate in the cerebral cortex and hippocampus of these mice which is in coherence with the neurometabolic profile of a typical AD brain. In the future, a series of longitudinal measurements will be performed at the age of 9, 12, 15, 18, and 24 months to understand the pattern of this perturbation in the cerebral cortex and hippocampus of these mice with disease progression.Methos
The animal experiments were approved by the IACUC committee of the University of Pennsylvania. The study was performed using 6-month-old C57BL6/J (control, n=6; 2 male and 4 female) and APPNL-F/NL-F (AD, n=6; 2 male and 4 female) mice. The APPNL-F/NL-F is a knock-in mouse model of AD, harboring Swedish (APPKM670/671NL) and the Iberian (APPI716F) mutations in APP gene7. APPNL-F/NL-F mice recapitulate several AD-associated pathologies, including amyloid-β1-42 plaques, synaptic loss and microgliosis. For in vivo GluCEST mapping, the head of isoflurane (1.5%) anesthetized animals were placed inside a conical assembly. A rectal thermal probe and a pressure pillow-based respirometer were used for continuous monitoring of temperature and respiration respectively, throughout the experiment (SA instruments NY USA). This setup was placed in a 20mm diameter volume 1H transceiver coil (RAPID Biomedical GmbH, Germany). The entire assembly was placed in a 30cm horizontal bore 9.4T magnet interfaced with Avance III HD console (Bruker Biospin, Germany). Hot air was supplied in a controlled manner to maintain the animal body temperature to 37⁰C. The entire imaging protocol consisted of a localizer followed by T1-FLASH (acquisition time = ~4 min), T2-MSME (acquisition time = ~9 min), GluCEST (B1rms=5.87µT; pulse-duration=1000ms (series of 200ms pulses); offsets= ±2.4 to ±3.6ppm; step-size=0.2ppm; averages=4; acquisition time = ~15 min) and WASSR8. These data were acquired from 1mm thick axial slice (-2.8mm from lambda covering DG, CA1, CA2, CA3 hippocampal regions, surrounding cortex and thalamus) and 0.146mm x 0.146mm in-plane resolution.Two regions of interest (ROIs), covering the cerebral cortex and hippocampus were drawn in the post-processed B0-corrected GluCEST map as these are the primarily affected brain regions in AD9,10. The obtained mean value reflected the glutamate levels in the ROIs and was compared across the two groups. To find the statistical significance of differences between these values, a two-tailed t-test assuming unequal variance was performed.
Results
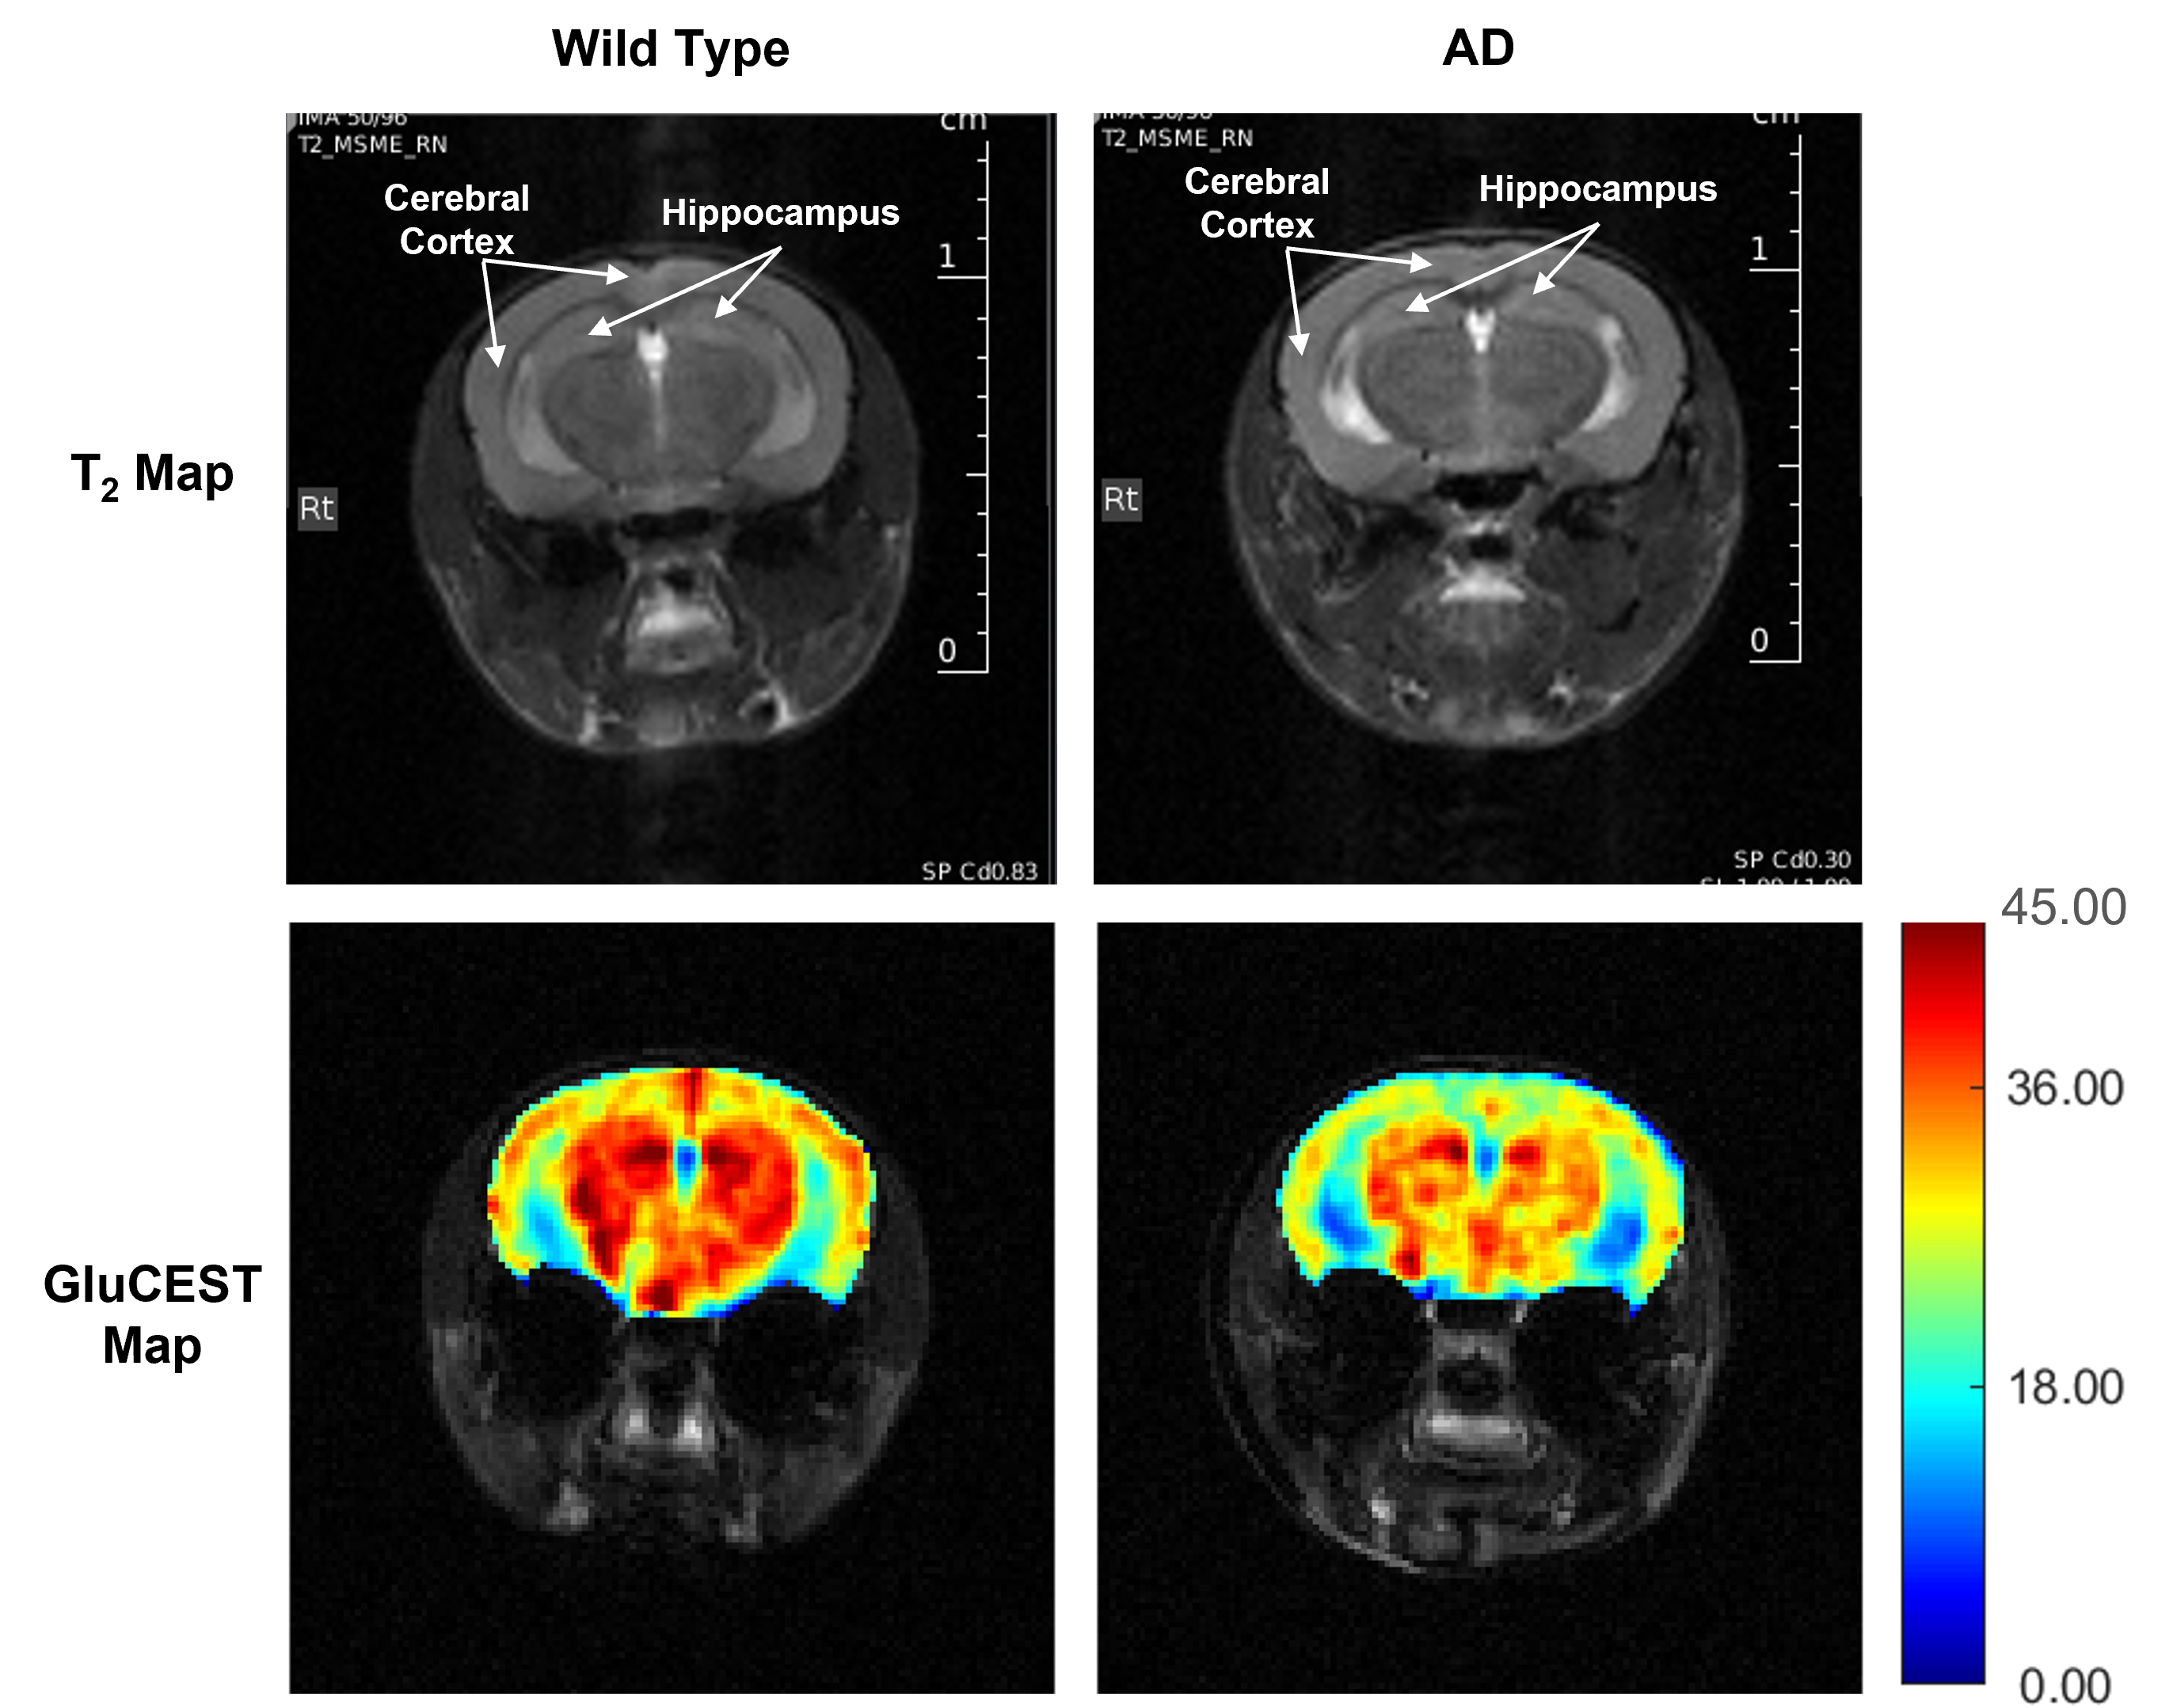
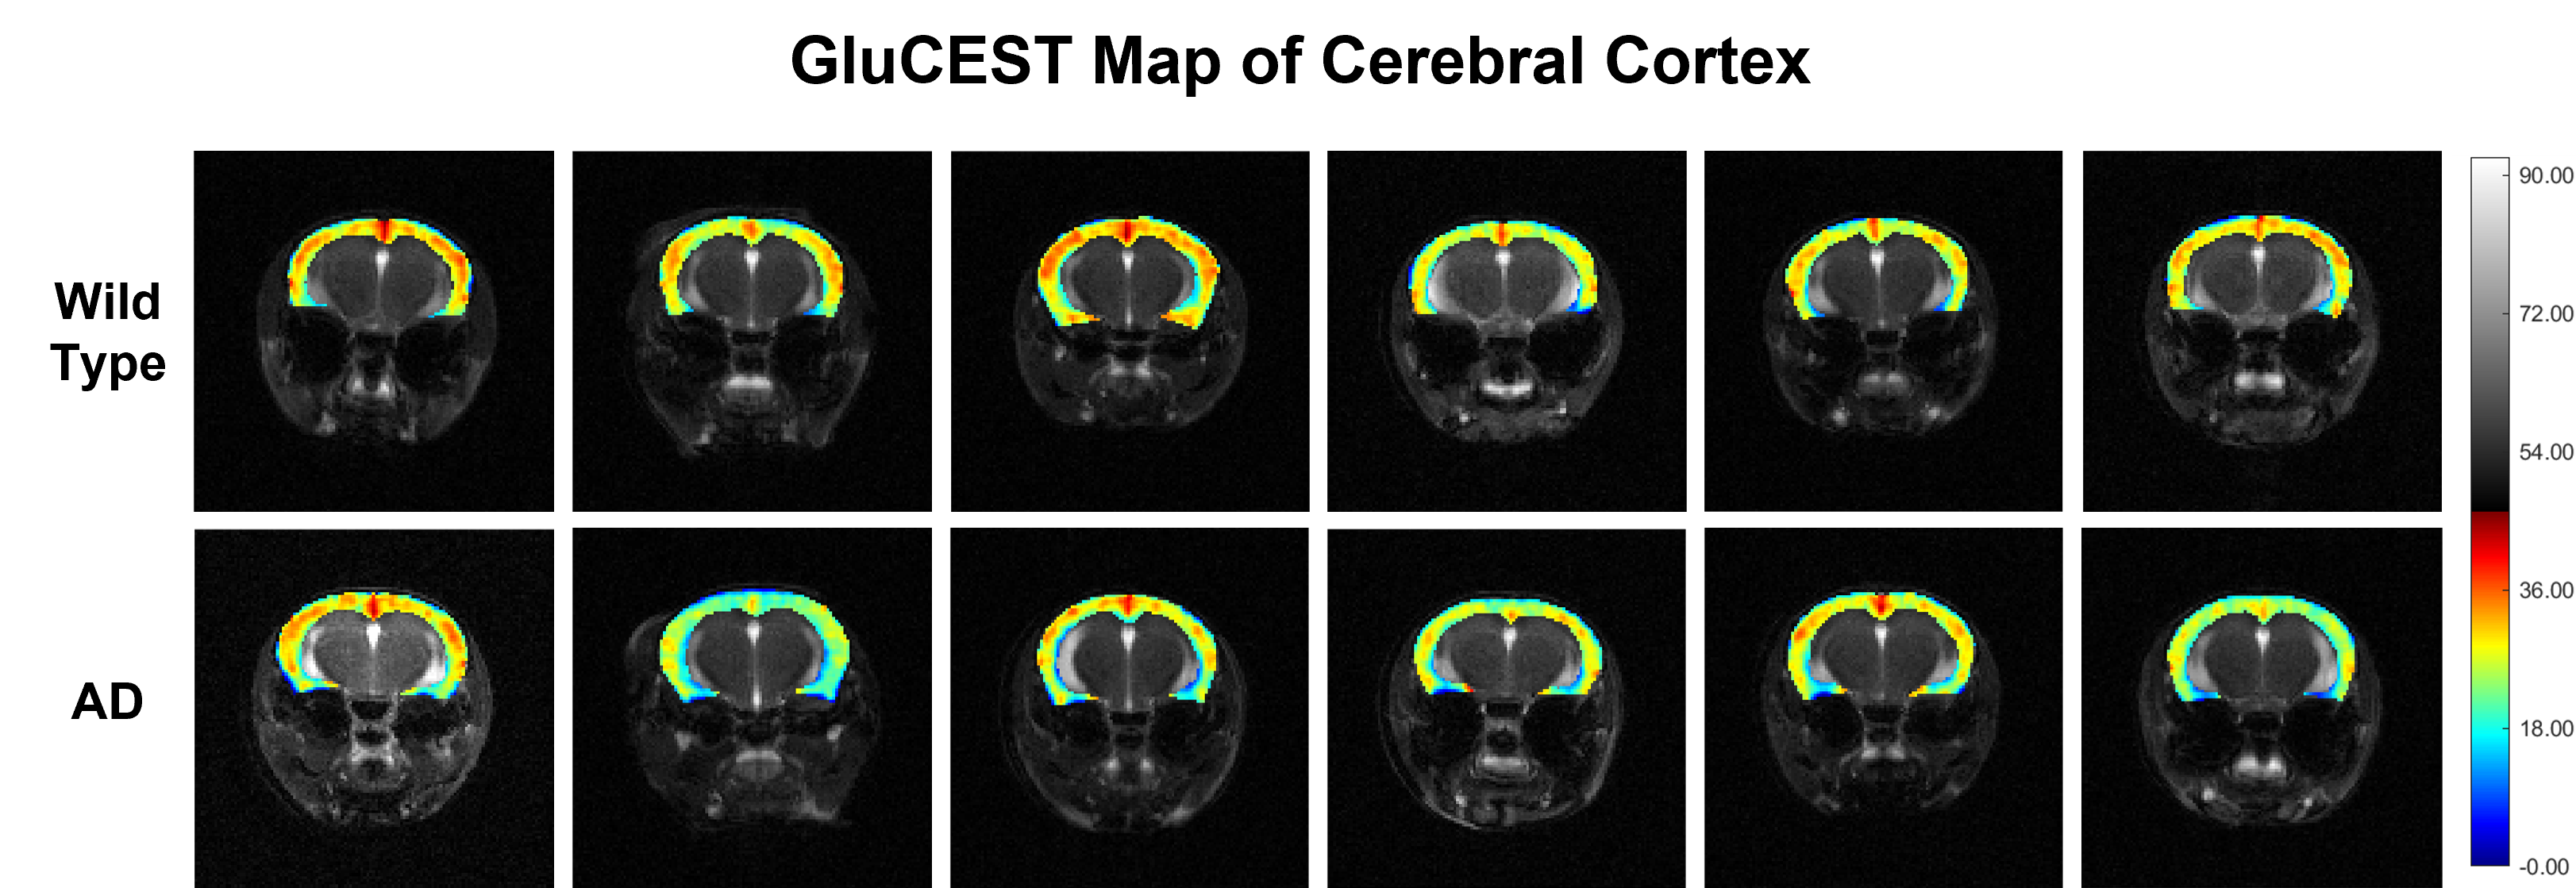
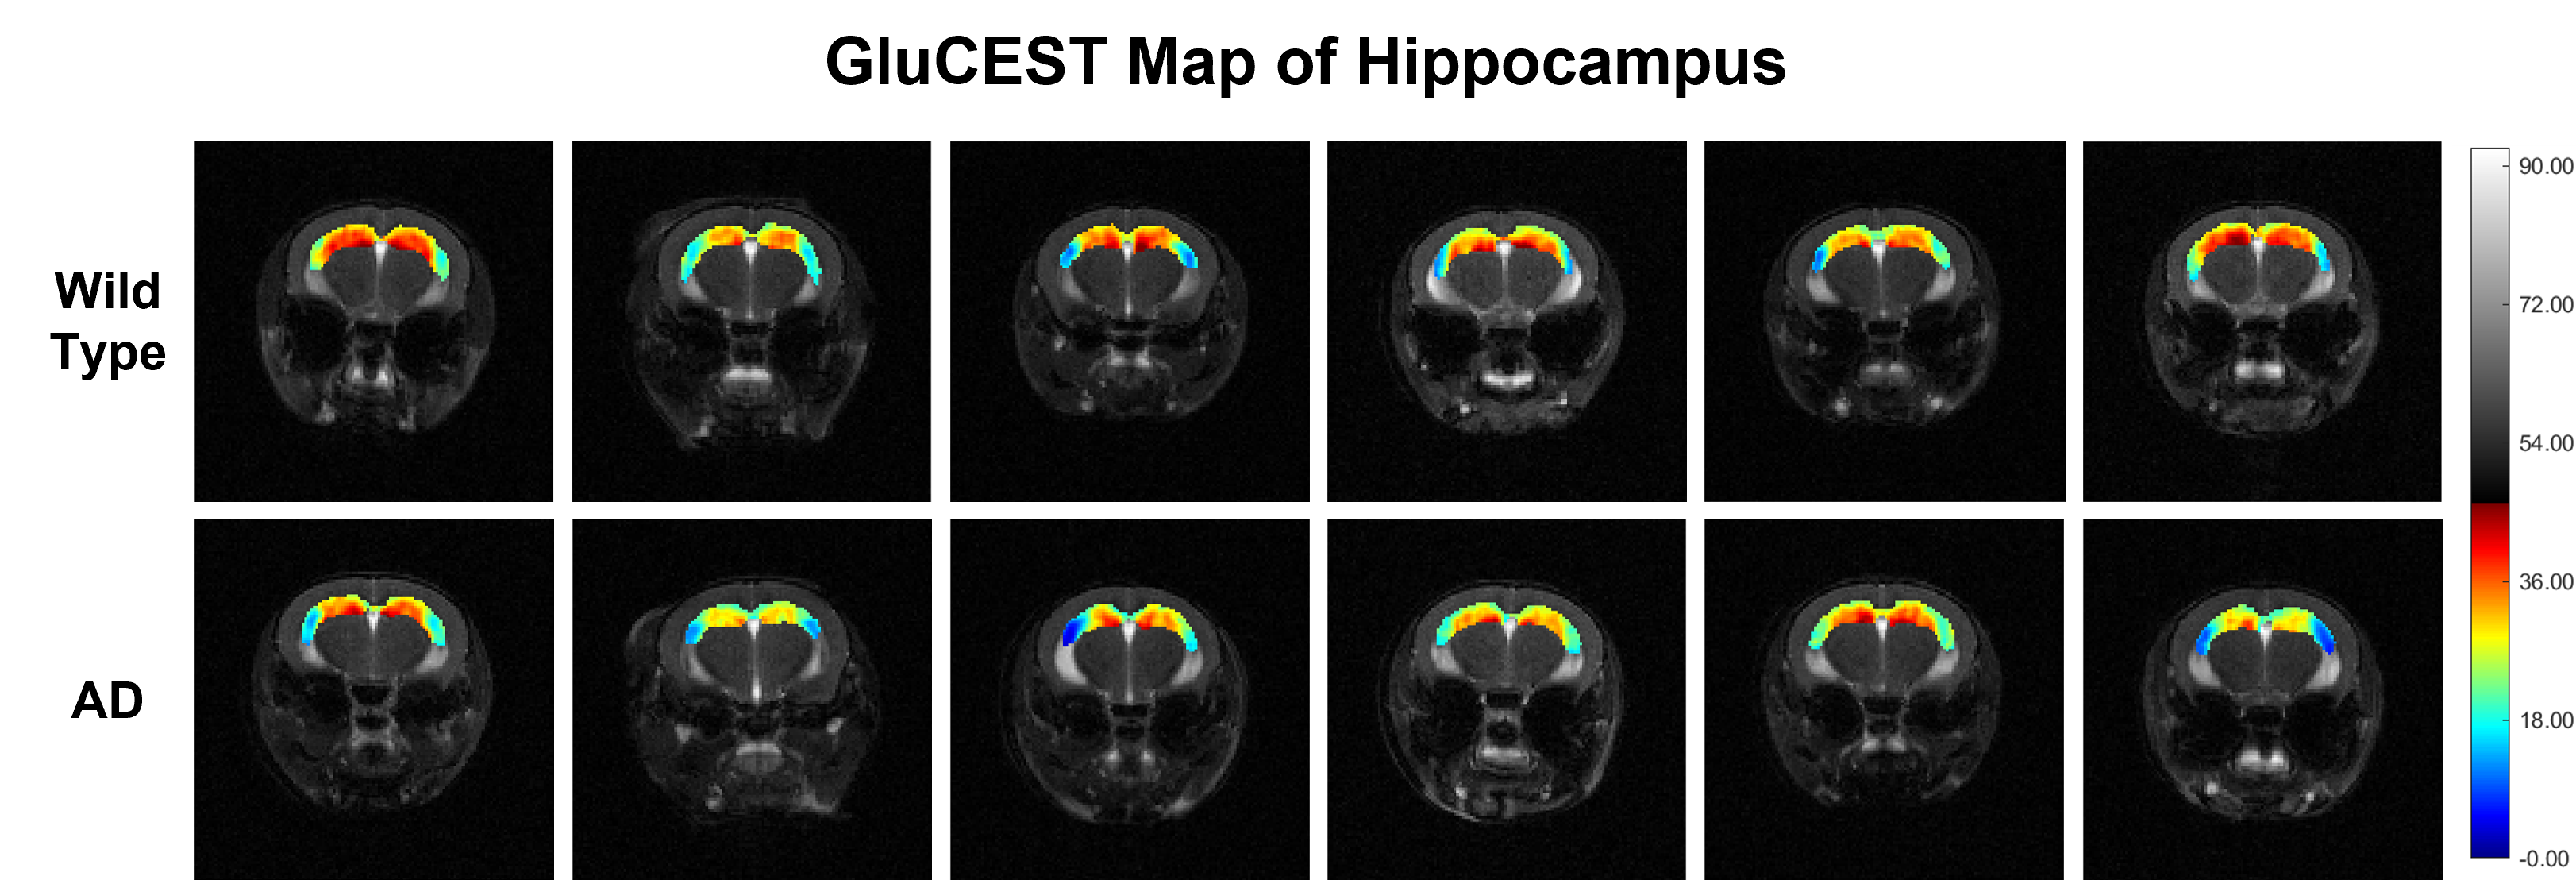
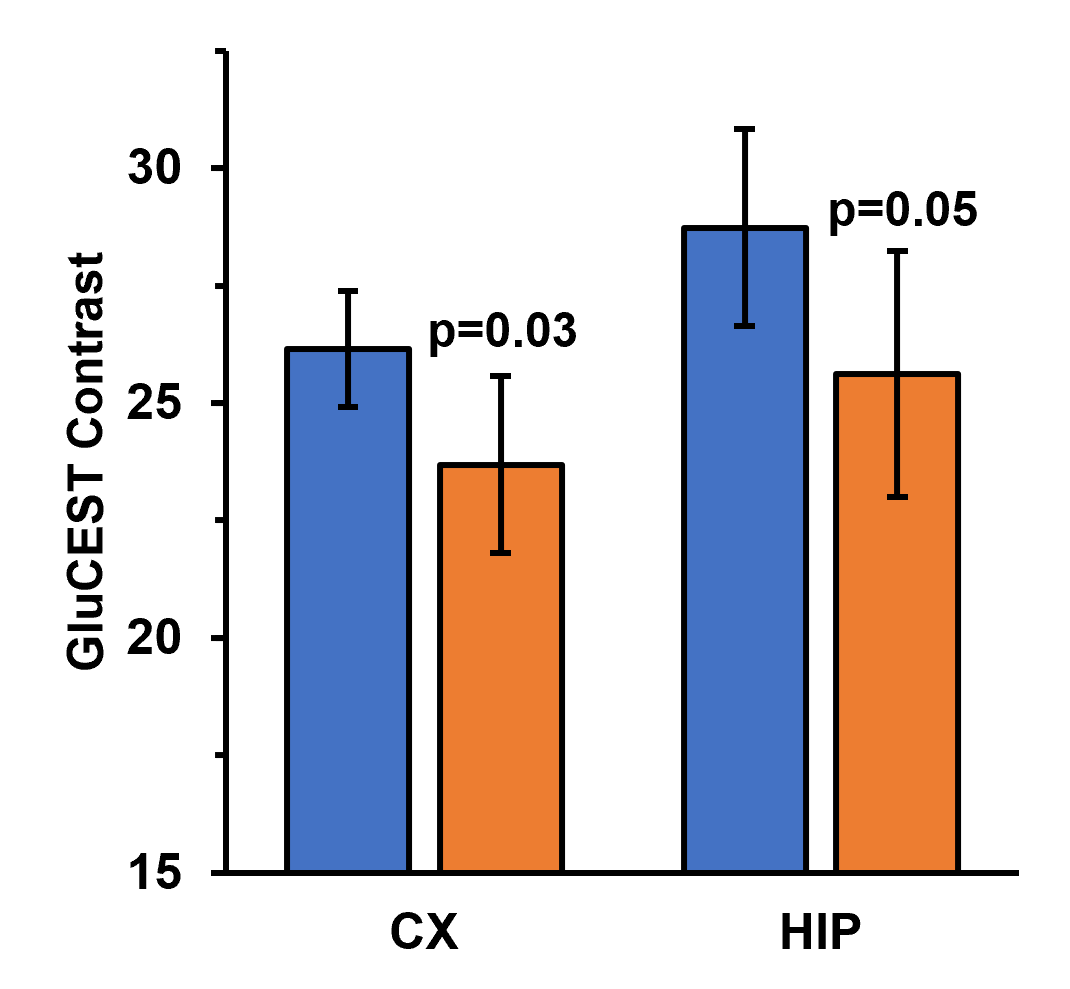
Representative anatomical (T2-weighted) and GluCEST images of the entire brain slice are shown in figure 1. GluCEST maps from the cerebral cortex and hippocampus of all 12 mice, generated after processing of the data are presented in Figures 2 and 3 respectively. The upper panel of the figures represents maps from wild-type mice whereas the lower is from AD mice in both the figures. Although, the contrast from the map itself is not very much different across the groups a trend of relatively lower contrast in AD mice can be observed, especially in the CA1 region of the hippocampus. To further compare the absolute values of GluCEST, these maps were quantified and we found that the mean GluCEST value in the cerebral cortex of AD mice (23.68±1.88) is significantly lower (-9.4%; p=0.026) compared to that of controls (26.15±1.22) (Figure 4). A similar trend was also observed in the hippocampus where the mean GluCEST value from AD mice was significantly reduced (p=0.048) by almost 11% when compared to controls.Discussions
The results obtained from this investigation clearly indicate a loss of ~10% in the glutamate pool from the cerebral cortex and hippocampus of these AD mice at this early stage. The cerebral cortex and hippocampus are the two primary brain regions involved in the regulation of motor and cognitive functions including memory11. Glutamate being the primary and major excitatory neurotransmitter is deeply involved in the exertion of these cognitive functions3. The impact of any loss in the total pool of glutamate in these brain regions is directly reflected in terms of compromised cognitive functions including impairment of memory, a typical phenotype observed in cases of AD10. Our findings of reduced glutamate levels in the cerebral cortex and hippocampus in the early stage of AD in these mice are clearly in accordance with the previous reports4,5,6. Further studies will be performed at later time points to clearly understand the pattern of perturbations in the glutamate homeostasis with the progression of the disease with age. This will help in understanding the utility of GluCEST imaging as a tool to diagnose AD at the early stages of its onset and track its progression.Acknowledgements
This project was supported by the National Institute of Biomedical Imaging and Bioengineering of the National Institutes of Health through Grant Number P41EB029460 and the National Institute of Aging through Award Number R01AG063869.References
1. Alzheimer's A (2016) 2016 Alzheimer's disease facts and figures. Alzheimer's Dement 12:459-509. 2. Erecinska M and Silver IA (1990) Metabolism and role of glutamate in mammalian brain. Prog Neurobiol 35:245-296.
3. Attwell D and Laughlin SB (2001) An energy budget for signaling in the grey matter of the brain. J Cereb Blood Flow Metab 21:1133-1145.
4. Chen SQ, Cai Q, Shen YY, Wang PJ, Teng GJ, Zhang W and Zang FC (2012) Age-related changes in brain metabolites and cognitive function in APP/PS1 transgenic mice. Behav Brain Res 235:1-6.
5. Patel AB, Tiwari V, Veeraiah P and Saba K (2018) Increased astroglial activity and reduced neuronal function across brain in AβPP-PS1 mouse model of Alzheimer's disease. J Cereb Blood Flow Metab 38:1213-1226.
6. Wang H, Tan L, Wang HF, Liu Y, Yin RH, Wang WY, Chang XL, Jiang T and Yu JT (2015) Magnetic Resonance Spectroscopy in Alzheimer's Disease: Systematic Review and Meta-Analysis. J Alzheimers Dis 46:1049-1070.
7. Saito, T., Matsuba, Y., Mihira, N., Takano, J., Nilsson, P., Itohara, S., Iwata, N., & Saido, T. C. (2014). Single App knock-in mouse models of Alzheimer's disease. Nature Neuroscience, 17(5), 661–663.
8. Kim M, Gillen J, Landman BA, et al. (2009) Water Saturation Shift Referencing (WASSR) for Chemical Exchange Saturation Transfer (CEST) Experiments. Mag Reson Med. 61(6):1441-1450.
9. Jack CR, Jr., Petersen RC, Xu Y, O'Brien PC, Smith GE, Ivnik RJ, Boeve BF, Tangalos EG and Kokmen E (2000) Rates of hippocampal atrophy correlate with change in clinical status in aging and AD. Neurology 55:484-489.
10. Pearson RC, Esiri MM, Hiorns RW, Wilcock GK and Powell TP (1985) Anatomical correlates of the distribution of the pathological changes in the neocortex in Alzheimer disease. Proc Natl Acad Sci USA 82:4531-4534.
11. Ito, I., & Sugiyama, H. (1991). Roles of glutamate receptors in long-term potentiation at hippocampal mossy fiber synapses. Neuroreport, 2(6), 333–336
Figures