3990
Tracking motor and cognitive network connectivity in MS over 2 years using SFCI, a pathway-combined connectivity metric1Cleveland Clinic Foundation, CLEVELAND, OH, United States
Synopsis
Motor and cognitive network integrity in multiple sclerosis over 2 years in patients receiving the same therapy was tracked using structural and functional connectivity index (SFCI), a metric that combines functional and structural connectivity along function-specific pathways and then forms a pathway-combined composite metric. Changes of the individual measures, functional connectivity and transverse diffusivity along transcallosal motor and frontoparietal cognitive pathways, were also tracked over 2 years. Pathway-combined SFCI was more efficient in tracking network integrity than the individual imaging measures or pathway-specific composite metric.
Introduction
In a recent longitudinal study of multiple sclerosis (MS) patients receiving the same therapy (fingolimod), initial worsening of motor and cognitive networks, as measured by resting state functional connectivity (fcMRI) diffusion tensor imaging (DTI), was followed by stabilization after 1st year of follow-up.1 Recently a combined fcMRI and DTI metric called structural and functional connectivity index (SFCI)2 has been proposed, which combines individual pathway specific fcMRI and transverse diffusivity (TD), and then combines metrics along different pathways to form the final metric, and is sensitive to disease status and functional decline.2 Disease progression over 2 years in MS patients treated with the same disease modifying therapy was studied using SFCI, combining functional and structural connectivity (fcMRI and TD respectively) along the transcallosal (TC) motor and right frontoparietal (FP) cognitive pathways.3 In this study we have compared sensitivity of SFCI to therapy-induced changes with each individual measure alone.Methods
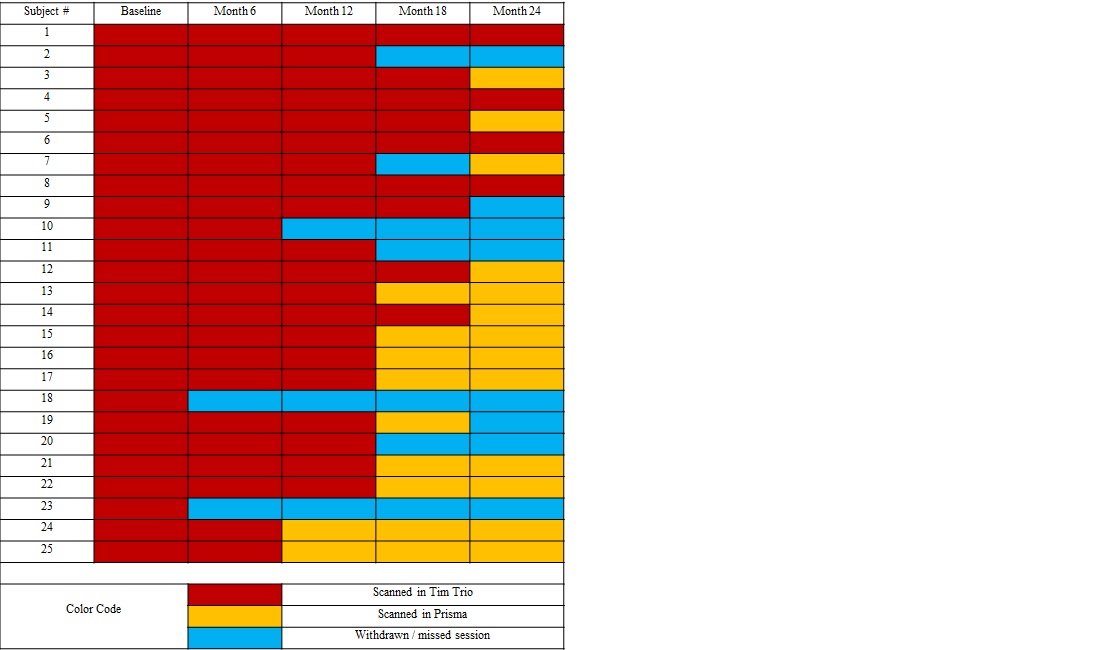
Data Acquisition: Details of data acquisition have been described previously.1 Twenty five patients with MS (10 male, mean age 42±8 y) participated in this study. Patients were scanned at 3-tesla MRI before (baseline) and at 6, 12, 18 and 24 months after starting fingolimod 0.5 mg daily under an internal review board- (IRB) approved protocol. Some patients were lost to follow-up as shown in Table 1.Patients were scanned in whole-body Siemens 3T scanner (Erlangen, Germany). Initial scanning was performed on a Tim Trio using a 12 channel head coil, which was upgraded to a Prisma using a 20 channel (16 head + 4 spine) coil (Erlangen, Germany) Four patients were scanned in the Tim Trio at all 5 time points, while the other patients had an upgrade sometime over the 2-year follow-up (Table 1). Patients were asked to bite onto a bite-bar during the anatomical and fcMRI scans to minimize motion. A 2-dimensional gradient-echo echoplanar scan was acquired to measure resting-state fcMRI, and high angular resolution whole brain DTI scan was acquired to perform tractography and TD.
Data Analysis: fcMRI and DTI data analyses were performed as in Bhattacharyya et al.1 Since SFCI involves both fcMRI and DTI metrics, data were discarded from subjects having motion in either of the scans. Functional and structural connectivity along the TC and right FP pathways were measured. TC fcMRI was calculated between bilateral primary motor cortices (M1), while FP fcMRI was calculated between right middle frontal gyrus (rMFG) and right inferior parietal lobule (rIPL). Similarly, TD along TC pathway was calculated with left and right M1 as seed and target respectively, and TD along FP pathway was calculated with rMFG and rIPL as seed and target respectively.
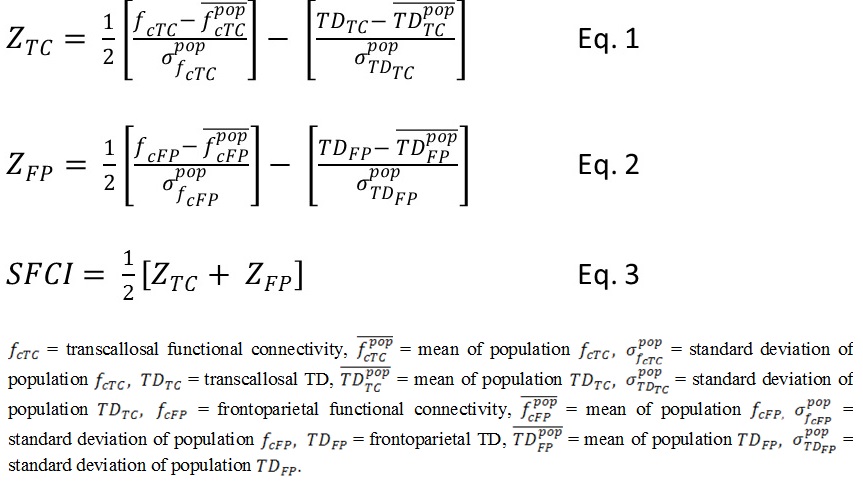
SFCI: SFCI was constructed as previously described2 by summing z-scored measures of pathway specific DTI and fcMRI. Motor and cognitive SFCI measures (ZTC and ZFP respectively) were computed following Eqs. 1 and 2 respectively (Fig. 1). Mean and standard deviations of population/sample fc and TD (for both TC and FP) were obtained from 17 healthy control scans at 3T performed at the same center. Pathway-combined SFCI was finally calculated by combining motor and cognitive SFCI measures following Eq. 3 (Fig. 1).
Statistical Analysis: Group TDTC, TDFP, fcTC, fcFP, ZFP and SFCI measures across the 5 time-points were evaluated by estimating the variables at different time-points after accounting for scanner upgrade and missing data points using linear mixed effect model fitting with lme44 in R (3.6.0). Time-points and scanner type were used as categorical variables and scanner upgrade was modeled as a fixed effect covariate in the analysis. Several contrasts (between different visits) were set with t-tests using Satterthwaite’s degrees of freedom method within lmerTest package5 in R. p < 0.05 was considered as statistically significant and 0.05<p≤0.10 was considered to be having a tendency toward significance.
Results and Discussion
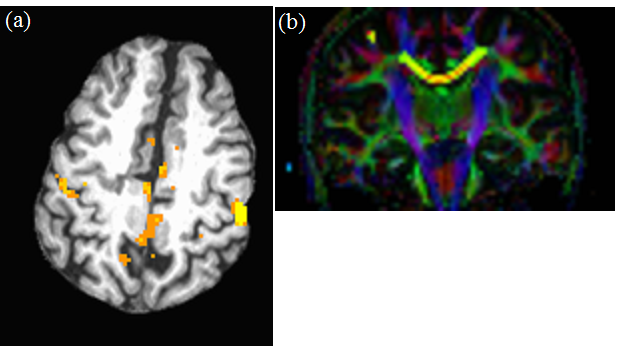
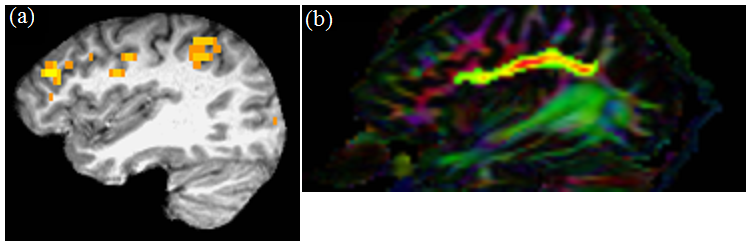
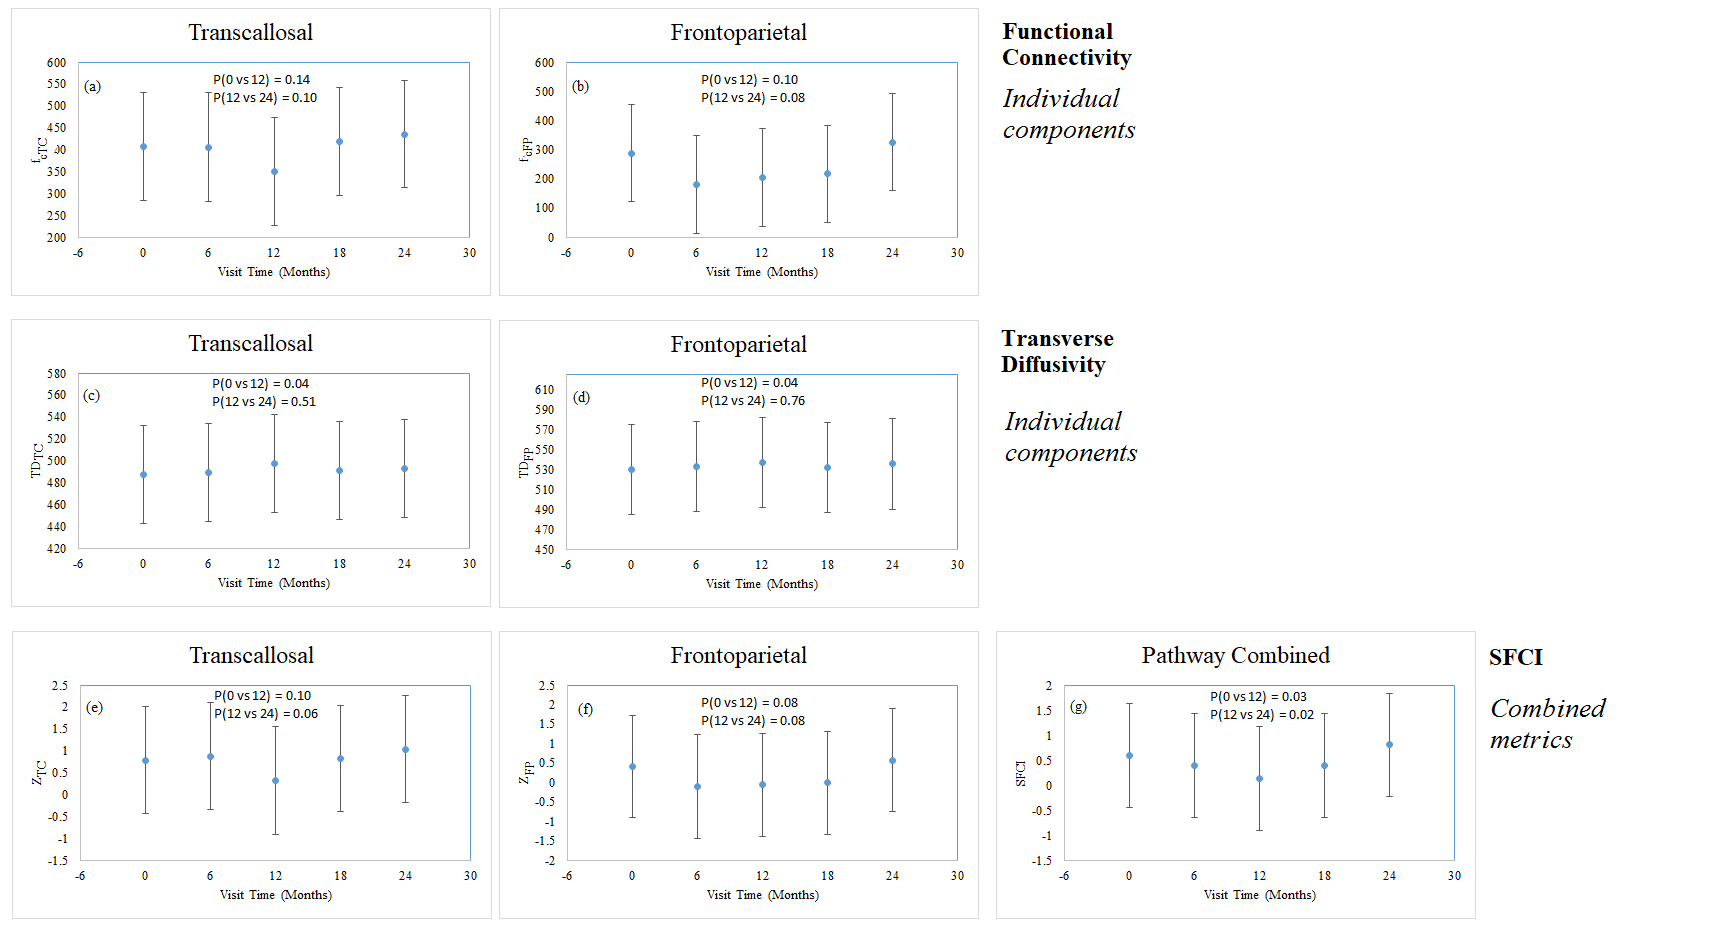
Data from 21 subjects satisfied the motion acceptance criteria.1 Representative single subject TC fcMRI map and fiber tracking image are shown in Figs. 2(a) and (b) respectively, while FP fcMRI map and fiber tracking images are shown in Figs. 3(a) and (b) respectively. Changes over 24 months in TC and FP fcMRI are shown in Figs. 4(a) and (b) respectively, and TD along TC and FP pathways are shown in Figs. 4(c) and (d) respectively. The combined structural and functional connectivity along motor and cognitive pathways (ZTC and ZFP respectively) over 24 months of fingolimod therapy are shown in Figs. 4(e) and (f) respectively; evolution of the pathway-combined SFCI is shown in Fig. 4(g).Lower fcMRI/higher TD along the TC and FP pathways are associated with motor6-8 and cognitive9, 10 impairment respectively. By construction, lower SFCI corresponds to lower fcMRI/higher TD, i.e. to worsening of motor/cognitive network integrity. The individual pathway-specific functional and structural connectivity measures (Figs. 4(a-d)) suggest worsening of motor and cognitive network integrity during the 1st year of follow-up with a recovery of both during the 2nd year in agreement with earlier report.1 Combining pathway-specific connectivities show the same trend (Figs. 4(e-f)), while pathway-combined SFCI (Fig. 4(g)) exhibit the same feature but with higher significance (lower P-values).
Conclusion
Motor and cognitive pathway-combined SFCI is more efficient to track network integrity/disease progression than individual pathway-specific fcMRI and DTI measures.Acknowledgements
Funding from Novartis, National Institutes of Health, National Multiple Sclerosis Society. We thank Thorsten Feiweier of Siemens Healthineers for developing the DTI pulse sequence and the monopolar+ functionality that was used in this study.References
1. Bhattacharyya PK, Lowe MJ, Sakaie KE, Li H, Lin J, Fox RJ. Changes in structural and functional connectivity during two years of fingolimod therapy for multiple sclerosis. Magn Reson Imaging. 2020;74:113-120.
2. Koenig KA, Beall EB, Sakaie KE, Ontaneda D, Stone L, Rao SM, Nakamura K, Jones SE, Lowe MJ. Evaluation of a connectivity-based imaging metric that reflects functional decline in Multiple Sclerosis. PLoS One. 2021;16(6):e0251338.
3. Bhattacharyya PK, Fox R, Lin J, Sakaie KE, Raska P, Lowe MJ. Tracking longitudinal disease progression of MS during fingolimod therapy using SFCI, a combined structural and functional connectivity metric. Proc. Intl. Soc. Mag. Reson. Med. 2021;29:2791.
4. Bates D, Machler M, Bolker B, Walker S. Fitting linear mixed-effects models using lme4. Journal of Statistical Software. 2015;67(1):1-48.
5. Kuznetsova A, Brockhoff PB, Christensen RHB. lmerTest Package: Tests in Linear Mixed Effects Models. Journal of Statistical Software. 2017;82(13):1-26.
6. Lowe MJ, Beall EB, Sakaie KE, Koenig KA, Stone L, Marrie RA, Phillips MD. Resting state sensorimotor functional connectivity in multiple sclerosis inversely correlates with transcallosal motor pathway transverse diffusivity. Hum Brain Mapp. 2008;29(7):818-827.
7. Lowe MJ, Horenstein C, Hirsch JG, Marrie RA, Stone L, Bhattacharyya PK, Gass A, Phillips MD. Functional pathway-defined MRI diffusion measures reveal increased transverse diffusivity of water in multiple sclerosis. Neuroimage. 2006;32(3):1127-1133.
8. Lowe MJ, Phillips MD, Lurito JT, Mattson D, Dzemidzic M, Mathews VP. Multiple sclerosis: low-frequency temporal blood oxygen level-dependent fluctuations indicate reduced functional connectivity initial results. Radiology. 2002;224(1):184-192.
9. Llufriu S, Martinez-Heras E, Solana E, Sola-Valls N, Sepulveda M, Blanco Y, Martinez-Lapiscina EH, Andorra M, Villoslada P, Prats-Galino A, Saiz A. Structural networks involved in attention and executive functions in multiple sclerosis. Neuroimage Clin. 2017;13:288-296.
10. Figueroa-Vargas A, Carcamo C, Henriquez-Ch R, Zamorano F, Ciampi E, Uribe-San-Martin R, Vasquez M, Aboitiz F, Billeke P. Frontoparietal connectivity correlates with working memory performance in multiple sclerosis. Sci Rep. 2020;10(1):9310.
Figures