3989
Association between SFCI, a robust pathway-combined connectivity metric and neurological scores in multiple sclerosis1Cleveland Clinic Foundation, CLEVELAND, OH, United States
Synopsis
Structural and functional connectivity index (SFCI) is a composite metric that combines structural and functional connectivity along different functionally specific pathways in multiple sclerosis. Performing functional connectivity and diffusion tensor imaging scans, we show that motor and cognitive pathway-combined SFCI is closely associated with multiple sclerosis functional composite, a composite neurological metric. Pathway-combined SFCI shows stronger association with MSFC than motor or cognitive pathway-specific composite metrics. Results from this study support the use of SFCI and composite pathway-based imaging measures as surrogate biomarkers for MS disease status and progression.
Introduction
Multiple sclerosis functional composite (MSFC) provides a composite neurological metric of motor and cognitive impairments in multiple sclerosis (MS), a disorder characterized by heterogeneity of symptoms. Structural and functional connectivity index (SFCI), an equivalent composite imaging metric has recently been formulated, which combines structural and functional connectivity along different functionally specific pathways.1 Functional and structural connectivity, as measured by functional connectivity MRI (fcMRI) and transverse diffusivity (Td) obtained from diffusion tensor imaging respectively, are combined along functionally specific pathways and then the pathway-specific connectivity metrics are combined to obtain SFCI. Recently, correlation between individual connectivity and neurological measures were reported in motor and cognitive domains along transcallosal (TC) and frontoparietal (FP) pathways respectively.2 Here we probe relationships between individual and composite neurological measures with SFCI and its individual components along TC and FP pathways.Methods
Data Acquisition: Twenty five patients with MS (42.0±8.6 y, 10 male) were scanned following an institutional review board approved protocol on a Siemens 3T Tim Trio scanner with a 12-channel head coil. Scan protocol consisted of (i) fcMRI with a 2D GRE echoplanar scan (TR/TE=2800/29 ms, 31 slices, slice thickness 4mm, no gap, 128×128 matrix, 256mm × 256mm FOV, bandwidth 1954 Hz/pixel, 6/8 partial Fourier, 137 repetitions, eyes closed) and (ii) DTI with high angular resolution diffusion imaging (2mm isotropic, 71 diffusion-weighting gradients with b=1000sec/mm2 and 8 b=0 volumes, NEX=4). Pulse plethysmograph and respiratory bellow were used to monitor physiologic fluctuations during fcMRI scans, and a bite bar was used to minimize motion.Neurological performance assessment: Upper limb and lower limb motor performances were assessed by (9HPT),3, 4 and timed 25-foot walk (T25FW) test5 respectively, while cognitive processing speed was measured by symbol digit modality test (SDMT).6, 7
Data Analysis: Structural and functional connectivity along TC and right FP pathways were measured as described in an earlier report.2
Seed and Target Region Definition: Seeds and targets for (i) TC and (ii) FP used in analyse were (i) left and right primary motor cortices (M1) and (ii) right middle frontal gyrus (rMFG) and right inferior parietal lobule respectively. InstaCorr based method8 as in reference2 was used for seed and target selection.
SFCI: SFCI was constructed by summing z-scored measures of pathway specific DTI and fcMRI.9
Motor, cognitive and combined SFCI measures: Z-scored motor and cognitive SFCI metrics were calculated following Eqs. 1 and 2 (ZTC and ZFP respectively, Fig. 1). Mean and standard deviations of population/sample fc and TD were obtained from 17 healthy control scans at 3T performed at the same center. Pathway-combined SFCI was finally calculated from a composite motor and cognitive SFCI measures following Eq. 3 (Fig. 1).
Composite neurological scores: Neurological scores were combined following the procedure of MSFC formulation.10 Since TC pathway in MS is associated with upper limb performance,11 9HPT (average of dominant and non-dominants hands’ scores) and SDMT were combined to form a pathway-relevant composite neurological metric (9HPT_SDMT) . In addition, MSFC was calculated by combining 9HPT, T25FW and SDMT.12
Statistical analysis: Pearson correlation coefficients were obtained between individual / composite neurological measures and individual / composite (SFCI) imaging measures.
Results and Discussion
Data from 4 subjects did not pass motion acceptance criteria and were discarded. Representative images of single subject TC fcMRI maps and fiber tracking images are shown in Fig. 2(a-b), and FP fcMRI maps and fiber tracking images are shown in Fig. 2(c-d). Correlation coefficients between individual/combined neurological measures with SFCI/individual imaging components are shown in Table 1. By formulation, worsening of motor/cognitive network integrity is characterized by lower SFCI, i.e. with lower fcMRI / higher TD. From the table it is evident that structural connectivity, as measured by Td, drives the correlation with pathway-specific as well as pathway-combined neurological scores, similar to that observed along TC and a cognitive pathway associated with episodic memory.1 While pathway-specific combined SFCI (ZTC and ZFP) correlate with SDMT and the composite neurological scores (9HPT_SDMT and MSFC), the correlations are more significant when the pathway-combined metric, SFCI, is considered. SFCI does not only correlate with the 9HPT_SDMT, the composite metric directly relevant to the pathways investigated in this study, but it also correlates with overall MSFC with T25FW included. This demonstrates the robustness of the TC and FP pathway connectivity combined metric SFCI in its association with neurologic performance.Conclusion
Composite neurological scores are associated with motor and cognitive pathway-specific SFCI, and the association is stronger with pathway-combined SFCI metric. This result supports the use of SFCI and composite pathway-based imaging measures as surrogate biomarkers for MS disease status and progressionAcknowledgements
Funding from Novartis, National Institutes of Health, National Multiple Sclerosis Society. We thank Thorsten Feiweier of Siemens Healthineers for developing the DTI pulse sequence and the monopolar+ functionality that was used in this study.References
1. Koenig KA, Beall EB, Sakaie KE, Ontaneda D, Stone L, Rao SM, Nakamura K, Jones SE, Lowe MJ. Evaluation of a connectivity-based imaging metric that reflects functional decline in Multiple Sclerosis. PLoS One. 2021;16(6):e0251338.
2. Bhattacharyya PK, Lowe MJ, Sakaie KE, Li H, Lin J, Fox RJ. Changes in structural and functional connectivity during two years of fingolimod therapy for multiple sclerosis. Magn Reson Imaging. 2020;74:113-120.
3. Filippi M, Horsfield MA, Adáer HJ, Barkhof F, Bruzzi P, Evans A, Frank JA, Grossman RI, McFarland HF, Molyneux P, Paty DW, Simon J, Tofts PS, Wolinsky JS, Miller DH. Guidelines for using quantitative measures of brain magnetic resonance imaging abnormalities in monitoring the treatment of multiple sclerosis. Annals of Neurology. 1998;43(4):499-506.
4. Goodkin DE, Hertsgaard D, Seminary J. Upper extremity function in multiple sclerosis: improving assessment sensitivity with box-and-block and nine-hole peg tests. Arch Phys Med Rehabil. 1988;69(10):850-854.
5. Filippi M, Iannucci G, Cercignani M, Assunta Rocca M, Pratesi A, Comi G. A quantitative study of water diffusion in multiple sclerosis lesions and normal-appearing white matter using echo-planar imaging. Archives of Neurology. 2000;57(7):1017-1021.
6. Genova HM, Hillary FG, Wylie G, Rypma B, Deluca J. Examination of processing speed deficits in multiple sclerosis using functional magnetic resonance imaging. J Int Neuropsychol Soc. 2009;15(3):383-393.
7. Smith A. Symbol Digits Modalities Test: Manual. West Psychol Sci. 1982:Los Angeles Western Psychological Services.
8. Cox R, Saad Z. InstaCorr in AFNI and SUMA. Second Biennial International Conference on Resting-State Functional Brain Connectivity. Milwaukee, WI; 2010.
9. Lowe MJ, Koenig KA, Beall E, Lin J, Sakaie KE, Srone L, Phillips MD. Combined Anatomic and Functional Connectivity Metric for Tracking Disease Progression in MS. Proc. Intl. Soc. Mag. Reson. Med. 2016;24:4053.
10. Fischer JS, Rudick RA, Cutter GR, Reingold SC. The Multiple Sclerosis Functional Composite Measure (MSFC): an integrated approach to MS clinical outcome assessment. National MS Society Clinical Outcomes Assessment Task Force. Mult Scler. 1999;5(4):244-250.
11. Lowe MJ, Horenstein C, Hirsch JG, Marrie RA, Stone L, Bhattacharyya PK, Gass A, Phillips MD. Functional pathway-defined MRI diffusion measures reveal increased transverse diffusivity of water in multiple sclerosis. Neuroimage. 2006;32(3):1127-1133.
12. Drake AS, Weinstock-Guttman B, Morrow SA, Hojnacki D, Munschauer FE, Benedict RH. Psychometrics and normative data for the Multiple Sclerosis Functional Composite: replacing the PASAT with the Symbol Digit Modalities Test. Mult Scler. 2010;16(2):228-237.
Figures
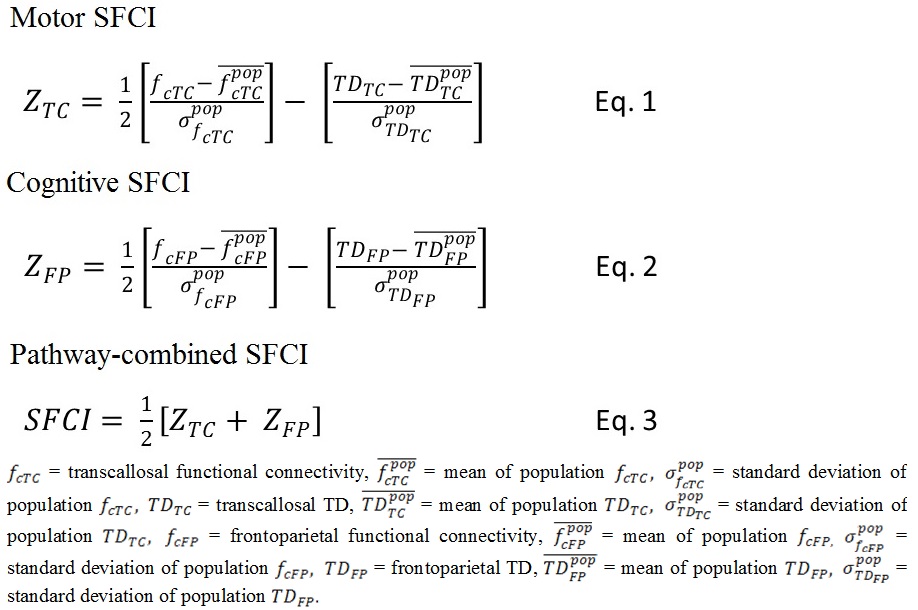
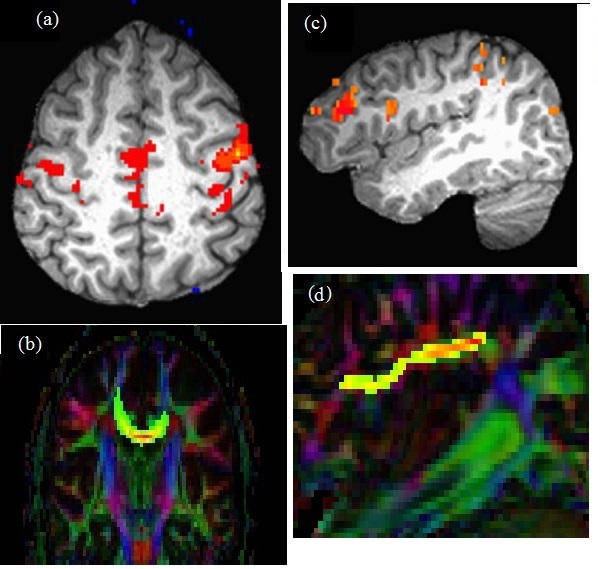
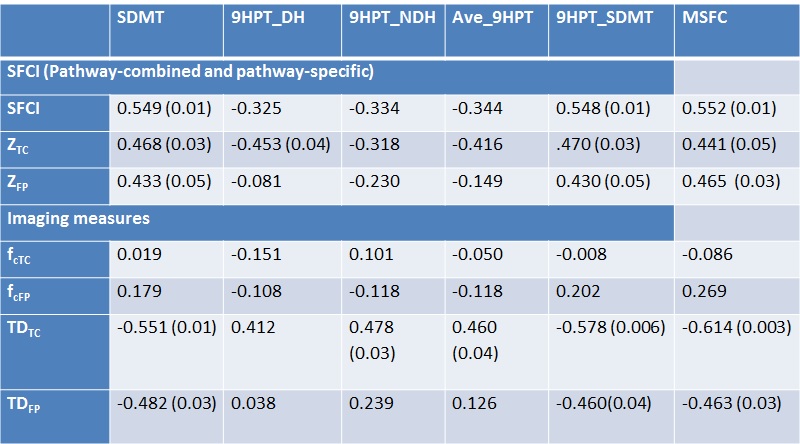
Table 1. Pearson correlation coefficients between SFCI metrics / imaging measures and individual / composite neurological scores. Uncorrected P-values for significant correlations are shown in parentheses.