3987
T2 mapping in Alzheimer’s Disease from Standard Sequences
Gitanjali Chhetri1, Kelly C. McPhee2, and Alan H. Wilman1
1Biomedical Engineering, University of Alberta, Edmonton, AB, Canada, 2Medical Physics, CancerCare Manitoba, Winnipeg, MB, Canada
1Biomedical Engineering, University of Alberta, Edmonton, AB, Canada, 2Medical Physics, CancerCare Manitoba, Winnipeg, MB, Canada
Synopsis
T2 mapping was applied retrospectively to healthy subjects, mild cognitive impairment (MCI) and Alzheimer’s disease (AD) by deriving the T2 from modelling standard dual-echo proton density and T2-weighted fast spin echo sequence, as used in the Alzheimer’s disease and Neuroimaging Initiative (ADNI-1). T2 differences were compared to volume changes in hippocampus and thalamus. In both regions, T2 mapping showed significant differences between MCI and healthy subjects while volume measures did not. Volume was more effective for distinguishing MCI from AD, due to profound hippocampal atrophy. By modelling actual refocusing angles, T2 mapping revealed differences between healthy, MCI and Alzheimer’s subjects.
Introduction
Classical transverse relaxation (T2) mapping sequences are time consuming in nature and hence are not feasible in most clinical settings. Rapid fingerprinting alternatives tend to have reduced spatial resolution compared to standard clinical images. However, proton density (PD) and T2-weighted images, are frequently acquired in the clinic and in dementia research. Retrospective T2 quantification from standard PD and T2-weighted fast spin echo (FSE) images using Bloch based modelling has been shown to minimize the biases in T2 quantification by accounting for differences in pulse sequences between vendors and sites.1 T2 relaxation time is sensitive to a wide range of microstructural changes and is mainly impacted by the physical properties of the tissue and its surrounding environment.2 In the context of Alzheimer’s disease (AD), many have correlated changes in tissue T2 value to disease severity and progression with contradictory results.3-6 The contradictory results may be due to differences in the T2 mapping techniques and their inherent biases or sensitivities, differences in defining region-of-interests, or just due to the discrepancies in the recruited AD patients. Here we examine regional T2 variation between normal, mild cognitive impairment (MCI), and AD groups from the Alzheimer’s disease and Neuroimaging Initiative (ADNI-1) database using the Bloch based T2 mapping technique.Methods
Data: 3T MRI data of 14 healthy (nine female, five male, mean age 73 yrs, range 59 – 80 yrs), 23 MCI (eight female, 15 male, mean age 75 yrs, range 56 – 87 yrs) , and 17 AD subjects (12 female, 5 male, mean age 73 yrs, range 62-87 yrs) were obtained from the ADNI-1 3T baseline database. All studies used a 2D dual-echo FSE sequence with parameters: TE1 9.7–12.0 ms, TE2 97.0–99.0 ms, TR 3000 ms, echo train length 14, refocusing flip train 165°-150°-150°-…, echo spacing 10.0–12.3 ms, 48 slices, voxel size 3.0 × 0.94 × 0.94 mm3, matrix size 256 × 256, and acquisition time 5 min. ADNI-1 also included a 3D calibration scan with body coil for both transmit and receive which was used to estimate the B1+ transmit field.1 The calibration scan used: flip angle 2°, TE 1.08 ms, TR 3.3 ms, 96 slices, voxel size 2.5 × 2.3 × 2.3 mm3, matrix size 128 × 128, and acquisition time ~40 s.Analysis: T2 maps were computed by applying Bloch-based fitting using the dual-echo PD and T2-weighted images as previously described.7 B1+ maps were calculated from the ADNI-1 3D calibration scans as previously described.1 Regions-of-interests (ROIs), including thalamus, hippocampus, genu, and splenium were segmented on high-resolution T1-weighted images using FSL v6.0 and volBrain and then transferred to FSE’s native space. All registrations and ROIs were manually inspected. Kruskal–Wallis one-way ANOVA test with Dunn’s test for pairwise comparisons was used to analyze differences between the groups. All tests were two-tailed with a significance level of 0.05.
Results
Between group T2 measurements using two-point Bloch-based method for hippocampus and thalamus are shown in Figure 1(a) and Figure 2(a) respectively. Figure 1(b) presents volume measurements for hippocampus. Figure 2(b) depicts age related variation in thalamus T2 value for each group.Mean T2 value of hippocampus was found to be significantly higher in both MCI and AD groups compared to healthy subjects. Mean hippocampus volume was significantly lower in the AD group, but there was not a significant difference between MCI and healthy subjects for hippocampal volume. While Thalamus showed significantly higher T2 values in the MCI group, Figure 2(b) indicates that age is strongly related with thalamus T2 in normal ageing.
T2 values for Genu and Splenium are illustrated in Figure 3, with both structures having a significant difference between healthy subjects and MCI.
Discussion
Profound hippocampal volume loss is common in AD; however, volume losses in MCI may be more subtle to detect. T2 mapping has been shown to be sensitive to tissue damage in AD and MCI.9 Here we used standard clinical FSE sequences, retrospectively analyzed from the ADNI-1 database to demonstrate the value of T2 modelling using the actual refocusing angles. This approach requires knowledge of the pulse sequence shape and flip angle train, and uses an estimation process to calculate the transmit B1+ field. In this way, many of the biases present in scans at different sites or with different vendors are eliminated. Our findings were significant differences between healthy subjects and both MCI and AD in T2 values, but no differences were significant between MCI and AD. Thus T2 and volume measures were complementary in providing a more complete picture of changes in MCI and AD.Conclusion
Using Bloch based modelling, T2 mapping from standard dual-echo clinical sequences provides discrimination between MCI and healthy subjects.Acknowledgements
Data collection and sharing was funded by the Alzheimer's Disease Neuroimaging Initiative (ADNI). Contract grant sponsorship is provided by the Canadian Institutes of Health Research.References
- Chhetri, Gitanjali, et al. "Bloch modelling enables robust T2 mapping using retrospective proton density and T2-weighted images from different vendors and sites." NeuroImage 237 (2021): 118116.
- Sedlacik, Jan, et al. "Reversible, irreversible and effective transverse relaxation rates in normal aging brain at 3 T." Neuroimage 84 (2014): 1032-1041.
- Campeau, Norbert G., et al. "Hippocampal transverse relaxation times in patients with Alzheimer disease." Radiology 205.1 (1997): 197-201.
- Wendel, J. D., et al. "The relationship between quantitative T2 relaxometry and memory in nonlesional temporal lobe epilepsy." Epilepsia 42.7 (2001): 863-868.
- Knight, Michael J., et al. "T2 Relaxometry and diffusion tensor indices of the hippocampus and entorhinal cortex improve sensitivity and specificity of MRI to detect amnestic mild cognitive impairment and Alzheimer's disease dementia." Journal of Magnetic Resonance Imaging 49.2 (2019): 445-455.
- Haley, Andreana P., et al. "Shortening of hippocampal spin-spin relaxation time in probable Alzheimer's disease: a 1H magnetic resonance spectroscopy study." Neuroscience letters 362.3 (2004): 167-170.
- McPhee, Kelly C., and Alan H. Wilman. "T2 quantification from only proton density and T2-weighted MRI by modelling actual refocusing angles." Neuroimage 118 (2015): 642-650.
- Bartzokis, George, et al. "Heterogeneous age-related breakdown of white matter structural integrity: implications for cortical “disconnection” in aging and Alzheimer’s disease." Neurobiology of aging 25.7 (2004): 843-851.
- Wearn, Alfie R., et al. "T2 heterogeneity: a novel marker of microstructural integrity associated with cognitive decline in people with mild cognitive impairment." Alzheimer's research & therapy 12.1 (2020): 1-14.
Figures
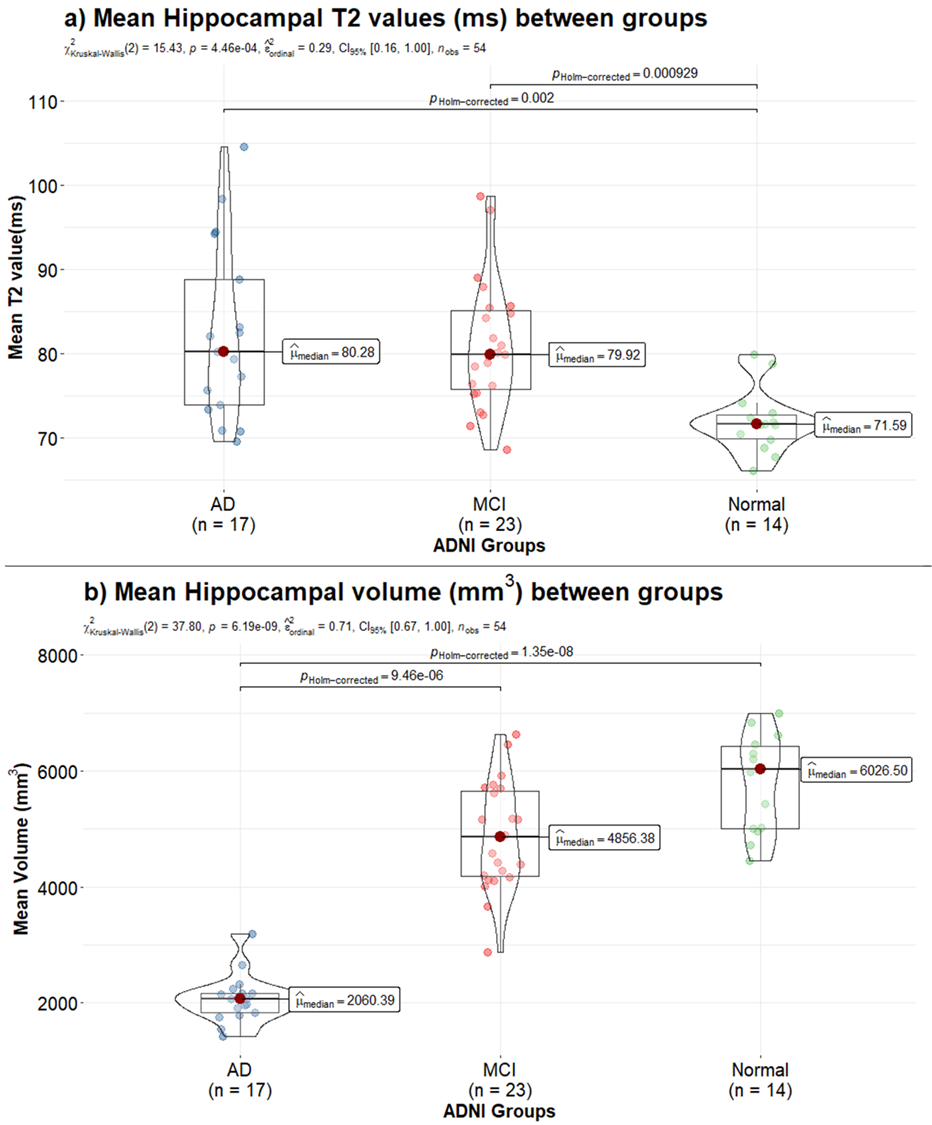
Figure 1: Mean hippocampus T2 (ms) values across
Alzheimer’s disease (AD), Mild Cognitive Impairment (MCI), and healthy control
subjects are compared in (a). Variation in mean hippocampus volume (mm3)
amongst the three groups is show in (b). Mean T2 values increase significantly
from normal to MCI and normal to AD. Mean hippocampus volume is lower in the
diseased group, with significantly lower volume in the AD group.
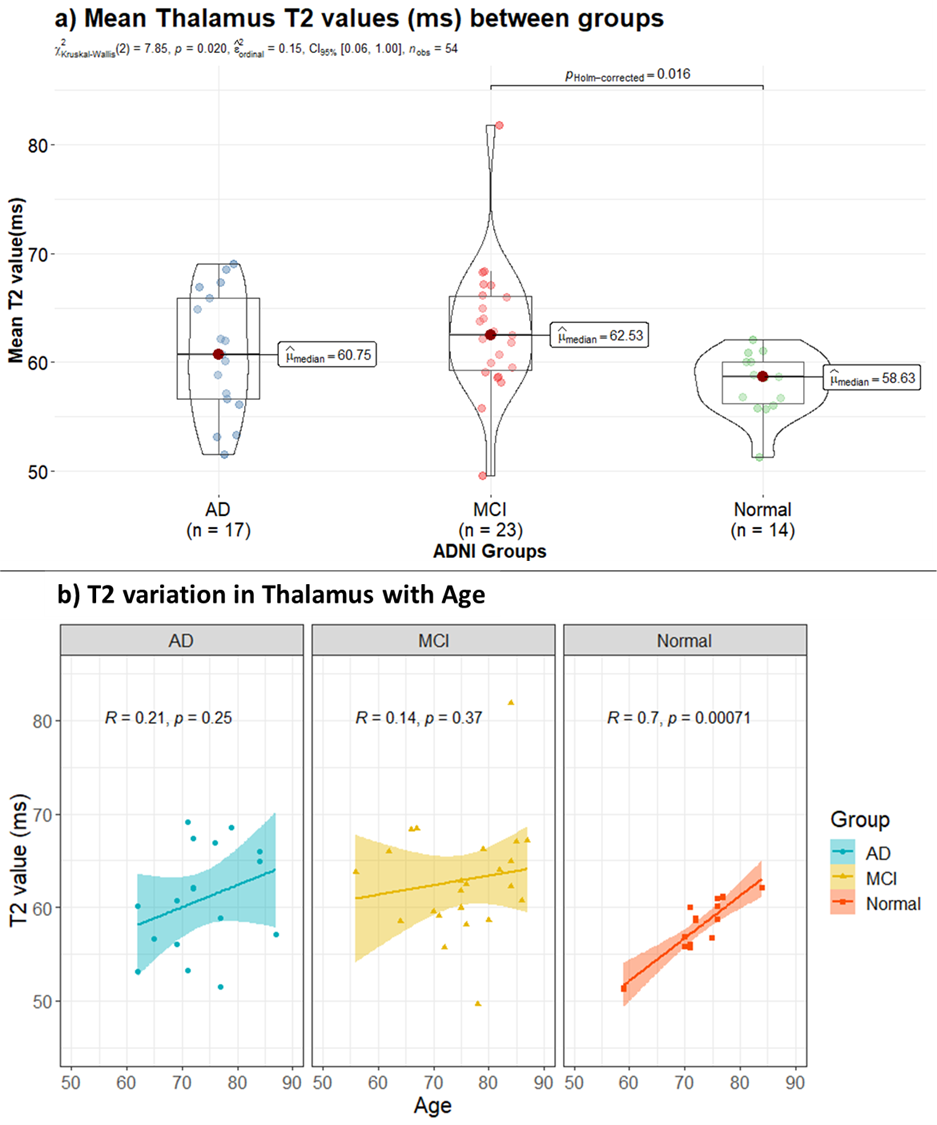
Figure 2: Mean thalamus T2 (ms) values across
Alzheimer’s Disease (AD), Mild Cognitive Impairment (MCI), and healthy controls
subjects are compare in (a). Change in thalamus T2 with age across the three
groups is shown in (b). T2 values are
higher in the diseased group and values increase significantly from normal to
MCI. T2 increases linearly in normal ageing in this age range, whereas in
diseased ageing there is no correlation with age.
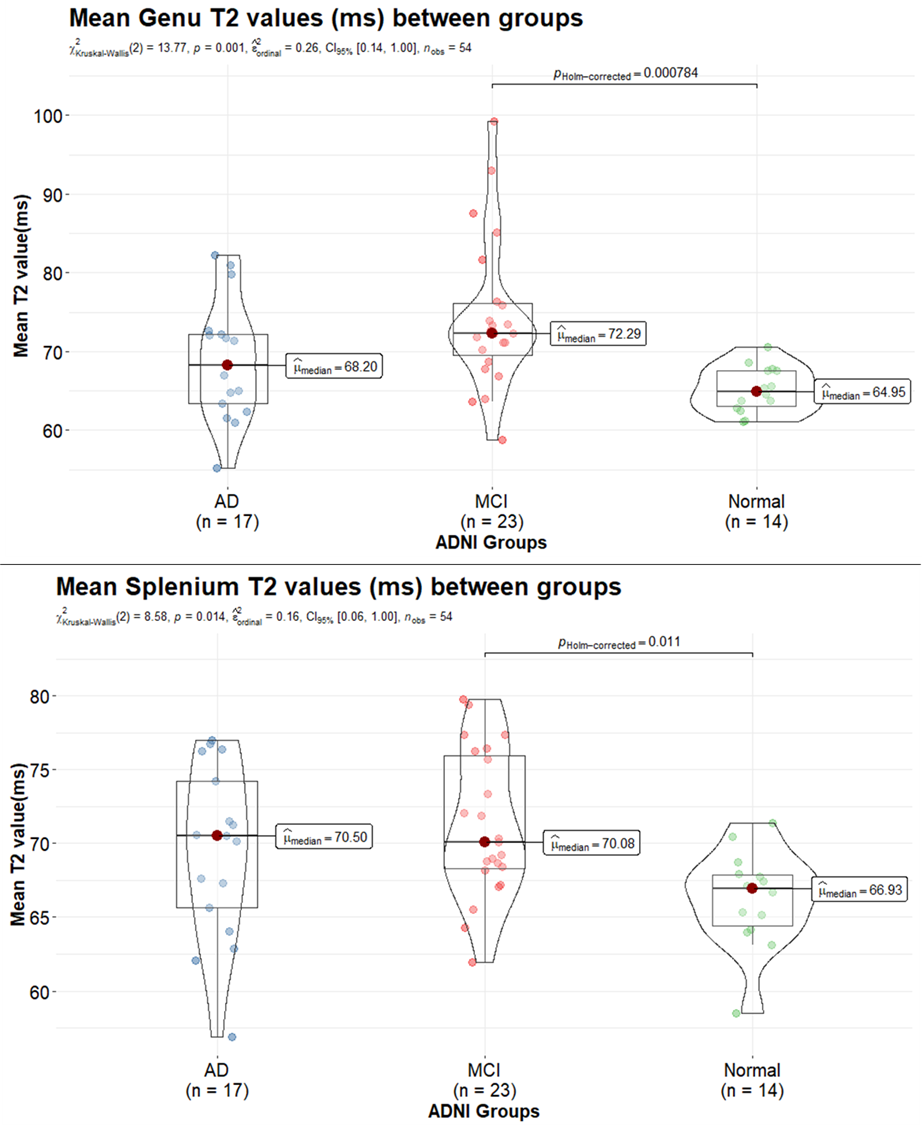
Figure 3: Comparison of mean T2 (ms) in genu (top)
and splenium (bottom) values across Alzheimer’s Disease (AD), Mild Cognitive
Impairment (MCI), and normal control subjects is depicted. T2 increases with
myelin breakdown which likely drives the increased T2 in the MCI and AD groups.
DOI: https://doi.org/10.58530/2022/3987