3986
Brain Ultrashort-T2* component measurements in patients with multiple sclerosis1Department of Radiology and Biomedical Imaging, University of California, San Francisco, San Francisco, CA, United States, 2UC Berkeley - UCSF Graduate Program in Bioengineering, Berkeley and San Francisco, CA, United States, 3Department of Neurology, University of California, San Francisco, San Francisco, CA, United States
Synopsis
This work presents a study measuring and characterizing the brain ultrashort-T2* component in patients suffering from MS. Our results show that the measured T2* relaxation time of the ultrashort-T2* component is significantly lower in almost all white matter ROIs measured. Fitted signal curves for the fractional component suggest the fractional component fits well in certain patients but not as well in others suggesting a more robust fitting model may be necessary for using this UTE relaxometry technique in patients with MS.
Introduction
Myelin plays a critical role in facilitating rapid neural signal conduction across the brain. The degree of myelination and its structure are key features that can characterize many neurological disorders including demyelinating diseases such as multiple sclerosis. MRI is the preferred imaging modality for assessing myelin given its sensitivity to water content, binding, and diffusion. Recent studies have characterized ultrashort-T2* components in the brain using a novel ultrashort echo time (UTE) relaxometry method. These components are most likely associated with metheylene protons in myelin phospholipid membranes and are a potentially more direct measure of myelination1-5.Multiple sclerosis is a neurodegenerative disease characterized by demyelination and loss of structure of myelin. Conventional MRI techniques used to image MRI lesions (i.e. T2 FLAIR) have played an important role in both research and clinical settings helping to diagnose and monitor disease progression. However, these techniques are limited in their sensitivity and specificity and struggle at identifying the pathology underlying observed lesions6. In this work, we present a study using a novel UTE acquisition and relaxometry approach to quantify different components of the ultrashort-T2* component in patients suffering from MS and compare these measurements to healthy volunteers.
Methods
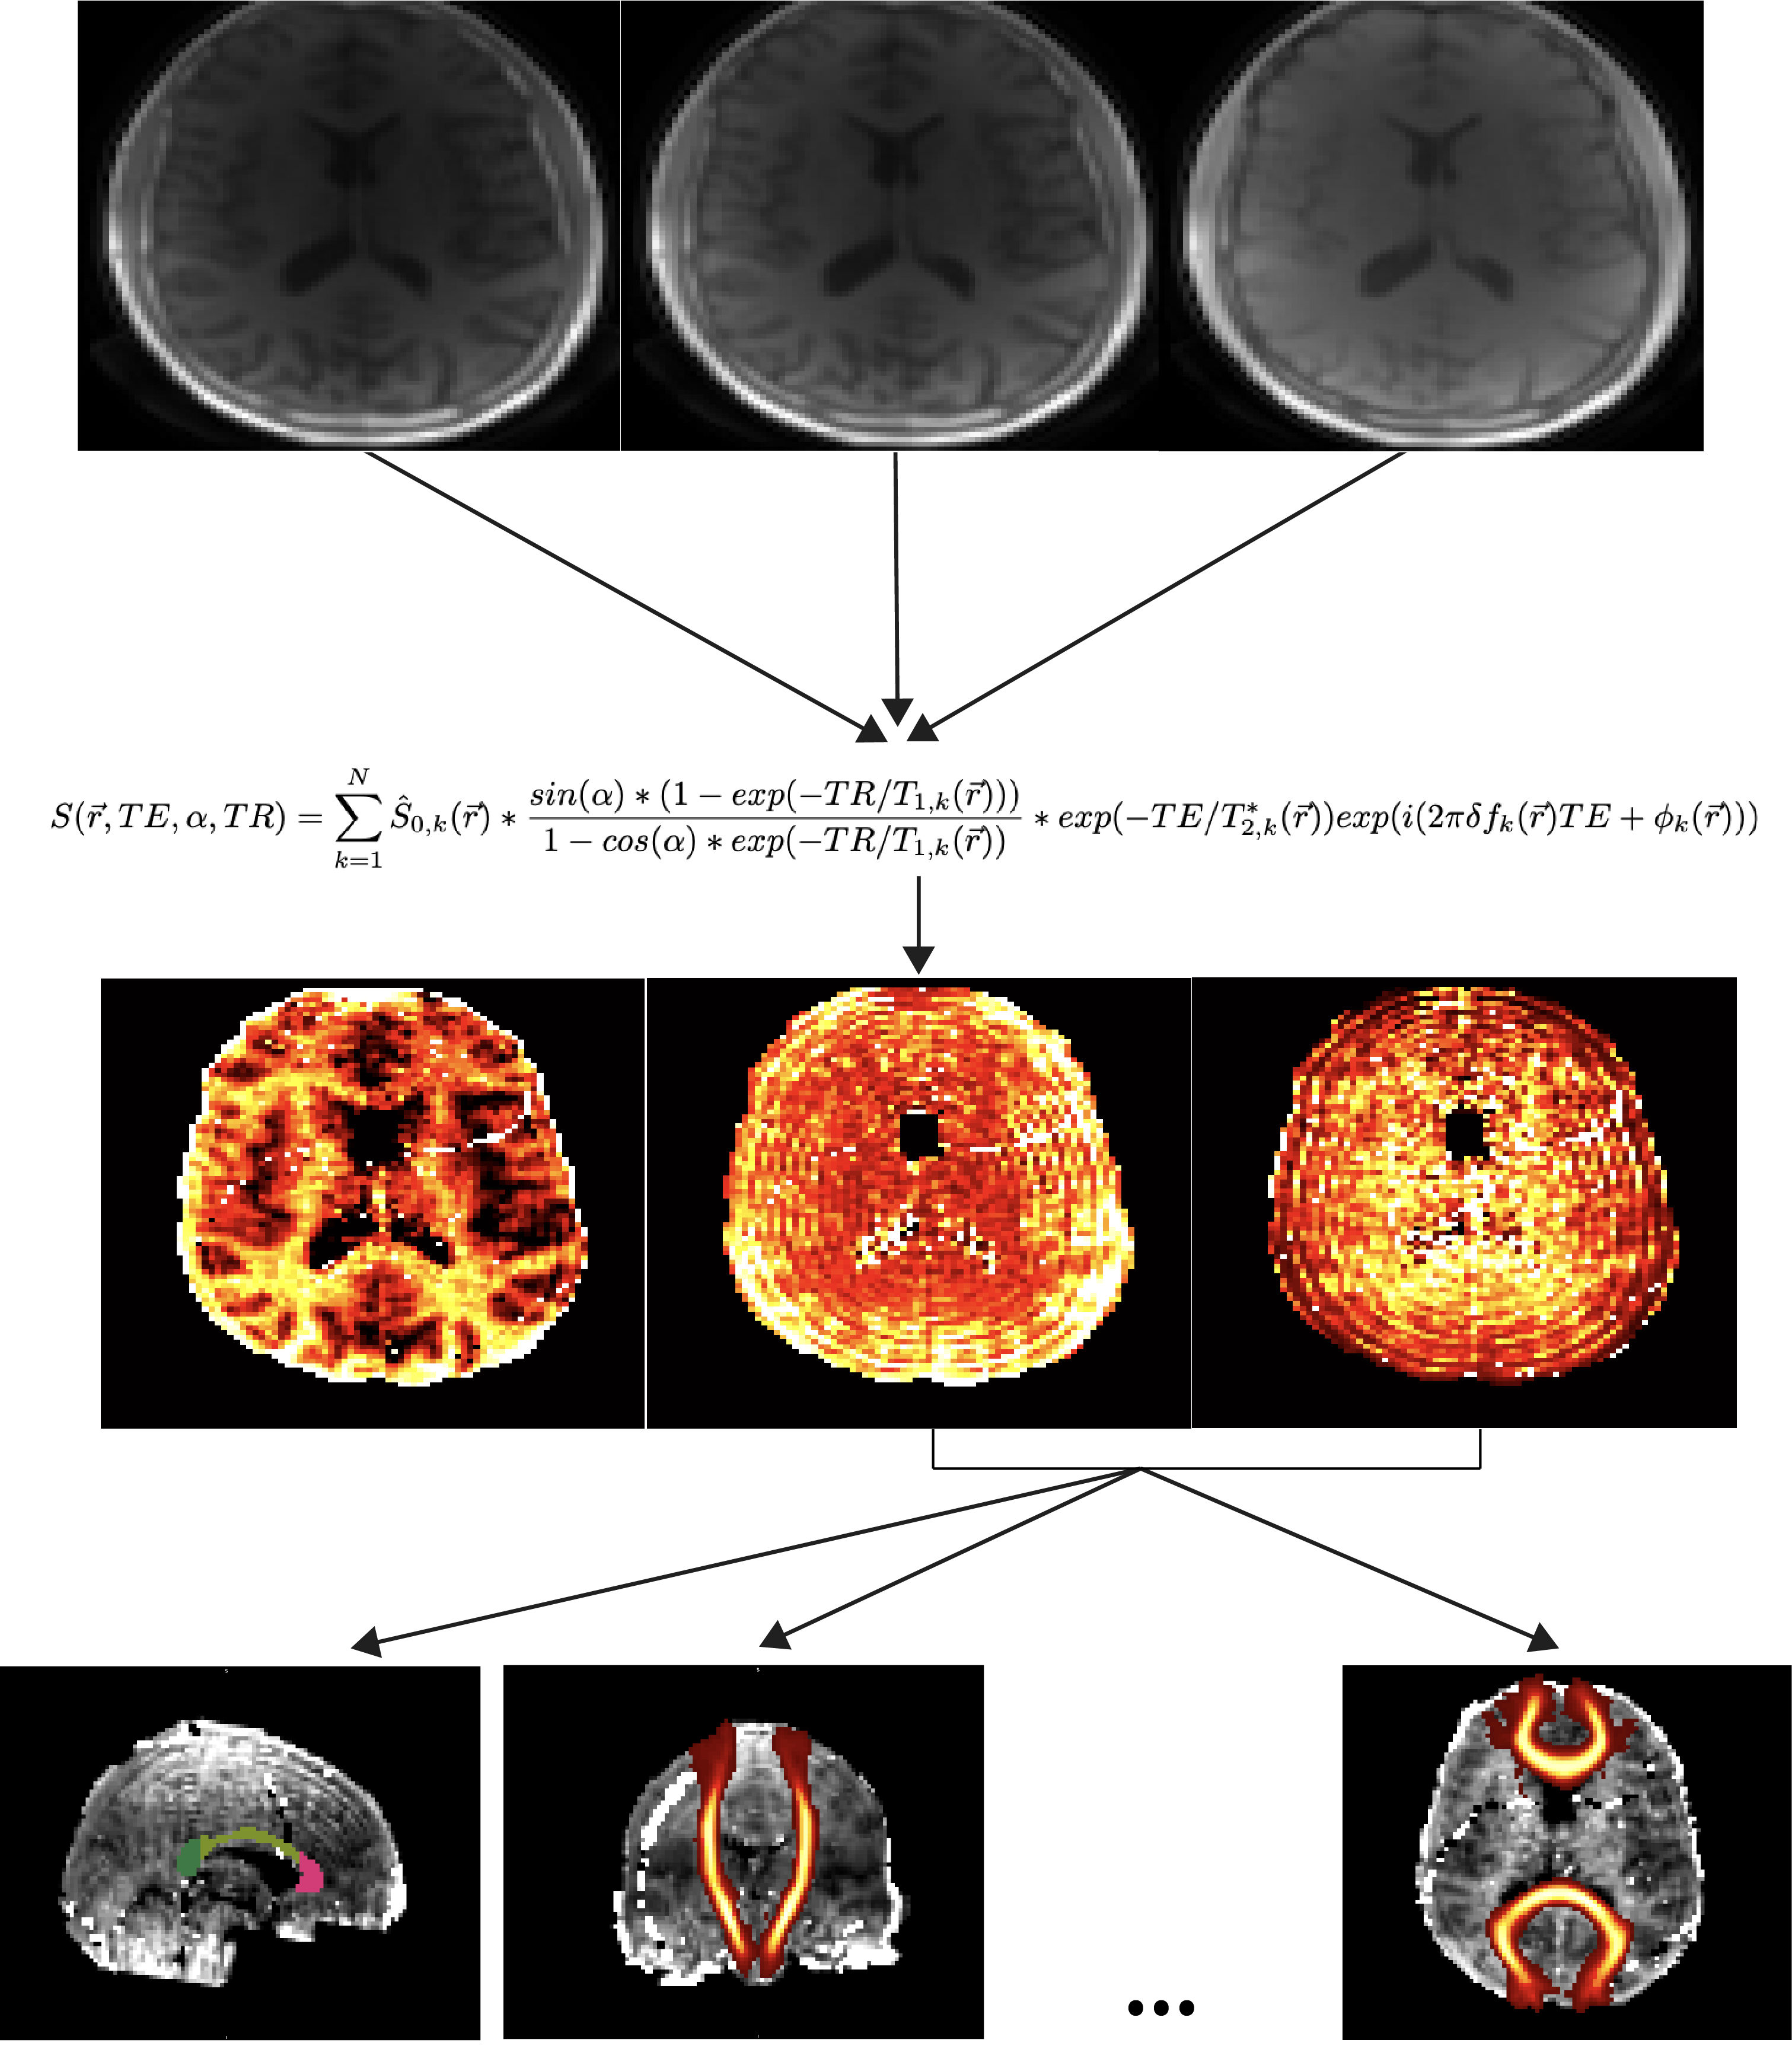
Whole brain relaxometry was performed using a 3D radial pulse sequence supporting UTEs with a nonselective, hard pulse excitation. The delay between excitation and readout was shifted between TRs to acquire a set of 8 different sets TEs within a single scan ranging from 24 µs to 5 ms. Three of these UTE scans were performed at 6, 12, and 18 degree flip angles. T1, T2*, and relative proton density values were derive by fitting the following signal model:S(\vec{r}, TE, \alpha, TR) =\sum_{k=1}^{N} \hat{S}_{0, k}(\vec{r})* \frac{sin(\alpha)*(1 - exp(-TR/T_{1, k}(\vec{r})))}{1-cos(\alpha) * exp(-TR/T_{1, k}(\vec{r}))} * exp(-TE/T^{*}_{2, k}(\vec{r}))exp(i(2\pi \delta f_{k}(\vec{r})TE + \phi _{k}(\vec{r})))
with N=2 components where the first captured all long-T2* (> 1 ms) components and the second captured the ultrashort-T2* (< 1 ms) components. Our prior work has shown that, while the long-T2* components are near the water resonance frequency, the ultrashort-T2* component is near the primary fat resonance frequencies (~1.5 ppm)5. Quantitative parameter maps for each flip angle representing each of these measurements were generated in MATLAB (Mathworks). Flip angles were strategically chosen to saddle either side of the Ernst angles for gray, white matter, and the ultrashort-T2* component for more accurate T1 quantification. Other key parameters were 2 mm isotropic resolution, 4.1-5.8 fold parallel imaging acceleration reconstructed with non-Cartesian ESPIRiT7 and support for anisotropic FOVs.
ROI based analysis was performed using the fslroi function in FSL and a custom MATLAB script. The Wilcoxon rank sum test was performed in MATLAB to test for significant ultrashort-T2* differences between white matter tracts between healthy subjects and patients.
Results and Discussion
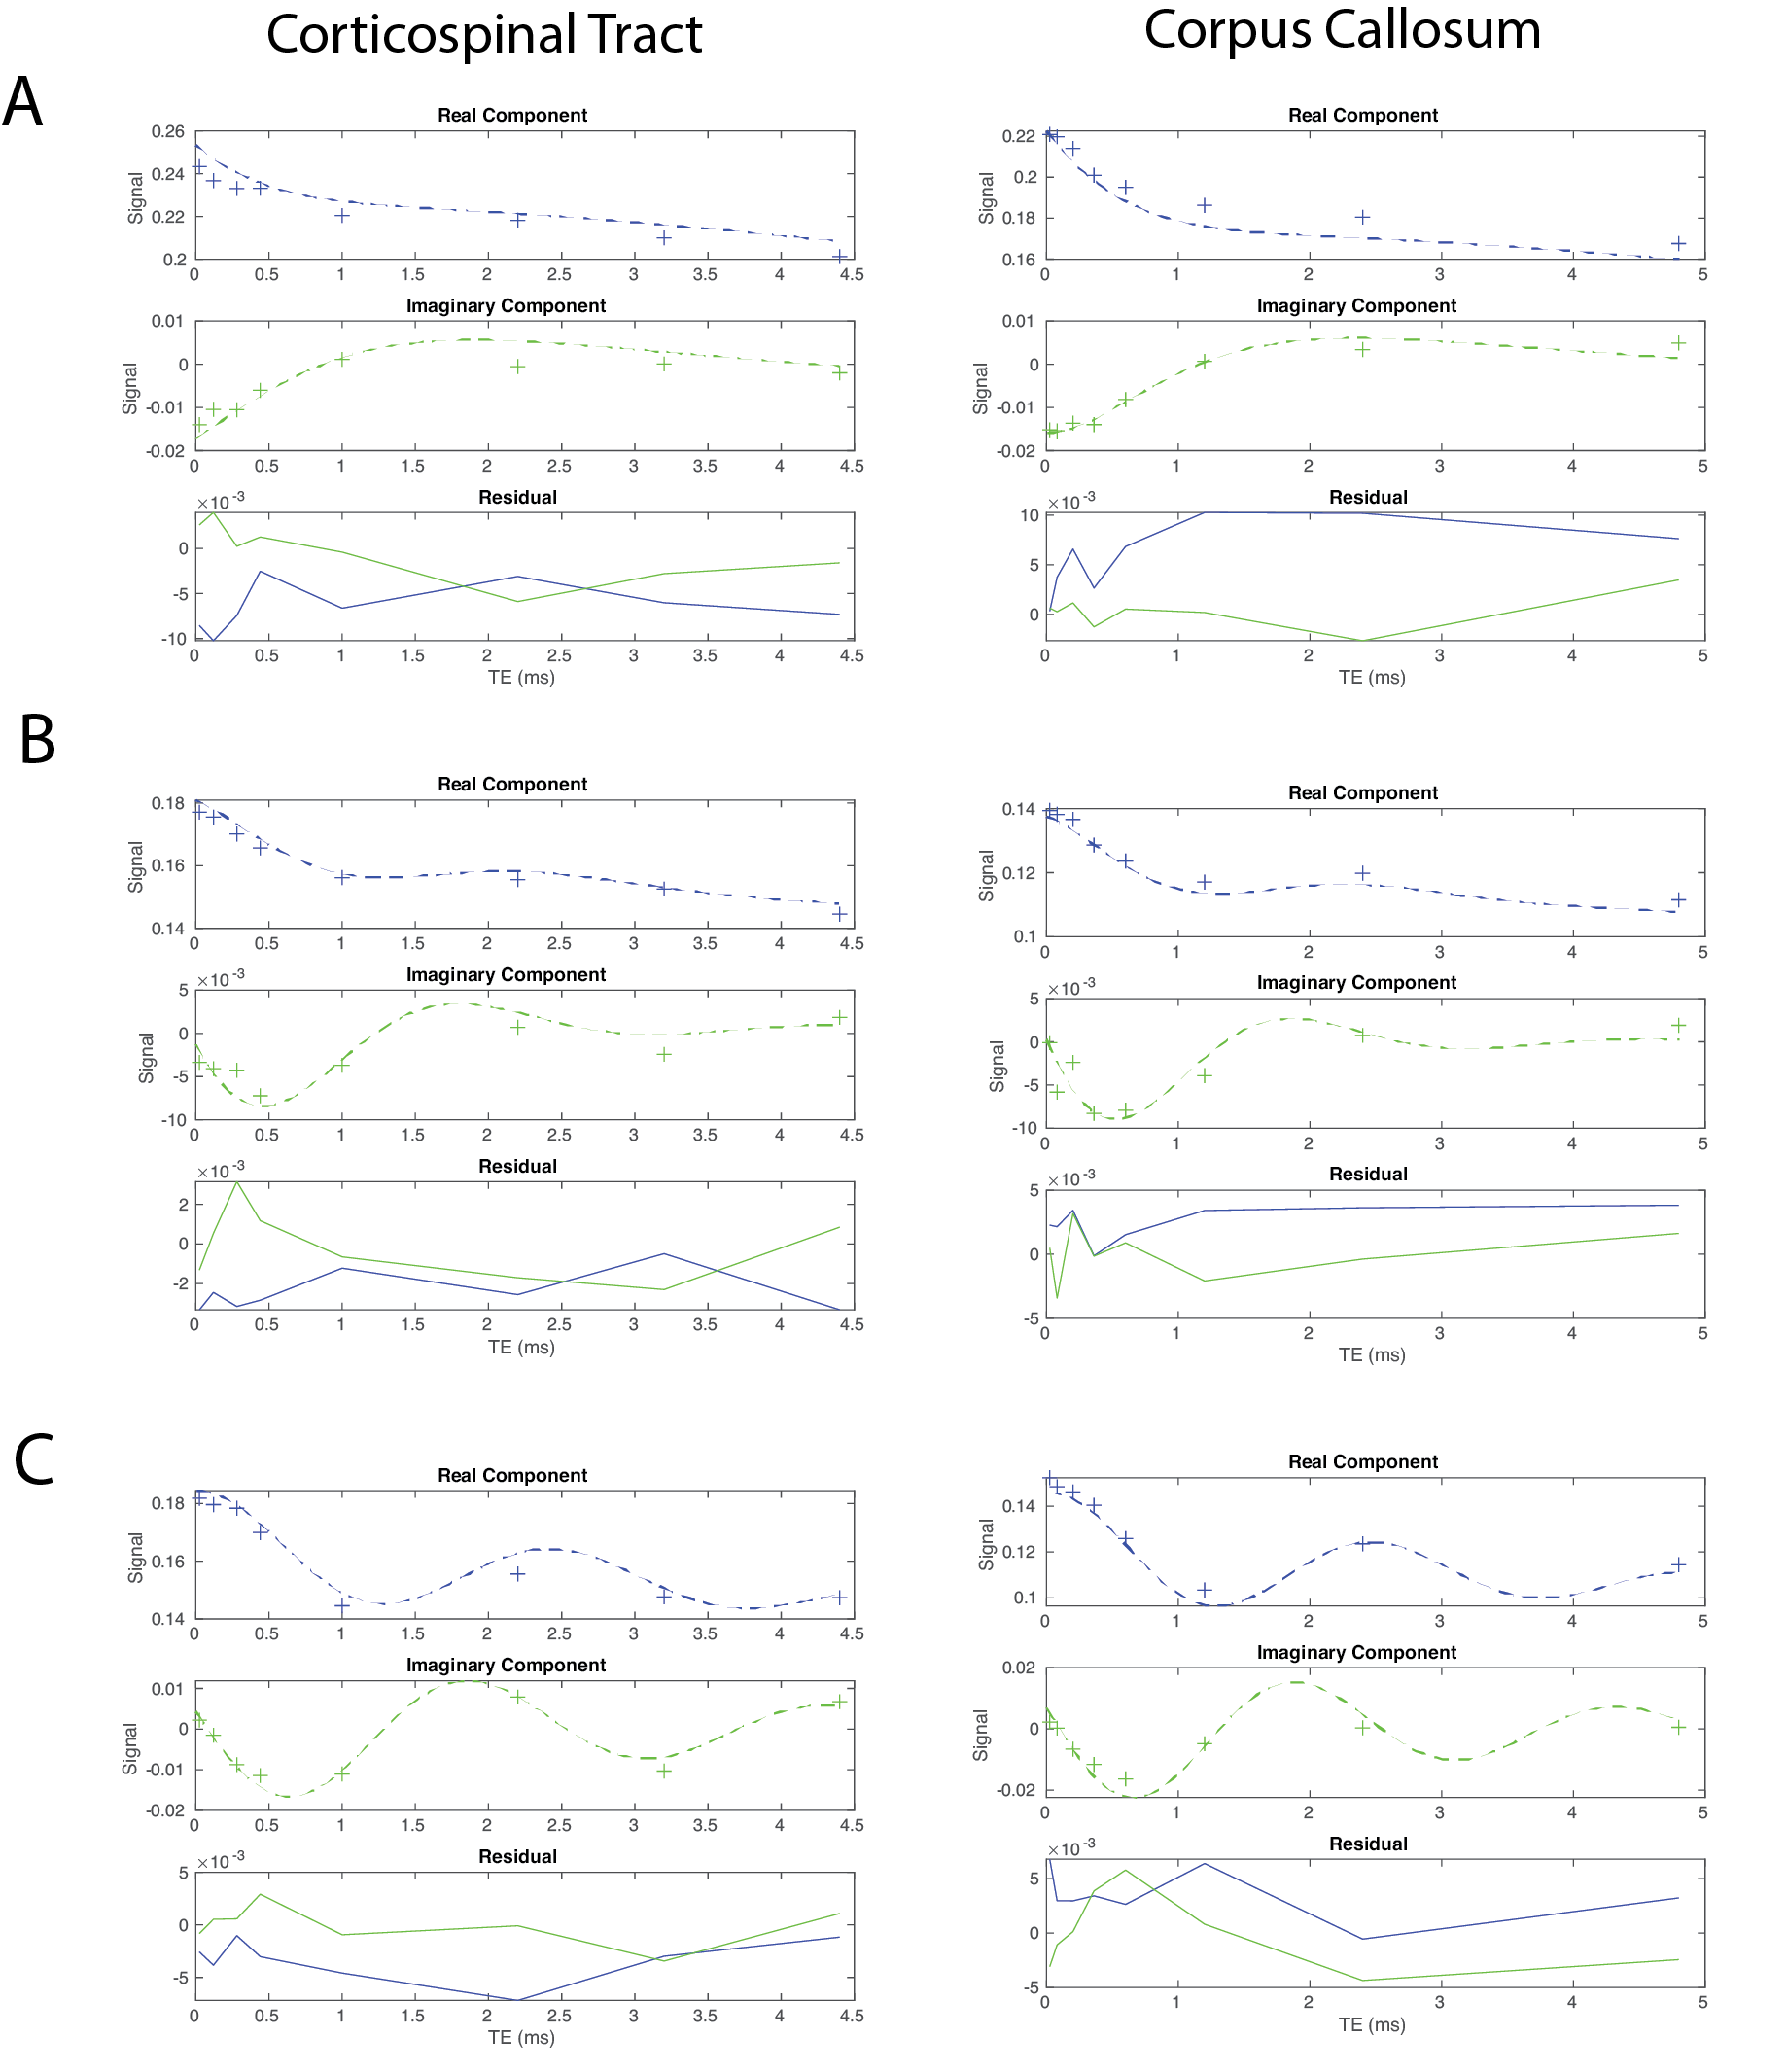
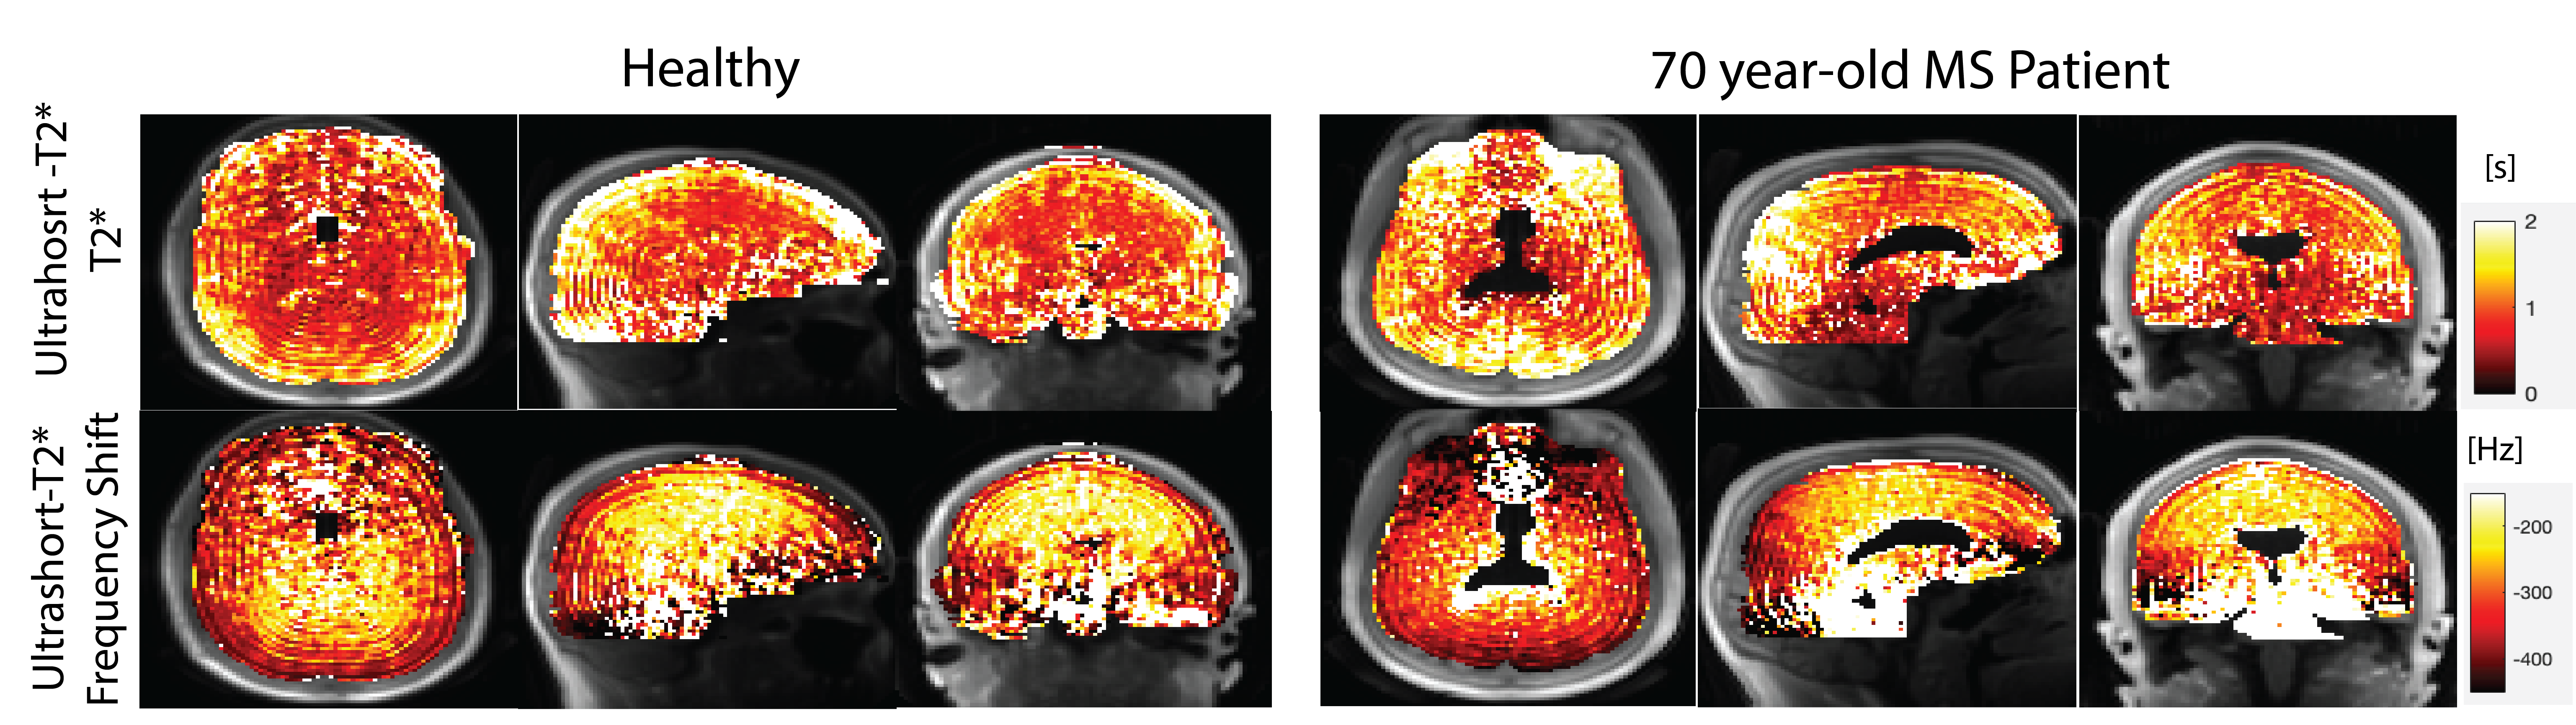
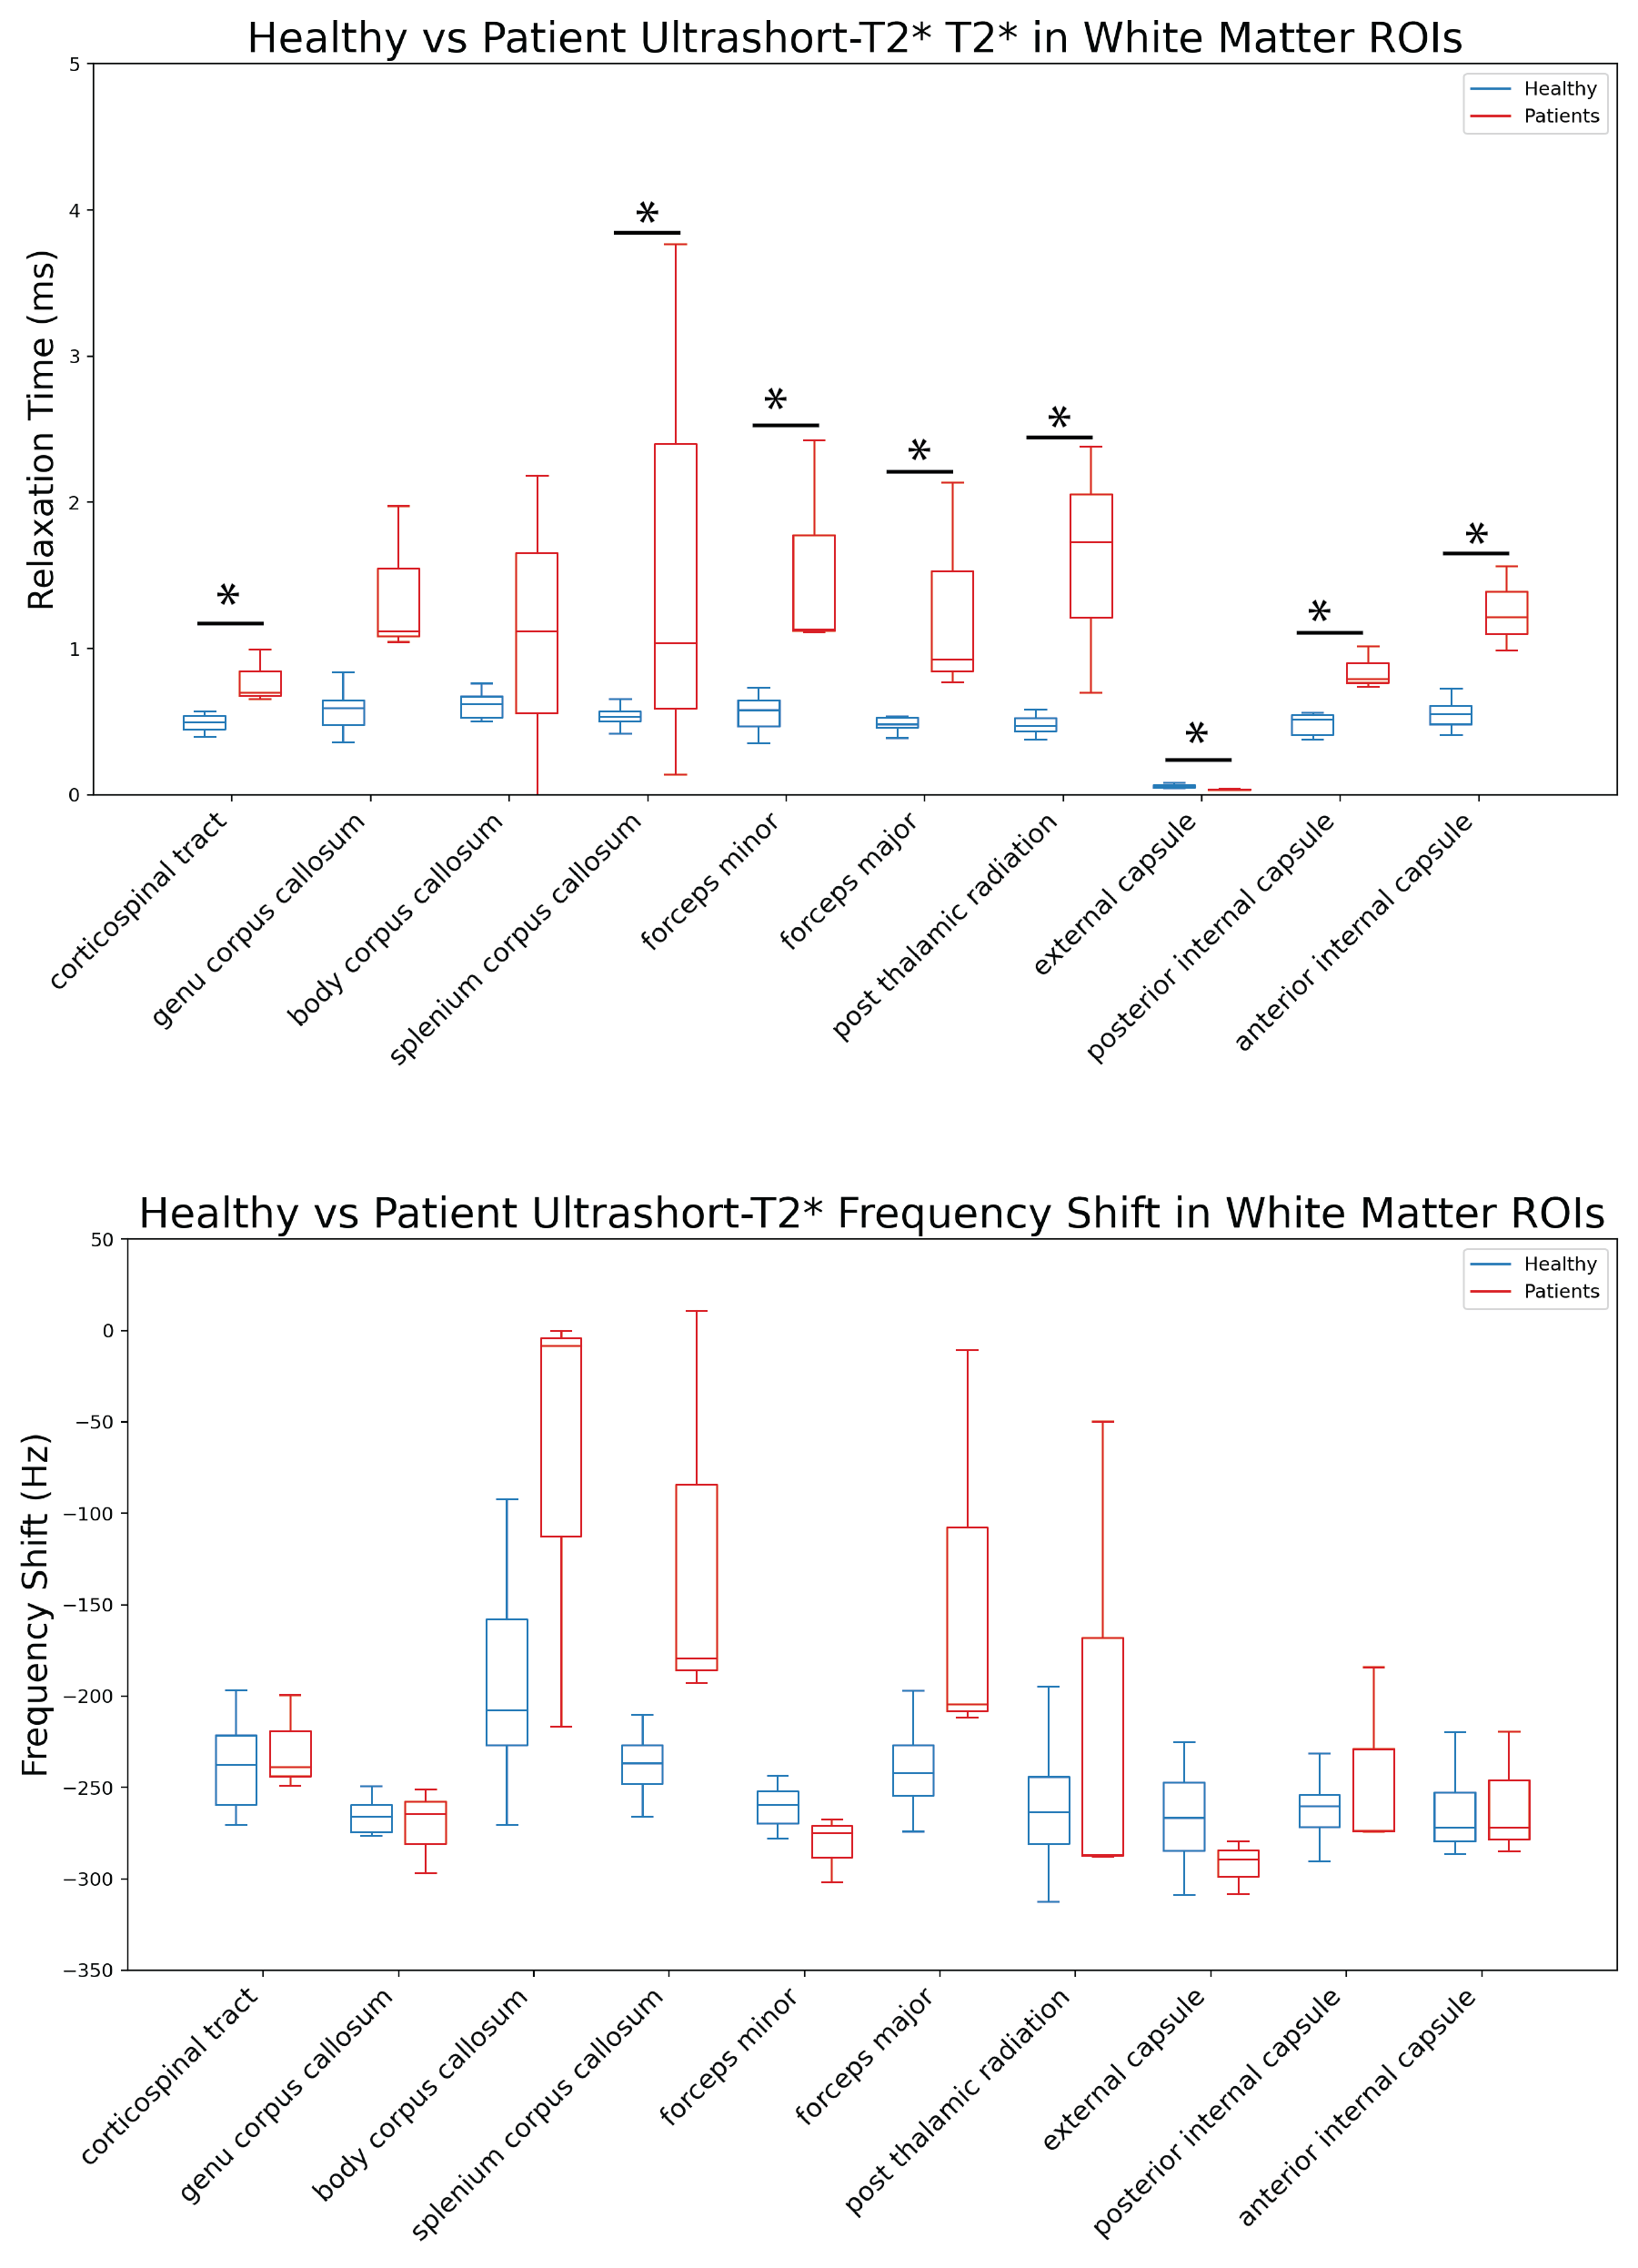
Figure 2 showcases fitted signal curves for voxels in the corticospinal tract and corpus callosum for 3 MS patients. The quality of the non-linear least squares fit algorithm varies between patient cases suggesting that the model is variable when there is possible diffuse demyelination in the brain. Also, the patient in Fig 2c shows an off-resonance component with a much longer relaxation time, which could be due to changes in myelination or contamination from other lipid signals. However, across these studies there is clear evidence of the presence of the ultrashort-T2* component as previously observed in healthy volunteers. Any differences in measured ultrashort-T2* fraction could be reflective of natural aging, demyelination, or both. Figure 3 shows example maps of the ultrashort-T2* component T2* values and frequency shifts for a 70-year old MS patient compared to a healthy volunteer. The MS patient showed consistently longer T2* values as well as changes in the frequency shift across the brain.Figure 4 shows the measured T2* in the ultrashort-T2* component of patient scans was significantly increased in all white matter ROIs except the genu corpus callosum and the body corpus callosum with relative peaks around 2.5 ms vs 0.5-0.8ms for healthy volunteers. Additionally, the patient scans showed higher variability compared to the healthy volunteers which showed smaller standard deviation in measured T2* value across ROIs. While a smaller sample size of patients could result in the observed higher variability, the larger T2* could be explained by a breakdown in structural integrity of myelin membranes as presented in patients with MS. As the structure of myelin is degraded throughout the progression of the disease, the thermodynamic environment of methylene protons changes and results in a less restricted environment for local spin coupling which could lead to a larger measured T2* relaxation time. Higher values for frequency shift were also observed in various white matter ROIs, however none of these measurements were statistically significant.
Conclusion
This work presents a study measuring and characterizing the brain ultrashort-T2* component in patients suffering from MS. Our results show that the measured T2* relaxation time of the ultrashort-T2* component is significantly lower in almost all white matter ROIs measured. Additionally, fitted signal curves for the fractional component suggest the fractional component fits well in certain patients but not as well in others suggesting a more robust fitting model may be necessary for using this UTE relaxometry technique in patients with MS.Acknowledgements
References
1. Horch, R. A., Gore, J. C., & Does, M. D. (2011) Origins of the ultrashort-T(2) (1) H NMR signals in myelinated nerve: A direct measure of myelin content?. Magn Reson Med 66, 24-31.
2. Wilhelm, M. J., Ong, H. H., Wehrli, S. L., Li, C., Tsai, P.-H., Hackney, D. B., & Wehrli, F. W. (2012) Direct magnetic resonance detection of myelin and prospects for quantitative imaging of myelin density. Proc Natl Acad Sci U S A 109, 9605-10.
3. Du, J., Ma, G., Li, S., Carl, M., Szeverenyi, N. M., VandenBerg, S., Corey-Bloom, J., & Bydder, G. M. (2014) Ultrashort echo time (UTE) magnetic resonance imaging of the short T2 components in white matter of the brain using a clinical 3T scanner. Neuroimage 87, 32-41.
4. Du J ,Sheth V ,He Q ,Carl M ,Chen J ,Corey-Bloom J ,Bydder GM. Measurement of T1 of the ultrashort T2* components in white matter
5. Boucneau, T., Cao P, Tang, S., Han M., Xuan D., Henry RG., & Larson PEZ. (2018) In Vivo Characterization of Brain Ultrashort-T2 Components. Magn Reson Med, 80(2), 726-735.
6. Bakshi R, Thompson AJ, Rocca MA, Pelletier D, Dousset V, Barkhof F, Inglese M, Guttmann CR, Horsfield MA, Filippi M. MRI in multiple sclerosis: current status and future prospects. Lancet Neurol. 2008 Jul;7(7):615-25. doi: 10.1016/S1474-4422(08)70137-6. PMID: 18565455; PMCID: PMC2586926.
7. Uecker, M., Lai, P., Murphy, M. J., Virtue, P., Elad, M., Pauly, J. M., Vasanawala, S. S., & Lustig, M. (2013) ESPIRiT-an eigenvalue approach to autocalibrating parallel MRI: Where SENSE meets GRAPPA. Magn Reson Med , 71(3), 990-1001.
Figures