3984
Longitudinal changes in brain oxygen extraction fraction (OEF) in older adults: relationship to vascular and Alzheimer’s pathology1Department of Radiology, Johns Hopkins University School of Medicine, Baltimore, MD, United States, 2Department of Biomedical Engineering, Johns Hopkins University School of Medicine, Baltimore, MD, United States, 3Department of Neurology, Johns Hopkins University School of Medicine, Baltimore, MD, United States, 4Department of Diagnostic Radiology and Nuclear Medicine, University of Maryland School of Medicine, Baltimore, MD, United States
Synopsis
Oxygen extraction fraction (OEF) has been suggested to be differentially affected by Alzheimer’s and vascular pathology in older adults. We aimed to investigate age-related OEF change with a longitudinal study design. 138 elderly participants were recruited with a 2-year follow-up. Individuals with higher vascular risks showed significant elevation in OEF but not those with lower vascular risks. Higher OEF was also associated with a faster growth in white matter hyperintensities, but not with any Alzheimer’s pathology or APOE gene. The results suggested a prominent effect of vascular pathology on OEF in aging.
INTRODUCTION
Cerebral oxygen extraction fraction (OEF) is a physiological biomarker that reflects the balance between the brain’s energy consumption and blood supply1. Alzheimer’s disease (AD) and vascular cognitive impairment and dementia (VCID) are two of the most common types of contributors to cognitive impairment2. Previous cross-sectional studies have suggested that OEF is differentially affected by AD and VCID. Decreased OEF has been reported in AD-related impairment, which was attributed to reduced energy consumption associated with neurodegeneration in the presence of normal blood supply3. On the other hand, elevated OEF was reported in participants with higher vascular risks4, presumably because of a pronounced reduction in blood supply in these patients.However, longitudinal changes in OEF in older adults have not been investigated. Thus, in this study, we measured OEF in a cohort of 138 elderly participants with a two-year follow-up using T2-relaxation-under-spin-tagging (TRUST) MRI. We also investigated the dependence of the longitudinal OEF change on AD and vascular pathology.
METHODS
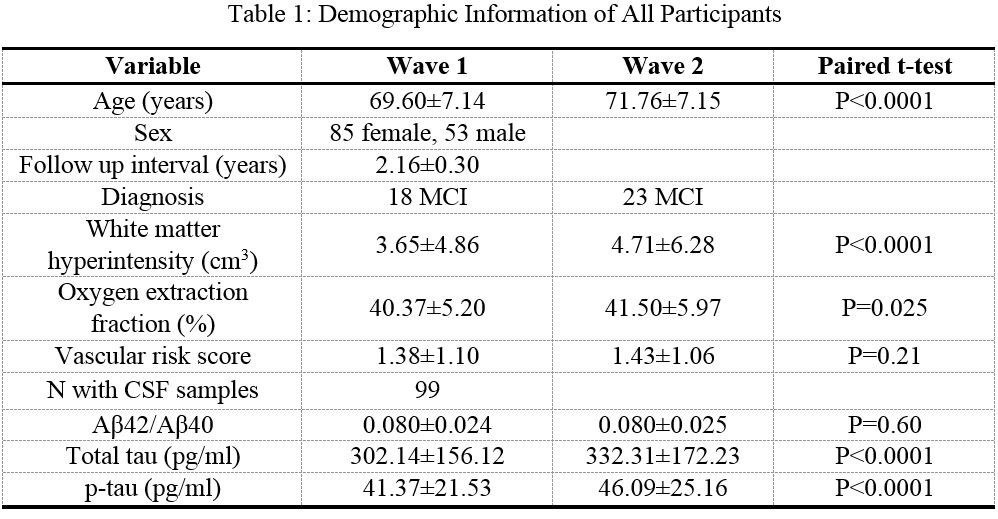
ParticipantsA total of 138 participants (69.6±7.1yrs, 85 F), including 120 cognitively normal individuals and 18 Mild-Cognitive-Impairment (MCI) patients, were recruited from the cohort of a longitudinal, HIPAA-compliant, IRB-approved study, titled Biomarkers for Older Controls at Risk for Dementia (BIOCARD)5. Data from two visits were used (wave 1 and wave 2), with a follow-up interval of 2.16±0.30 years.
MRI experiment and image processing
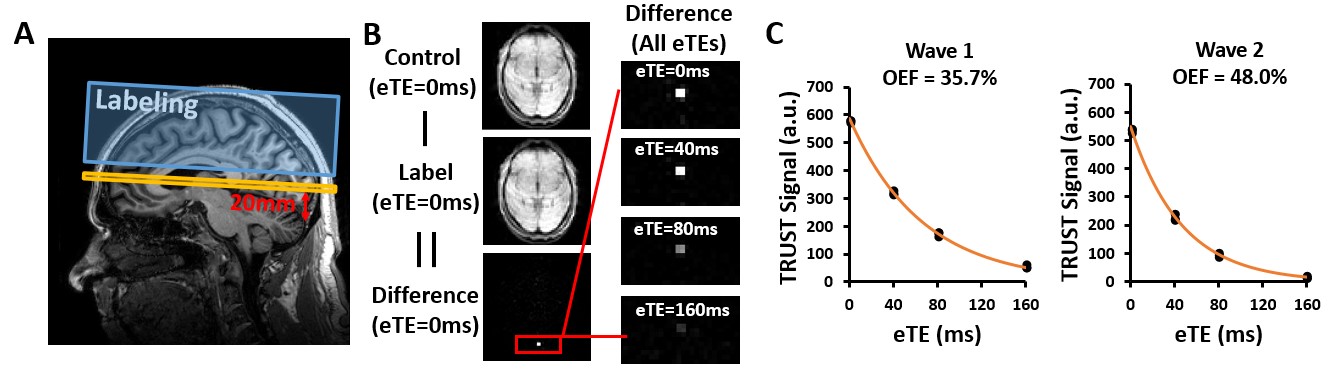
All MRI experiments were acquired on a 3T Philips system. Global venous oxygenation (Yv) was measured with TRUST MRI noninvasively at the superior sagittal sinus to calculate OEF as $$$OEF=(Y_a-Y_v)/Y_a$$$ (Figure 1)6, where Ya is arterial oxygenation (assumed to be 98%). TRUST MRI is based on the principle that T2 relaxation time of the blood has a well-known and calibratable relationship with Yv. The imaging parameters follows a recent study7 and the scan duration was 1min12s. A Fluid-Attenuated Inversion Recovery (FLAIR) MRI scan was acquired to assess white matter hyperintensity (WMH) volume quantitatively using a Bayesian based method8.
Vascular risks, CSF biomarkers and genotype
Vascular risk composite scores (VRS) were obtained for both time points by evaluating five vascular risks: hypertension, hypercholesterolemia, diabetes, current smoking and obesity9. CSF specimens were obtained through lumbar puncture from 99 participants (68.9±7.1yrs, 63F) and AD biomarkers were measured with Lumipulse fully automated assay at both time points, including total tau (t-tau), phosphorylated tau (p-tau), β-amyloid-42 (Aβ42) and β-amyloid-40 (Aβ40). APOE genotyping was also performed following standard procedures.
Statistical analysis
Longitudinal change in OEF between the two waves was assessed by paired t-test. The effect of age and sex on the change in OEF was examined using linear regression. Participants were divided into low and high VRS groups (by median split) and the OEF changes were compared between two groups. Regression analyses were also performed to investigate the relationship between OEF and longitudinal changes in WMH, AD pathology and APOE-ε4 status. In all analyses, a two-tailed p value of 0.05 or less was considered statistically significant.
RESULTS AND DISCUSSION
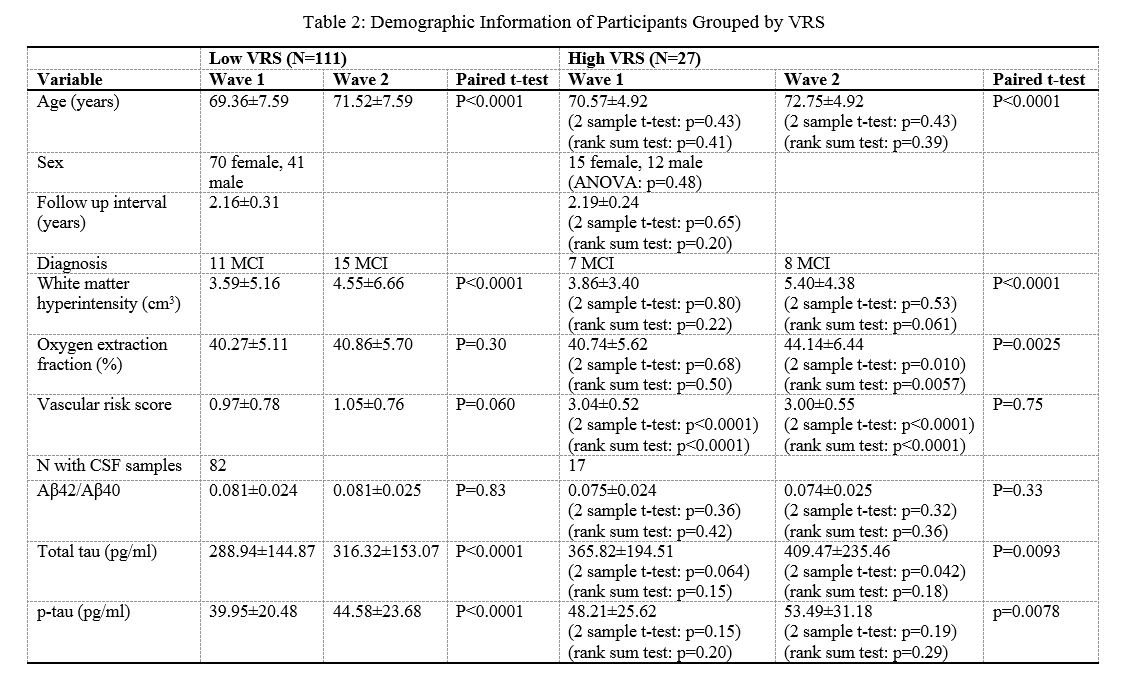
Among 120 cognitively normal participants, 5 progressed to MCI over the follow-up period, resulting in a total of 23 MCI at wave 2. Cross-sectional analysis revealed a modest positive association between age and OEF that was significant at wave 1 (β=0.14±0.061% per year, p=0.023), but not wave 2 (β=0.096±0.071% per year, p=0.18). Longitudinally, wave 2 OEF was significantly higher than that of wave 1 (∆OEF =1.14±0.50%, p=0.025, Table 1). The change in OEF was not significantly associated with baseline age (β=-0.049±0.072% per year; p=0.50) or sex (β=0.21±1.05%; p=0.84).Out of the entire cohort, 111 participants had a low VRS (values of 0, 1, or 2) and 27 had a high VRS (values of 3, 4, or 5) (Table 2). The high VRS group demonstrated a significant increase in OEF from wave 1 to wave 2 (∆OEF=3.40±1.02%, p=0.0025). In contrast, the low VRS group revealed a much slower OEF change (∆OEF=0.59±0.56%, p=0.30). ∆OEF in the high VRS group was significantly higher than that in the low VRS group (p=0.025).
In addition, we found a positive association between longitudinal changes in logWMH and wave 2 OEF (β=0.0087±0.0032; p=0.0075) with age as a covariate, suggesting that there is an association between OEF (a functional marker) and white matter structural integrity. No significant association was found between changes in logWMH and wave 1 OEF or change of OEF.
There were no significant associations between OEF and the change of p-tau or t-tau or Aβ42/Aβ40 from wave 1 to wave 2. We did not observe an association between APOE4 and change of OEF either.
Similar analyses were performed among the cognitively normal participants only and yielded similar results.
CONCLUSION
In conclusion, this study showed that OEF increases longitudinally in older adults and this increase is primarily related to vascular risks and white matter integrity, instead of AD pathology.Acknowledgements
No acknowledgement found.References
1. Buxton RB, Uludag K, Dubowitz DJ, Liu TT. Modeling the hemodynamic response to brain activation. Neuroimage 2004;23 Suppl 1:S220-233.
2. Stevens T, Livingston G, Kitchen G, Manela M, Walker Z, Katona C. Islington study of dementia subtypes in the community. Br J Psychiatry 2002;180:270-276.
3. Thomas BP, Sheng M, Tseng BY, Tarumi T, Martin-Cook K, Womack KB, Cullum MC, Levine BD, Zhang R, Lu H. Reduced global brain metabolism but maintained vascular function in amnestic mild cognitive impairment. J Cereb Blood Flow Metab 2017;37:1508-1516.
4. Jiang D, Lin Z, Liu P et al. Brain Oxygen Extraction Is Differentially Altered by Alzheimer's and Vascular Diseases. Journal of Magnetic Resonance Imaging 2020;52:1829-1837.
5. Marilyn A, Anja S, Rebecca G et al. Cognitive Changes Preceding Clinical Symptom Onset of Mild Cognitive Impairment and Relationship to ApoE Genotype. Current Alzheimer Research 2014;11:773-784.
6. Lu H, Ge Y. Quantitative evaluation of oxygenation in venous vessels using T2-Relaxation-Under-Spin-Tagging MRI. Magnetic Resonance in Medicine 2008;60:357-363.
7. Lin Z, Sur S, Soldan A et al. Brain Oxygen Extraction by Using MRI in Older Individuals: Relationship to Apolipoprotein E Genotype and Amyloid Burden. Radiology 2019;292:140-148.
8. DeCarli C, Fletcher E, Ramey V, Harvey D, Jagust WJ. Anatomical Mapping of White Matter Hyperintensities (WMH). Stroke 2005;36:50-55.
9. Gottesman RF, Schneider ALC, Zhou Y et al. Association Between Midlife Vascular Risk Factors and Estimated Brain Amyloid Deposition. JAMA 2017;317:1443-1450.
Figures