3983
Higher functional activity in the somatomotor network is associated with functional reorganization in the early stage of multiple sclerosis1Department of Radiology, Weill Cornell Medicine, New York, NY, United States, 2Horace Greeley High School, Chappaqua, NY, United States, 3Department of Neurology, Weill Cornell Medicine, New York, NY, United States
Synopsis
Multiple Sclerosis (MS) is a disease that causes neuroinflammation and neurodegeneration in central nervous system. Neuroimaging techniques may enable us to better understand the neuropathological mechanisms of MS and how the brain may compensate the pathological changes. We identified the recurring dynamic brain states using fMRI data and investigated the energy required for the transition between those states using the network control theory approach. Our main findings are the dynamic states were visual, somatomotor, and frontoparietal states and the transition energy averaged over all transitions was significantly greater in the MS patients with disability compared to those without disability.
Background
In multiple sclerosis (MS), the structural damage due to neural loss, demyelination, and inflammation is not always proportional to disability, which makes prognostication very challenging1. Advanced neuroimaging techniques may enable us to better understand the neuropathological mechanisms of disability in MS and how the brain function may compensate for the structural damage. Brain dynamics can be used to investigate the time-varying alterations in the brain activity. Brain dynamics method was previously applied in MS2,3,4, however the structural basis of the brain activity measured when transitioning between those dynamic states remains unclear in MS.Aims
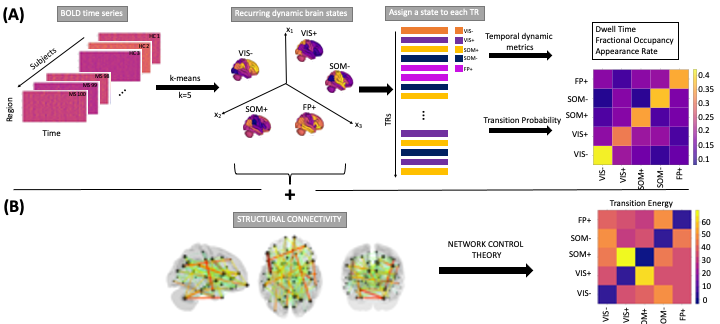
First, we aimed to identify the dynamic brain states using the blood-oxygenation level-dependent (BOLD) time series in healthy controls (HC) and in people with MS (pwMS). Second, the minimum energy required for the transition between those states was computed using structural connectivity applied with the network control theory (NCT) approach. Third, temporal dynamics, transition probability, and energy were compared between HC vs pwMS as well as between pwMS who had no disability vs evidence of disability.Material and Methods
One hundred pwMS and 19 HC were included in our study. Expanded Disability Status Scale (EDSS) was used to assess disability, where 67 pwMS who had EDSS<2 were considered as not having disability. Dynamic brain states were computed using k-means clustering applied on the regional brain activity measured with BOLD signals from fMRI (See Figure 1). The transition probability between states and temporal dynamics such as dwell time, fractional occupancy, and appearance rate were computed for each subject. The NCT approach was used to compute the minimum energy required for the transition between states. Wilcoxon rank sum test was performed to compare temporal dynamics, transition probability and energy between HC and pwMS as well as pwMS who had no disability vs evidence of disability.Results
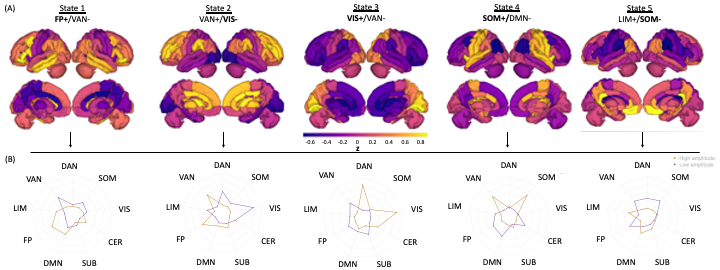
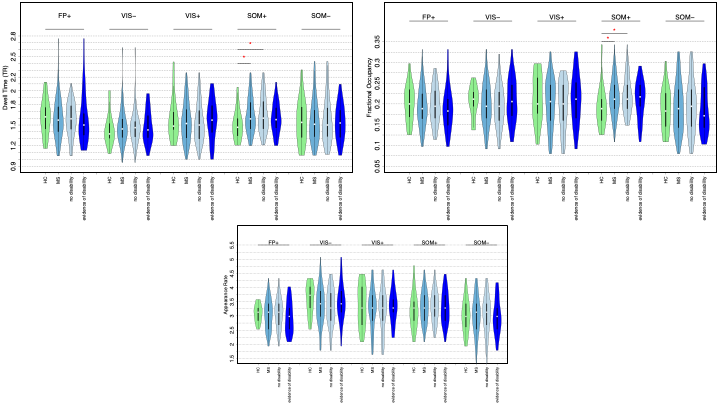
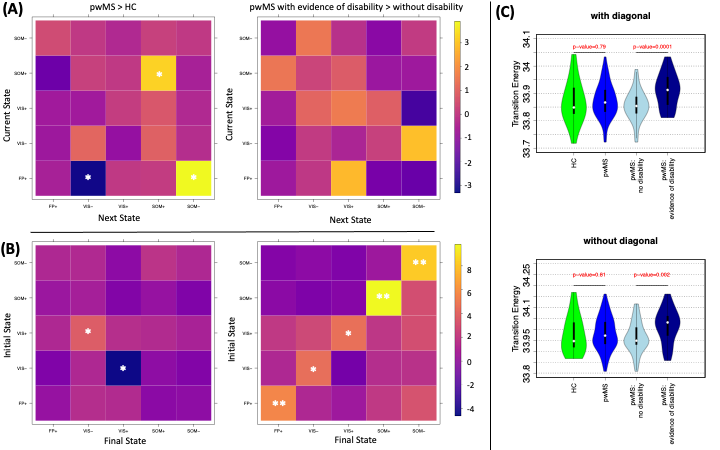
The most recurrent dynamic brain states were visual and somatomotor with high and low amplitude of activity as well as frontoparietal with high amplitude of activity (See Figure 2). The pwMS who had no disability had significantly greater dwell time and fractional occupancy in the somatomotor with high amplitude activity compared to HC (p-value<0.05), while there was no significant difference between HC and pwMS who had evidence of disability (See Figure 3). The persistence energy in all dynamic states were significantly greater in pwMS who had evidence of disability compared to those without disability (p-value0.05) (See Figure 4). The transition energy averaged over all transition possible was significantly greater in the pwMS who had evidence of disability compared to those without disability (p-value<0.05) (See Figure 4).Discussion
PwMS in the early stage of the disease showed functional compensation and resilience in motor-related regions to limit the disability, while the functional activity in those regions decreases in the later stage of the disease. The pwMS with evidence of disability needed greater energy for the transition between dynamic brain states compared to those without disability, which might be related to less structural damage in pwMS without disability.Acknowledgements
This work was supported by postdoctoral fellowship FG-2008-36976 (C.T.) from the National Multiple Sclerosis Societythe NIH R21 NS104634-01 (A.K.), NIH R01 NS102646-01A1 (A.K.), and grant UL1 TR000456-06 (S.G.) from the Weill Cornell Clinical and Translational Science Center (CTSC).References
1. F. Barkhof, “The clinico-radiological paradox in multiple sclerosis revisited.,Current opinion in neurology, vol. 15, pp. 239–45, 6 2002.
2. A. Rocca, M. Hidalgo de La Cruz, P. Valsasina, S. Mesaros, V. Martinovic, J. Ivanovic, J. Drulovic, and M. Filippi, “Two-year dynamic functional network connectivity in clinically isolated syndrome.” Multiple Sclerosis Journal, 2019
3. A.d’Ambrosio, P. Valsasina, A. Gallo, N. De Stefano, D. Pareto, F. Barkhof, O. Ciccarelli, C. Enzinger, G. Tedeschi, M. L. Stromillo, M. J. Ar ́evalo, H. E. Hulst, N. Muhlert, M. Koini, M. Filippi, and M. A. Rocca, “Reduced dynamics of functional connectivity and cognitive impairment in multiple sclerosis.” Multiple Sclerosis Journal, p. 135245851983770, 3 2019
4.Q. van Geest, H. E. Hulst, K. A. Meijer, L. Hoyng, J. J. Geurts, and L. Douw, “The importance of hippocampal dynamic connectivity in explaining memory function in multiple sclerosis.” Brain and Behavior, vol. 8, 5 2018
Figures