3982
Brain Oxygen Extraction Fraction in Patients with Normal Pressure Hydrocephalus1Biomedical Engineering, Cornell University, New York, NY, United States, 2Department of Radiology, Weill Medical College of Cornell University, New York, NY, United States
Synopsis
Oxygen extraction fraction (OEF) maps were obtained from multi-echo gradient echo (mGRE) using a novel MRI biophysics model called QSM+qBOLD (QQ) in Normal Pressure Hydrocephalus (NPH) patients. OEF of the whole brain, cortical gray matter, caudate, and pallidum were significantly negatively correlated with ventricular volume. The finding demonstrates the feasibility of OEF mapping using MRI in NPH patients and suggests global and local neurodegeneration.
Introduction
Normal pressure hydrocephalus (NPH) is a syndrome characterized by a triad of symptoms consist of gait disturbance, urinary incontinence, and dementia1. NPH patients often have abnormally increased brain ventricular sizes and encroachment of enlarged ventricles on adjacent brain tissue2. Though the investigation of metabolic abnormality is highly required to understand the cause, progress, and to develop possible cure for NPH, only a few PET-based studies3-5 and few MRI-based metabolism study have been performed. Recently, a novel integrative biophysics model has been developed by combining quantitative susceptibility mapping and quantitative blood oxygen level dependent magnitude modeling of magnitude data (QSM+qBOLD or QQ) that allows the mapping of tissue oxygen extraction fraction (OEF)6-9. QQ has been validated against 15O-PET10 and calibrated fMRI11, and its clinical feasibility has been shown in ischemic stroke12, 13, multiple sclerosis14, and brain cancer15. In this study, we explore QQ-based OEF map in NPH, and investigate the association of regional OEF with ventricular volume which was reported to be correlated with gait and cognitive impairment16.Methods
Study Cohort: A total of 16 patients with NPH (6 males, 10 females; mean age 77±9 years) were retrospectively selected. MRI Protocol: All Brain MRIs were acquired on a SIEMENS 3.0T scanner (Trio Tim System; Siemens Healthcare, Erlangen, Germany). The imaging protocol was composed of 3D mGRE , structural 3D-T1WI (MP RAGE), and phase-contrast MRI. The acquisition parameters for 3D mGRE were field of view (FOV) = 24 cm × 19.5 cm, repetition time (TR) = 45 ms, TE1/ΔTE = 5.16/5 ms, number of TEs = 8, acquisition matrix = 384×312, readout bandwidth = 395 Hz/pixel, slice thickness = 2.3 mm, flip angle = 15º, and number of averages = 1. 3D-T1WI was acquired using MP RAGE sequence with TR/TE/TI = 1900/2.51/900 ms, flip angle = 9º, acquisition matrix = 256 × 256, FOV = 256 × 256 mm2, number of averages = 1, slice thickness = 1mm, and number of slices = 176. Phase-contrast MRI parameters are field of view = 120 × 84 mm2, acquisition matrix = 320 × 224, TR = 18.65ms, TE= 5.4ms, slice thickness = 4mm, flip angle = 15º. Image Processing and Analysis: Quantitative susceptibility mapping (QSM) was reconstructed from 3D mGRE data using morphology enabled dipole inversion with zero reference in cerebrospinal fluid (MEDI+0)17-19. OEF maps were calculated based on reconstructed QSM and 3D mGRE magnitude data using the QQ algorithm6. For robust OEF reconstruction against noise, a machine learning algorithm based on temporal and spatial sparsity in MRI mGRE signal was used6-8. All images were coregistered to QSM resolution using FSL FLIRT algorithm20. Freesurfer21 analysis on T1WI was used to obtain CSF ventricle and regions of interest (ROIs) including cortical gray matter (CGM) and select deep gray matters (Caudate and Pallidum), which have been shown to be associated with NPH symptoms: dementia (CGM)22 and gait disturbance, urinary incontinence (Caudate and Pallidum)23, 24. Brain ventricular volumes were then normalized against whole brain volume. Quantification of CSF flow was generated automatically by applying “CV flow” software on phase contrast images of the cerebral aqueduct (GE, Milwaukee, USA). Statistical Analysis: Linear regression analyses with age, gender, systolic stroke volume and ventricular volume as independent variables were conducted with OEF as dependent variables. A p-value of less than 0.05 was considered to indicate statistical significance.Results
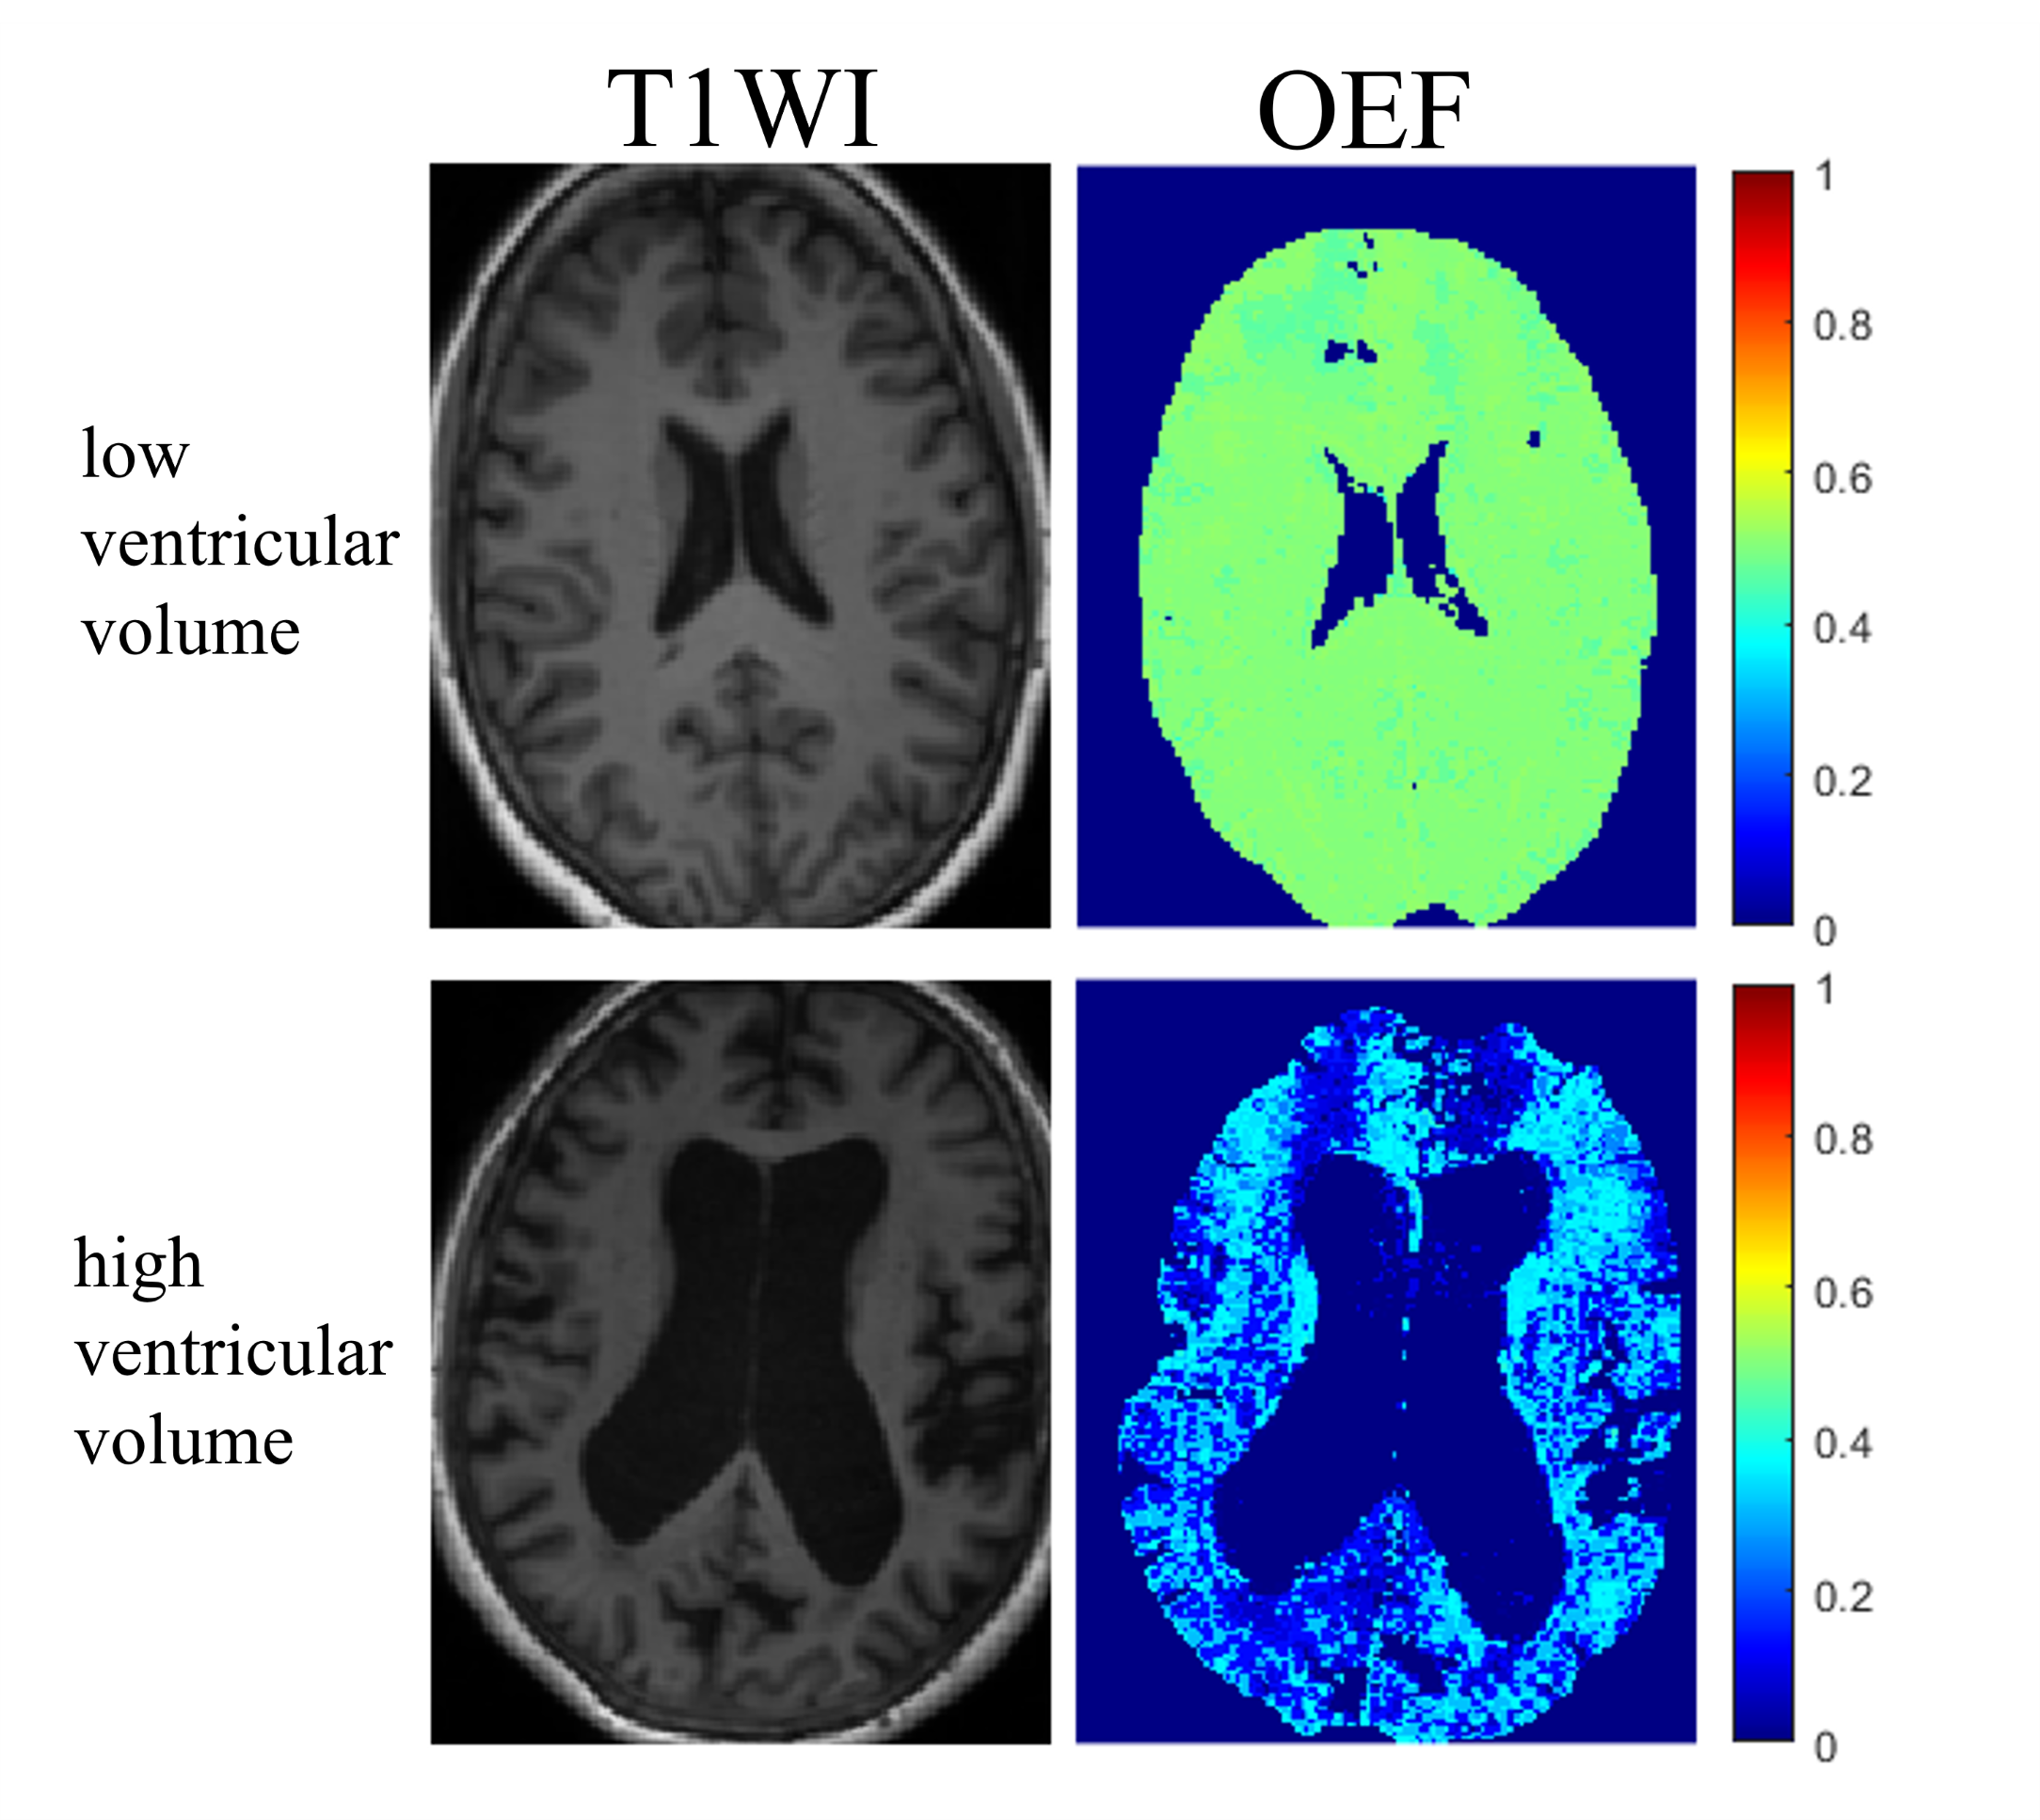
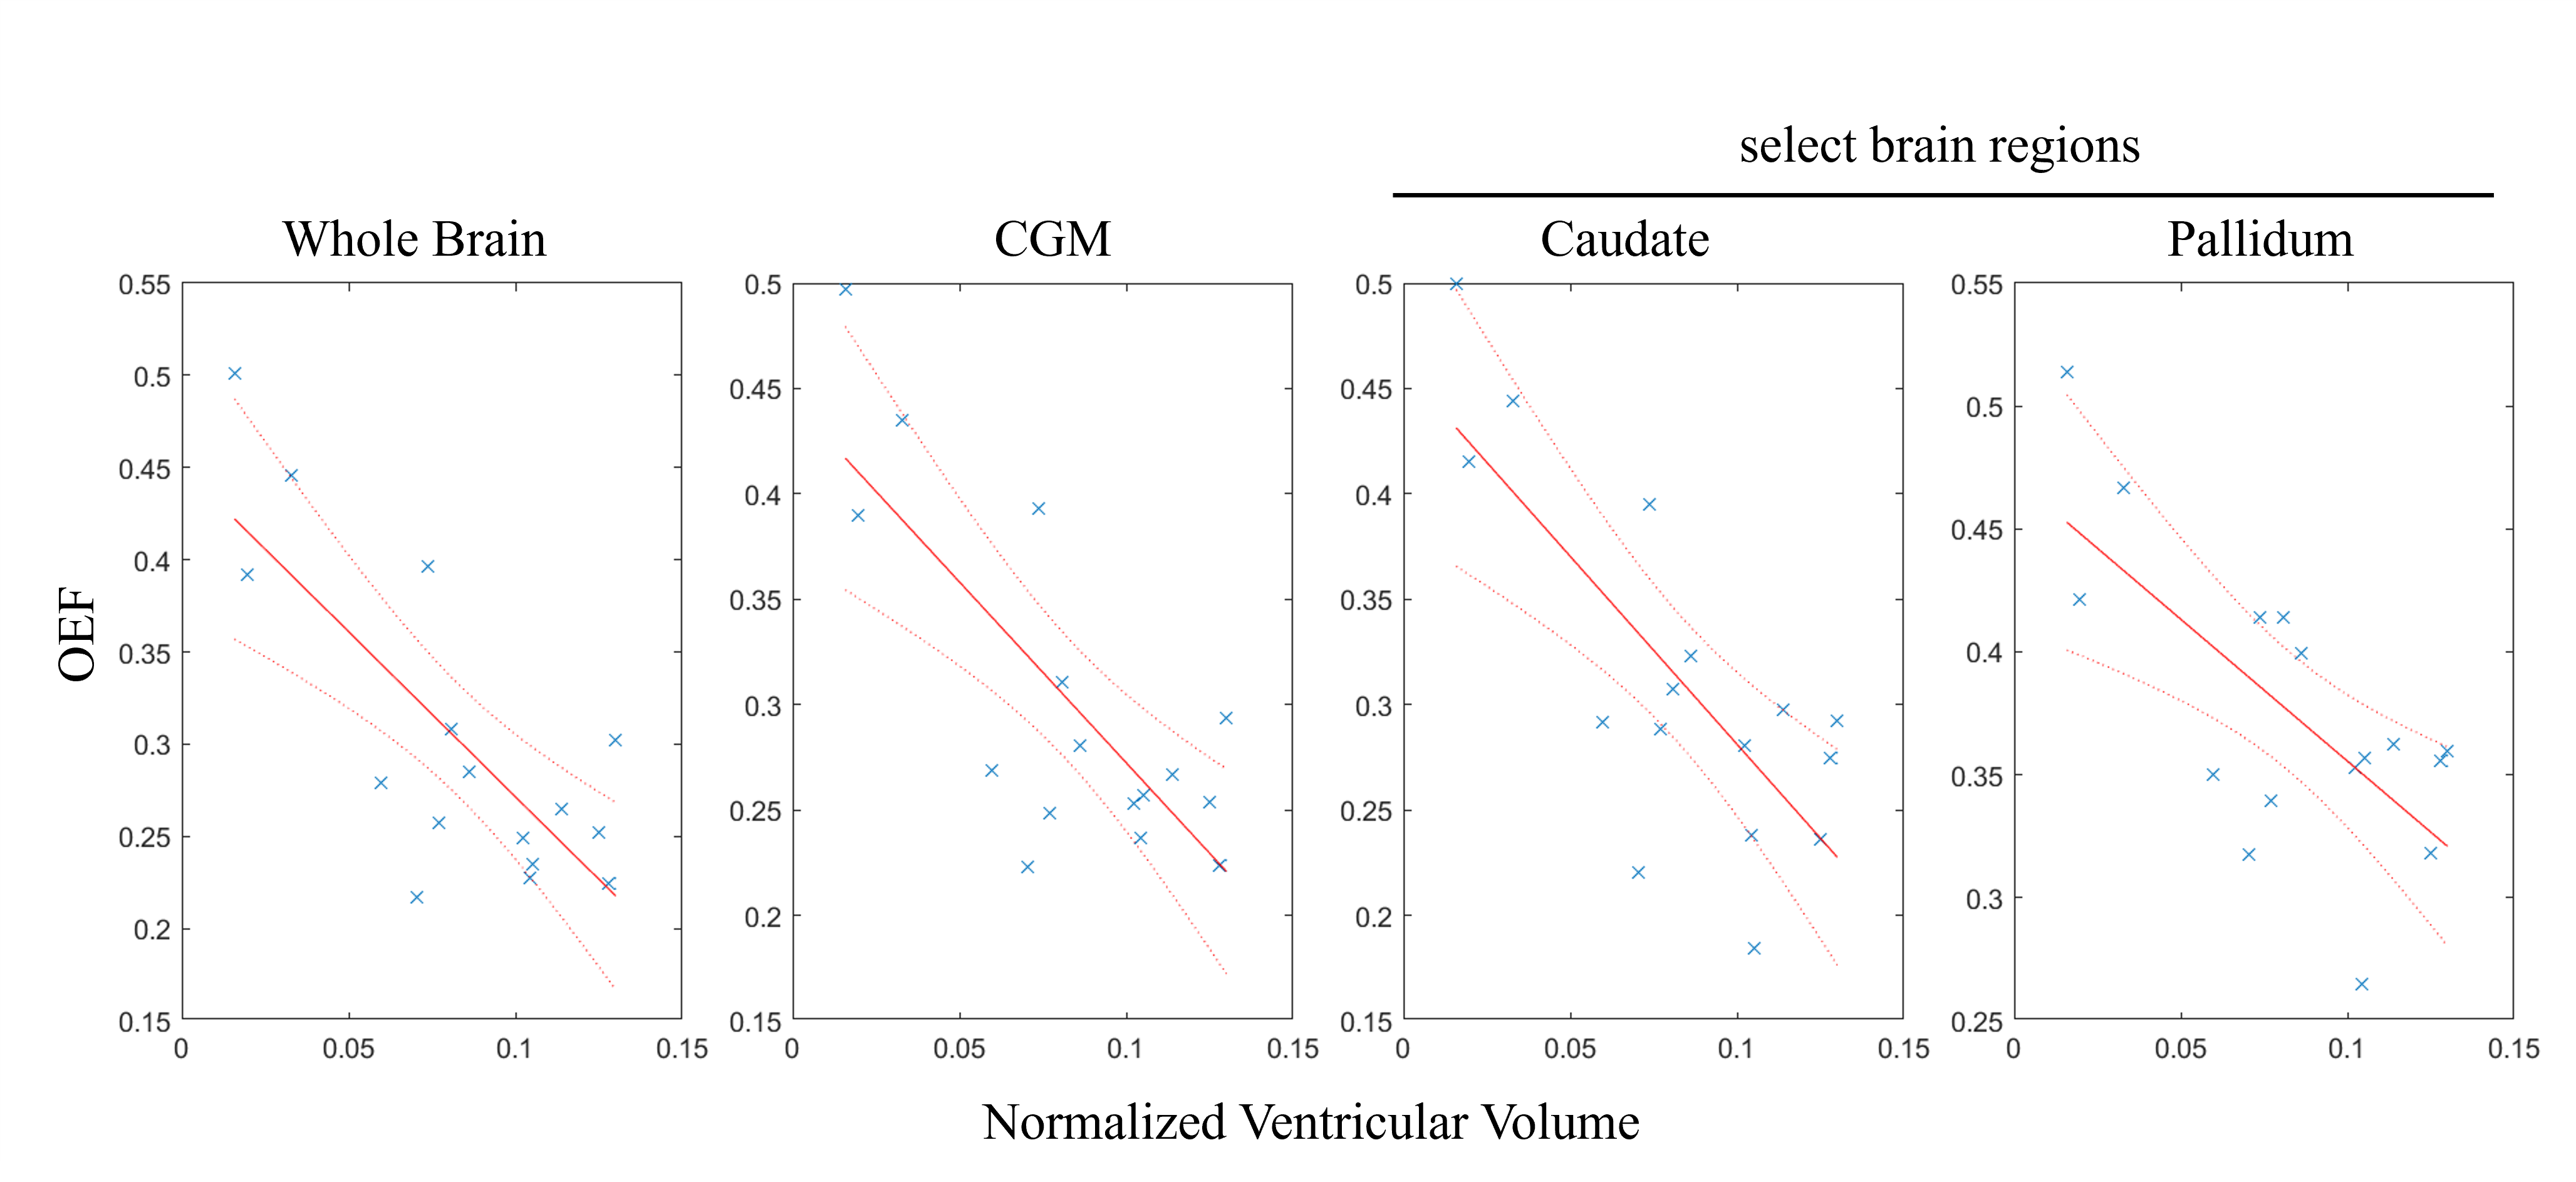
Average whole brain OEF was significantly correlated with brain ventricular volumes (β = -1.902, 95% CI: [-3.076, -0.728], p = 0.004). Average CGM OEF was significantly correlated with brain ventricular volumes (β = -1.836, 95% CI: [-2.928, -0.746], p = 0.0035). Average caudate OEF was significantly correlated with brain ventricular volumes (β = -1.504, 95% CI: [-2.719, -0.289], p = 0.020). Average pallidum OEF was significantly correlated with brain ventricular volumes (β = -1.053, 95% CI: [-1.959, -0.148], p = 0.027). Figure 1 shows patients with a low and a high ventricular volume, as well as the corresponding OEF maps. Normalized ventricular volume had no significant correlation with average thalamus or putamen OEF. Stroke volume had no significant correlation with OEF in any ROI. Gender and age were also not significant covariates. The scatterplots in Figure 2 show the linear regression model.Discussion and Conclusion
Our preliminary results demonstrate that challenge-free OEF mapping can be obtained in NPH patients. Low OEF in a number of regions was significantly correlated with high ventricular volume, an essential mechanism in NPH pathophysiology25. Low OEF in CGM with larger ventricular volume may be caused by global neurodegeneration and is possibly a consequence of damage caused by excessive fluid to the surrounding tissue25, 26. Decreased caudate OEF may correspond to neuronal loss in the caudate, which is associated with gait disturbance and dementia in NPH23. Reduced average OEF in the pallidum may explain NPH symptoms such as urinary incontinence and gait disturbance as the pallidum plays an important role in the frontal cortex-basal ganglia circuit and was reported to be activated during bladder filling24, 27. Brain OEF mapping from mGRE data using QQ has potential to provide more additional understanding of NPH.Acknowledgements
References
1. Shprecher D, Schwalb J and Kurlan R. Normal pressure hydrocephalus: diagnosis and treatment. Curr Neurol Neurosci Rep 2008; 8: 371-376. 2008/08/21. DOI: 10.1007/s11910-008-0058-2.
2. Verrees M and Selman WR. Management of normal pressure hydrocephalus. Am Fam Physician 2004; 70: 1071-1078. 2004/10/01.
3. Miyamoto J, Imahori Y and Mineura K. Cerebral oxygen metabolism in idiopathic-normal pressure hydrocephalus. Neurol Res 2007; 29: 830-834. 2007/08/25. DOI: 10.1179/016164107X181851.
4. Miyamoto J, Tatsuzawa K, Inoue Y, et al. Oxygen metabolism changes in patients with idiopathic normal pressure hydrocephalus before and after shunting operation. Acta Neurol Scand 2007; 116: 137-143. 2007/08/24. DOI: 10.1111/j.1600-0404.2007.00798.x.
5. Mattoli MV, Treglia G, Calcagni ML, et al. Usefulness of Brain Positron Emission Tomography with Different Tracers in the Evaluation of Patients with Idiopathic Normal Pressure Hydrocephalous. Int J Mol Sci 2020; 21 2020/09/11. DOI: 10.3390/ijms21186523.
6. Cho J, Kee Y, Spincemaille P, et al. Cerebral metabolic rate of oxygen (CMRO2 ) mapping by combining quantitative susceptibility mapping (QSM) and quantitative blood oxygenation level-dependent imaging (qBOLD). Magn Reson Med 2018; 80: 1595-1604. 2018/03/09. DOI: 10.1002/mrm.27135.
7. Cho J, Zhang S, Kee Y, et al. Cluster analysis of time evolution (CAT) for quantitative susceptibility mapping (QSM) and quantitative blood oxygen level-dependent magnitude (qBOLD)-based oxygen extraction fraction (OEF) and cerebral metabolic rate of oxygen (CMRO2 ) mapping. Magn Reson Med 2020; 83: 844-857. 2019/09/11. DOI: 10.1002/mrm.27967.
8. Cho J, Spincemaille P, Nguyen TD, et al. Temporal clustering, tissue composition, and total variation for mapping oxygen extraction fraction using QSM and quantitative BOLD. Magnetic Resonance in Medicine 2021. DOI: 10.1002/mrm.28875.
9. Cho J, Zhang J, Spincemaille P, et al. QQ-NET - using deep learning to solve quantitative susceptibility mapping and quantitative blood oxygen level dependent magnitude (QSM+qBOLD or QQ) based oxygen extraction fraction (OEF) mapping. Magn Reson Med 2021 2021/11/01. DOI: 10.1002/mrm.29057.
10. Cho J, Lee J, An H, et al. Cerebral oxygen extraction fraction (OEF): Comparison of challenge-free gradient echo QSM+qBOLD (QQ) with (15)O PET in healthy adults. J Cereb Blood Flow Metab 2021; 41: 1658-1668. 2020/11/28. DOI: 10.1177/0271678X20973951.
11. Cho J, Ma Y, Spincemaille P, et al. Cerebral oxygen extraction fraction: Comparison of dual-gas challenge calibrated BOLD with CBF and challenge-free gradient echo QSM+qBOLD. Magn Reson Med 2021; 85: 953-961. 2020/08/13. DOI: 10.1002/mrm.28447.
12. Zhang S, Cho J, Nguyen TD, et al. Initial Experience of Challenge-Free MRI-Based Oxygen Extraction Fraction Mapping of Ischemic Stroke at Various Stages: Comparison With Perfusion and Diffusion Mapping. Front Neurosci 2020; 14: 535441. 2020/10/13. DOI: 10.3389/fnins.2020.535441.
13. Wu D, Zhou Y, Cho J, et al. The Spatiotemporal Evolution of MRI-Derived Oxygen Extraction Fraction and Perfusion in Ischemic Stroke. Front Neurosci 2021; 15: 716031. 2021/09/07. DOI: 10.3389/fnins.2021.716031.
14. Cho J, Nguyen TD, Huang W, et al. Brain oxygen extraction fraction mapping in patients with multiple sclerosis. J Cereb Blood Flow Metab 2021: 271678X211048031. 2021/09/25. DOI: 10.1177/0271678X211048031.
15. Shen N, Zhang S, Cho J, et al. Application of Cluster Analysis of Time Evolution for Magnetic Resonance Imaging -Derived Oxygen Extraction Fraction Mapping: A Promising Strategy for the Genetic Profile Prediction and Grading of Glioma. Front Neurosci 2021; 15: 736891. 2021/10/22. DOI: 10.3389/fnins.2021.736891.
16. Palm WM, Saczynski JS, van der Grond J, et al. Ventricular dilation: association with gait and cognition. Ann Neurol 2009; 66: 485-493. 2009/10/23. DOI: 10.1002/ana.21739.
17. Liu Z, Spincemaille P, Yao Y, et al. MEDI+0: Morphology enabled dipole inversion with automatic uniform cerebrospinal fluid zero reference for quantitative susceptibility mapping. Magn Reson Med 2018; 79: 2795-2803. 2017/10/13. DOI: 10.1002/mrm.26946.
18. Liu J, Liu T, de Rochefort L, et al. Morphology enabled dipole inversion for quantitative susceptibility mapping using structural consistency between the magnitude image and the susceptibility map. Neuroimage 2012; 59: 2560-2568. 2011/09/20. DOI: 10.1016/j.neuroimage.2011.08.082.
19. Wang Y and Liu T. Quantitative susceptibility mapping (QSM): Decoding MRI data for a tissue magnetic biomarker. Magn Reson Med 2015; 73: 82-101. 2014/07/22. DOI: 10.1002/mrm.25358.
20. Jenkinson M, Bannister P, Brady M, et al. Improved optimization for the robust and accurate linear registration and motion correction of brain images. Neuroimage 2002; 17: 825-841. DOI: 10.1006/nimg.2002.1132.
21. Fischl B, Salat DH, Busa E, et al. Whole brain segmentation: automated labeling of neuroanatomical structures in the human brain. Neuron 2002; 33: 341-355. 2002/02/08. DOI: 10.1016/s0896-6273(02)00569-x.
22. Stout JC, Jernigan TL, Archibald SL, et al. Association of dementia severity with cortical gray matter and abnormal white matter volumes in dementia of the Alzheimer type. Arch Neurol 1996; 53: 742-749. 1996/08/01. DOI: 10.1001/archneur.1996.00550080056013.
23. Villablanca JR. Why do we have a caudate nucleus? Acta Neurobiol Exp (Wars) 2010; 70: 95-105. 2010/04/22.
24. Fowler CJ, Griffiths D and de Groat WC. The neural control of micturition. Nat Rev Neurosci 2008; 9: 453-466. 2008/05/21. DOI: 10.1038/nrn2401.
25. Factora R and Luciano M. Normal pressure hydrocephalus: diagnosis and new approaches to treatment. Clin Geriatr Med 2006; 22: 645-657. 2006/07/25. DOI: 10.1016/j.cger.2006.05.001.
26. Owler BK, Momjian S, Czosnyka Z, et al. Normal pressure hydrocephalus and cerebral blood flow: a PET study of baseline values. J Cereb Blood Flow Metab 2004; 24: 17-23. 2003/12/23. DOI: 10.1097/01.WCB.0000093326.88757.49.
27. Sakakibara R, Tateno F, Nagao T, et al. Bladder function of patients with Parkinson's disease. Int J Urol 2014; 21: 638-646. 2014/02/28. DOI: 10.1111/iju.12421.
Figures