3981
Texture analysis of clinical MRI detects characteristics of tissue repair in lesions of multiple sclerosis after treatment with domperidone1Biomedical Engineering Graduate Program, Schulich School of Engineering, University of Calgary, Calgary, AB, Canada, 2Department of Neurosciences, University of Calgary, Calgary, AB, Canada, 3Department of Clinical Neurosciences, University of Calgary, Calgary, AB, Canada, 4Department of Radiology, University of Calgary, Calgary, AB, Canada, 5Hotchkiss Brain Institute, University of Calgary, Calgary, AB, Canada
Synopsis
MS pathology is dynamic, involving damage and repair. We used statistical texture analysis to assess changes in MS lesions seen in sequential brain MRI of 16 RRMS patients after treatment with domperidone. We focused on 2 histology-verified texture measures: contrast and dissimilarity, which characterize tissue coarseness and heterogeneity, respectively. Lower contrast and dissimilarity were detected in both acute and total lesion groups at weeks 16 and 32 compared to baseline, and at week 32 compared to week 16. The observed changes in texture suggest remyelination in MS lesions following treatment.
Introduction
Multiple sclerosis (MS) is an autoimmune disease of the central nervous system impacting >2.8 million people worldwide1. Tissue damage is mediated by several factors including inflammation, demyelination, and axonal loss2. Remyelination also occurs in MS, particularly in acute gadolinium (Gd)-enhanced lesions in MRI3,4, and could be improved by treatment with a potential repair agent5,6. However, assessing tissue injury and repair in-vivo is challenging7. Evidence suggests that the texture patterns of MRI signal intensity relate to the degree of tissue integrity8,9. In particular, using a statistical texture analysis method, prior research found that grey level co-occurrence matrix (GLCM) contrast and dissimilarity in T2/FLAIR MRI strongly differentiated histology-confirmed MS lesions with re- or de-myelination9. The aim of this pilot study was to evaluate longitudinal changes using GLCM contrast and dissimilarity in acute MS lesions seen in brain MRI of relapsing-remitting MS (RRMS) patients before and after domperidone treatment. For comparison, changes in both acute and non-acute lesions were also measured.
Methods
This study used 3T MRI scans acquired from RRMS patients as part of a randomized, placebo-controlled, clinical trial of domperidone. Trial screening included two hundred RRMS patients but only the sixteen, who had at least one active Gd-enhancing lesion in brain MRI, were eligible for participating in this trial. The patients were scanned at three timepoints: baseline, 16 weeks, and 32 weeks (Table1). The MRI protocol included both T1-weighted and FLAIR MRI. The protocol for FLAIR was: TR/TE=7000/128ms, FOV=240×240mm2, matrix=512×512, and slice thickness=1mm, and for T1 was: TR/TE=6.5/2.9ms, FOV=192×256mm2, matrix=192×256, and slice thickness=1mm. Texture analysis used the FLAIR MRI as lesions are most detectable on this sequence10.The images were pre-processed before further computation. This included brain extraction, followed by intra-subject co-registration from FLAIR to baseline pre-contrast T1, at each timepoint and then over time, using the BET and FLIRT algorithm respectively of FSL (Oxford, UK). Next was noise reduction using median and mean filters included in ImageJ (version 1.50i, NIH, USA), and finally signal intensity normalization to the range 0-255 with an in-house program. Lesion segmentation was applied on co-registered FLAIR images using a common algorithm LST11 (Fig. 1) and confirmed by an expert neuroradiologist, including identification of Gd-enhancing lesions.
The texture maps of contrast and dissimilarity were calculated for the three timepoints of FLAIR scans using scikit-image library in Python (version 2.7) implementation of GLCM12. We focused on two out of six GLCM features, and the mean texture values per lesion were used for further analysis. Longitudinal assessment used a one-way Kruskal-Wallis non-parametric test, followed by a Dunn’s test to correct for multiple comparisons.
Results
Overall, there were 124 Gd-enhancing lesions and 2652 FLAIR (enhancing and non-enhancing) lesions analyzed from 16 MS patients. Each patient had 1-33 Gd-enhancing and 33–552 total lesions at baseline. For the Gd-enhancing lesions, FLAIR-contrast was significantly lower at week 16 and week 32 than baseline (p<0.001), and lower at week 32 than week 16 (p<0.01) following post-hoc assessments. FLAIR-dissimilarity was also significantly lower at week 16 and week 32 compared to baseline (p<0.001), but there were no significant differences between week 16 and week 32 (Fig. 3). In the assessment of combined enhancing and non-enhancing lesions, we found significantly lower contrast (p<0.01) and dissimilarity (p<0.001) at week 16, and lower contrast (p<0.001) and dissimilarity (p<0.001) at week 32 than baseline, as well as lower contrast (p<0.001) and dissimilarity (p<0.01) at week 32 than week 16 (Fig.4).Discussion
Using a well-recognized texture analysis method, GLCM, this study evaluated changes in tissue structure in enhancing and non-enhancing MS lesions as seen in FLAIR brain MRI following domperidone treatment. The GLCM is a second-order statistical texture analysis method that detects the relationship among neighboring pixels13. In MS, histopathological changes happening in the repair process, such as restoring myelin sheaths and clearance of myelin debris, can improve the uniformity of image texture14,15, leading to decreased contrast and dissimilarity. Therefore, our findings of significantly lower contrast and dissimilarity at week 16 and week 32 compared to baseline in the MS lesion groups may suggest tissue repair over time, although other ongoing mechanisms including resolution of inflammation and edema might have also played a role16,17. Further, the much stronger significance seen with Gd-enhancing lesions at follow-up scans as compared to the total lesion group appears to be consistent with prior evidence that acute MS lesions have the strongest repair capacity3,4. In addition, a previous study on MS has reported significantly higher GLCM contrast and dissimilarity in chronic active than chronic stable lesions, indicating greater texture heterogeneity, which was presumably due to the ongoing tissue destruction in chronic active lesions18. Conversely, tissue repair would lead to decreased texture heterogeneity as expected in our study. Collectively, our findings may indicate remyelination in MS lesions following treatment with domperidone; however, without a control group, the impact of regression to the mean in lesion activity may also be possible. Future studies may consider correlating the texture findings with clinical outcomes for further validation.Conclusion
Combining texture analysis with conventional MRI is a promising method for assessing changes in tissue repair such as remyelination in MS lesions.Acknowledgements
We are thankful to the MS Society of Canada, and Natural Sciences and Engineering Research Council of Canada (NSERC) for funding the study.References
1. The Multiple Sclerosis International Federation, Atlas of MS, 3rd Edition September 2020.
2. Vavasour I, Laule C, Li D, et al. Longitudinal changes in myelin water fraction in two MS patients with active disease. Journal of the neurological sciences 2009; 276(1-2): 49-53.
3. Heß K, Starost L, Kieran NW, et al. Lesion stage-dependent causes for impaired remyelination in MS. Acta neuropathologica 2020; 140(3): 359-75.
4. Raine CS, Wu E. Multiple sclerosis: remyelination in acute lesions. Journal of Neuropathology & Experimental Neurology 1993; 52(3): 199-204.
5. Plemel JR, Liu W-Q, Yong VW. Remyelination therapies: a new direction and challenge in multiple sclerosis. Nature reviews Drug discovery 2017; 16(9): 617-34.
6. Bernitsas E, Kopinsky H, Lichtman‐Mikol S, et al. Multimodal MRI Response to Fingolimod in Multiple Sclerosis: A Nonrandomized, Single Arm, Observational Study. Journal of Neuroimaging 2021; 31(2): 379-87.
7. Lubetzki C, Zalc B, Williams A, Stadelmann C, Stankoff B. Remyelination in multiple sclerosis: from basic science to clinical translation. The Lancet Neurology 2020; 19(8): 678-88.
8. Zhang Y. MRI texture analysis in multiple sclerosis. International journal of biomedical imaging 2012; 2012.
9. Hosseinpour Z, Oladosu Olayinka , Soleymani Mahshid , Pike G Bruce , Zhang Yunyan. Characterization of multiple sclerosis lesion types with texture analysis of advanced and conventional MRI. ISMRM & SMRT Annual Meeting & Exhibition 2021.
10. Knight J, Khademi A. MS lesion segmentation using FLAIR MRI only. Proceedings of the 1st MICCAI challenge on multiple sclerosis lesions segmentation challenge using a data management and processing infrastructure-MICCAI-MSSEG 2016: 21-8.
11. Schmidt et al. www.statisticalmodelling.de/lst.html. 2012.
12. Stéfan van der Walt JLS, Juan Nunez-Iglesias, et al. scikit-image: Image processing in Python. PeerJ 2:e453 2014.
13. Srinivasan G, Shobha G. Statistical texture analysis. Proceedings of world academy of science, engineering and technology; 2008; 2008. p. 1264-9.
14. Podbielska M, Banik NL, Kurowska E, Hogan EL. Myelin recovery in multiple sclerosis: the challenge of remyelination. Brain sciences 2013; 3(3): 1282-324.
15. Franklin RJ, Kotter MR. The biology of CNS remyelination. Journal of neurology 2008; 255(1): 19-25.
16. Sormani MP, Pardini M. Assessing repair in multiple sclerosis: outcomes for phase II clinical trials. Neurotherapeutics 2017; 14(4): 924-33.
17. Meier DS, Weiner H, Guttmann CR. MR imaging intensity modeling of damage and repair in multiple sclerosis: relationship of short-term lesion recovery to progression and disability. American Journal of Neuroradiology 2007; 28(10): 1956-63.
18. Weber CE, Wittayer M, Kraemer M, et al. Quantitative MRI texture analysis in chronic active multiple sclerosis lesions. Magnetic Resonance Imaging 2021; 79: 97-102.
Figures
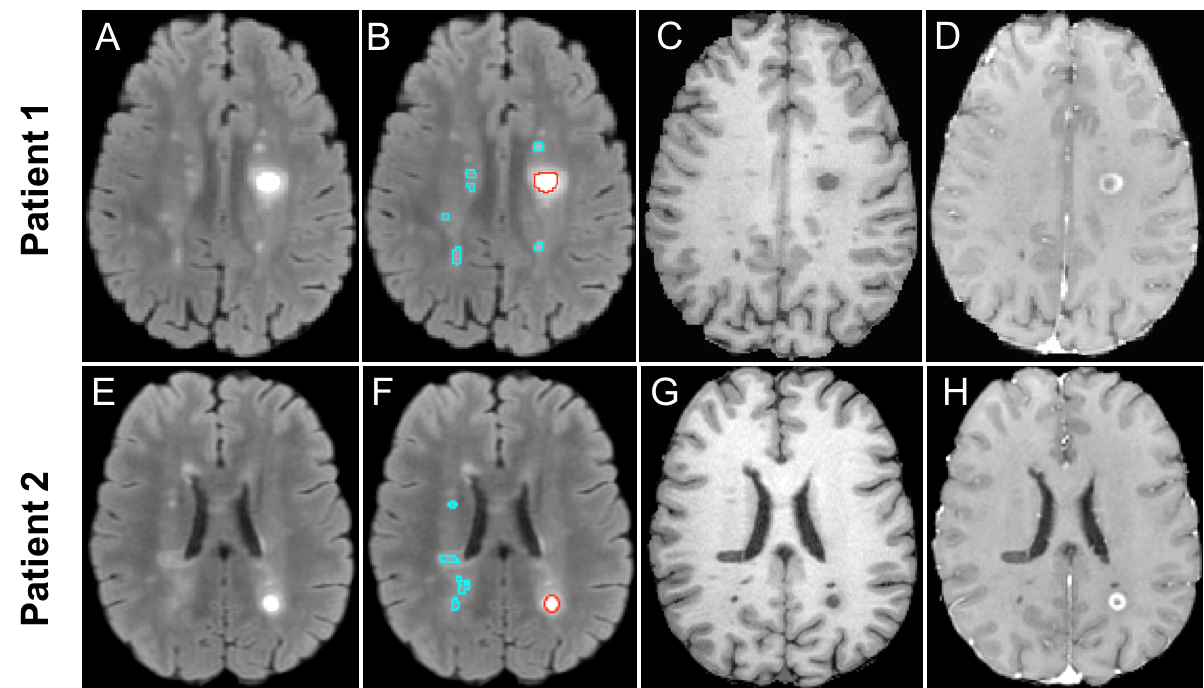
Figure 1. Example MR images and segmented lesions for 2 RRMS patients. Shown are the FLAIR images without (A, E) and with (B, F) the overlay of segmented (red: Gd-enhancing, blue: non-enhancing) lesion ROIs, pre-contrast T1 (C, G), and post-contrast T1 (D, H). Note: RRMS: relapsing-remitting multiple sclerosis.
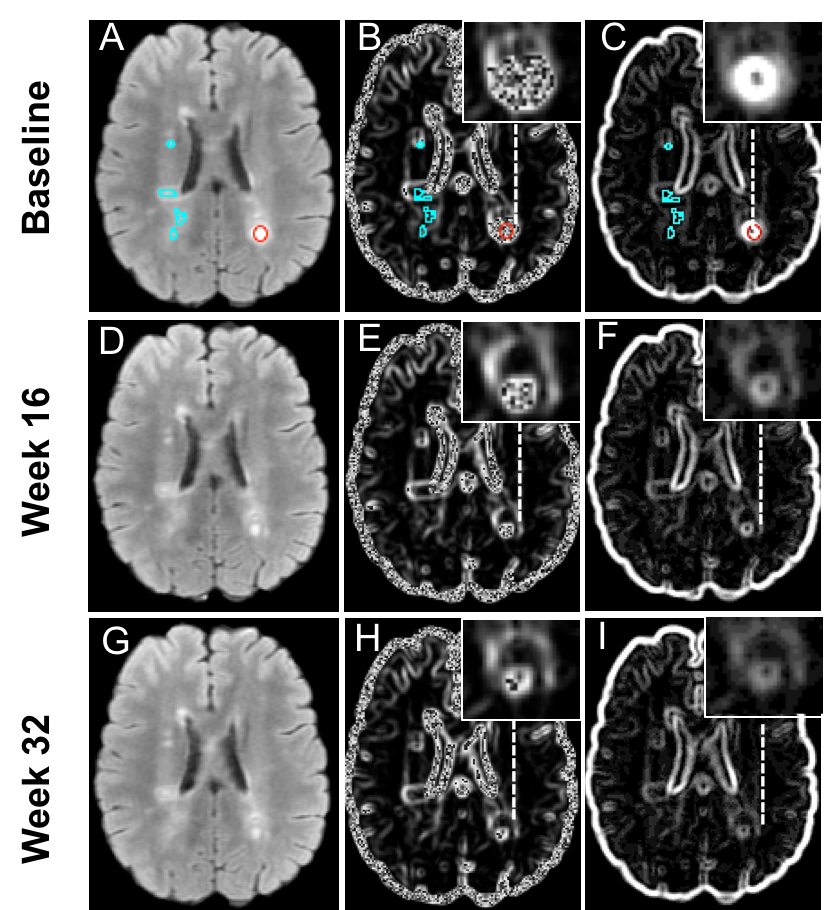
Figure 2. Example in-vivo MS patient FLAIR MRI and the associated texture maps at three timepoints. Shown are a FLAIR MRI from an RRMS patient (A, D, G), FLAIR-Contrast (B, E, H), FLAIR-Dissimilarity (C, F, I), Top row (baseline): with segmented enhancing (red) and non-enhancing (blue) lesions. Middle row (week 16), and bottom row (week 32): shrinkage of example enhancing lesion, and the improvement in texture maps representing less heterogeneity (magnified boxes) can be seen in the follow-up images.
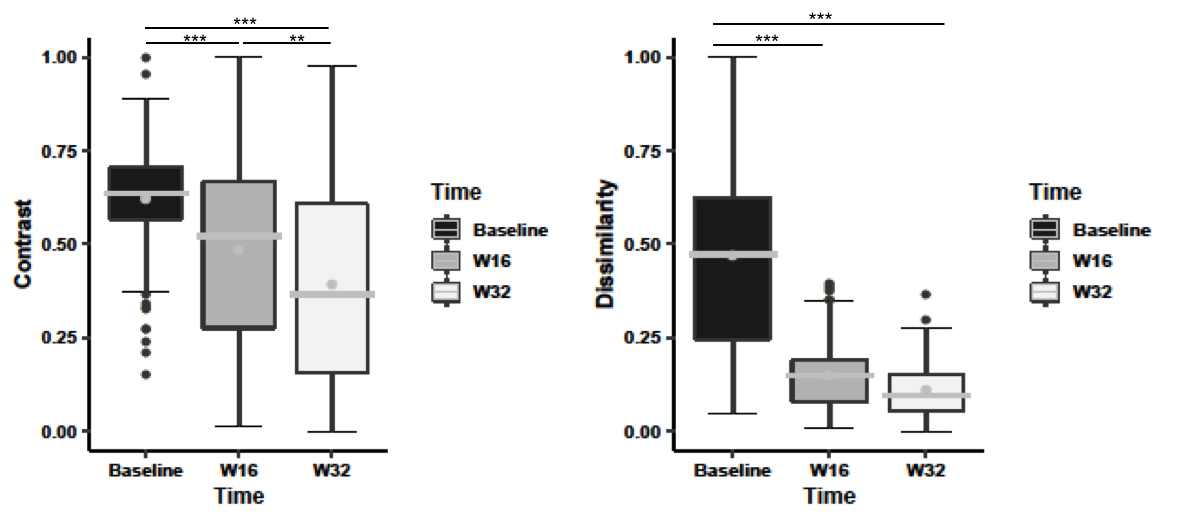
Figure 3. Longitudinal analysis of gadolinium-enhancing lesions’ changes. Shown are FLAIR contrast and dissimilarity texture measured from grey level co-occurrence matrix at baseline, week 16, and week 32. The improvements of texture measurements over time indicate tissue recovery within enhancing lesions. The stars indicate significance values: *p<0.05; **p<0.01; ***p<0.001. The boxes are interquartile range (IQR), the lines are the median and the grey dots are the mean.
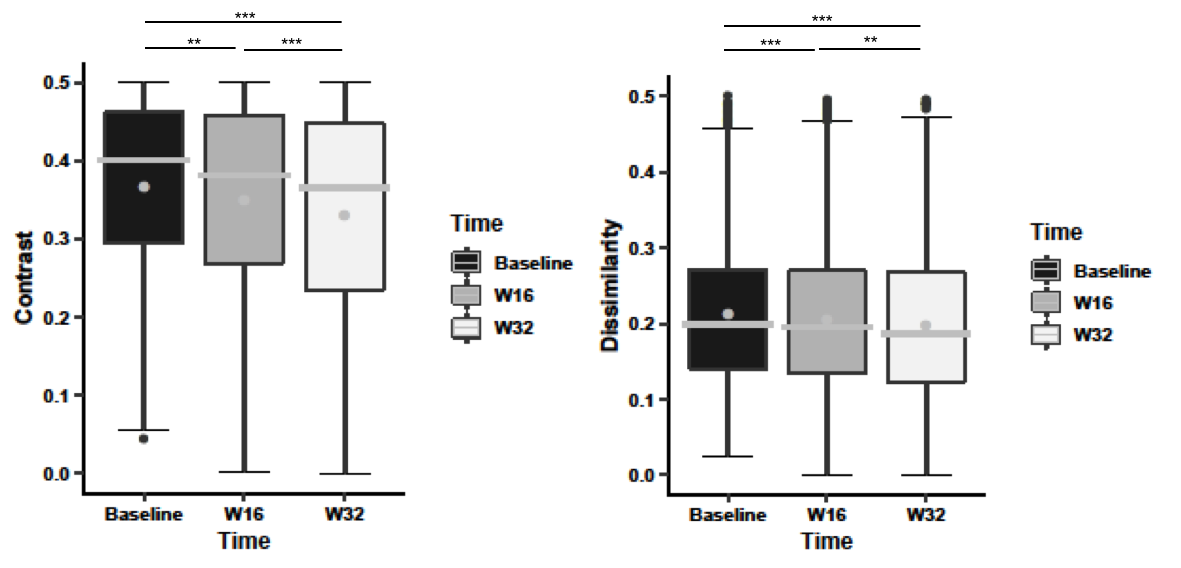
Figure 4. Longitudinal analysis of all lesion changes. Shown are FLAIR contrast and dissimilarity texture measured from grey level co-occurrence matrix at baseline, week 16, and week 32. The improvement of texture measurements over time indicates tissue recovery within all lesions. The stars indicate significance values: *p<0.05; **p<0.01; ***p<0.001. The boxes are interquartile range (IQR), the lines are the median and the grey dots are the mean.
