3980
Association Between Common MRI Metrics of Disease Activity in MS and Spinal Cord Atrophy1Neurology, Mayo Clinic, Rochester, MN, United States, 2Radiology, Mayo Clinic, Rochester, MN, United States, 3Center for Multiple Sclerosis and Autoimmune Neurology, Mayo Clinic, Rochester, MN, United States, 4Quantitative Health Sciences, Mayo Clinic, Rochester, MN, United States
Synopsis
Cervical spinal cord atrophy is an important MRI measure that correlates with progressive MS. We have previously shown that the cranio-caudal loss of cervical cord area correlates with the evolution in MS disease continuum. In this prospective study, in addition to age, we showed that thalamic volumes may correlate with cervical cord area measurements, possibly through a Wallerian degeneration mechanism, while total brain lesion volumes do not. Our findings suggest that spinal cord area measurements in MS is potentially an independent metric from lesion load measurements but can be complemented by thalamic volume measurements as imaging outcomes in clinical trials.
Introduction
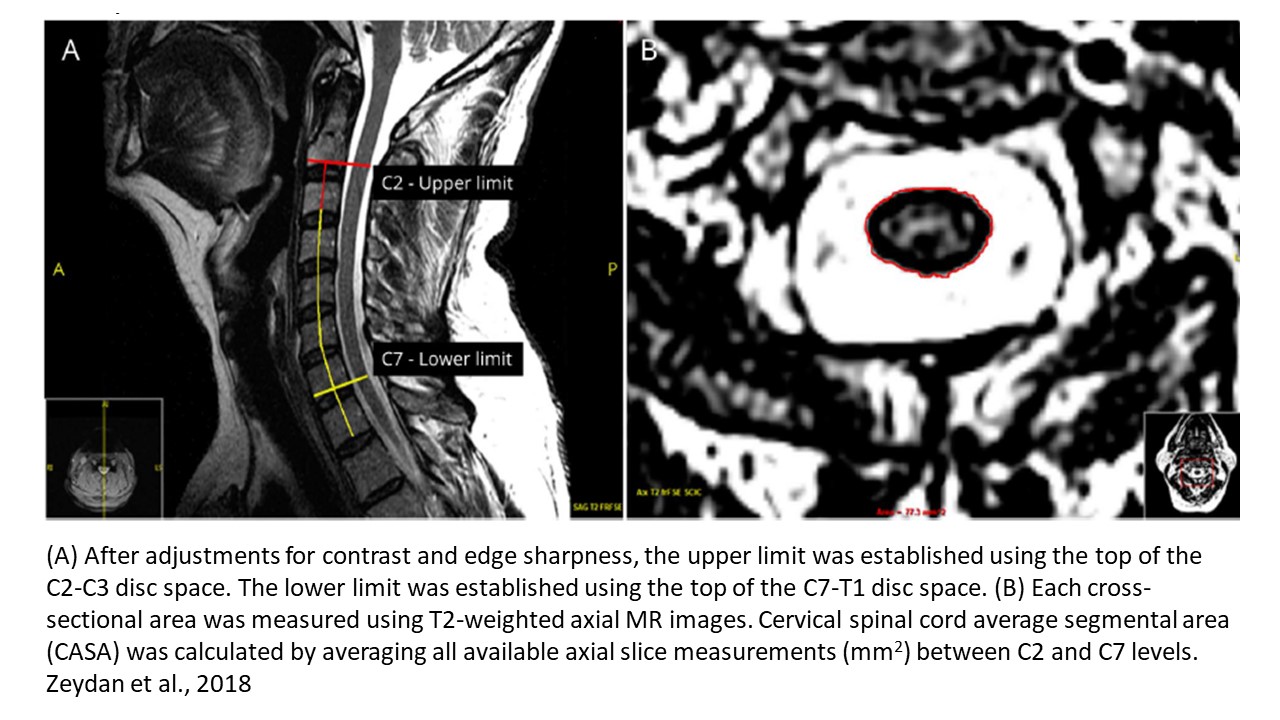
Progressive MS (PMS) is the main determinant of disability worsening in MS. Caudal cervical spinal cord atrophy is an important predictor of evolution to PMS, because it is already present at the time of or right before the onset of clinically confirmed progressive PMS.1 Moreover, caudal cervical spinal cord atrophy, is used as a supportive imaging criterion in progressive MS diagnosis.1-3In clinical trials, where standardized MRIs are obtained, semi-automated methods are often used to measure cervical spinal cord volume. However, to generate these methods, manual approach remains as the gold standard, which seems to be a better option for heterogeneously-sourced clinical MRIs. In a previous retrospective study, we used a manual approach to measure each segmental area from C2 to C7 level and averaged these areas to calculate cervical spinal cord average segmental area (CASA) from heterogeneously-sourced clinical MRIs and showed that CASA is an early biomarker of progression.1 In another complementary retrospective study, we utilized previously established manual1 and semi-automated4 methods to identify C5 level as the practical single-level spinal cord area, which both represented CASA sufficiently and reflected the cranio-caudal pattern of spinal cord atrophy.5
In addition to independent effects of sex and age at MRI; common MRI metrics used in clinical trials such as brain structure volumes and brain lesion volumes may impact CASA. To date, there have been inconsistent results on the association of spinal cord volume with brain atrophy and brain lesion volume.6,7
In the current study, conducted in an independent prospective cohort, our objective was to; 1) assess if CASA is impacted by aging as well as brain structure volumes and total brain lesion volume; 2) evaluate and confirm the identification of a practical single caudal level of cervical spinal cord area that reflects CASA.
Methods
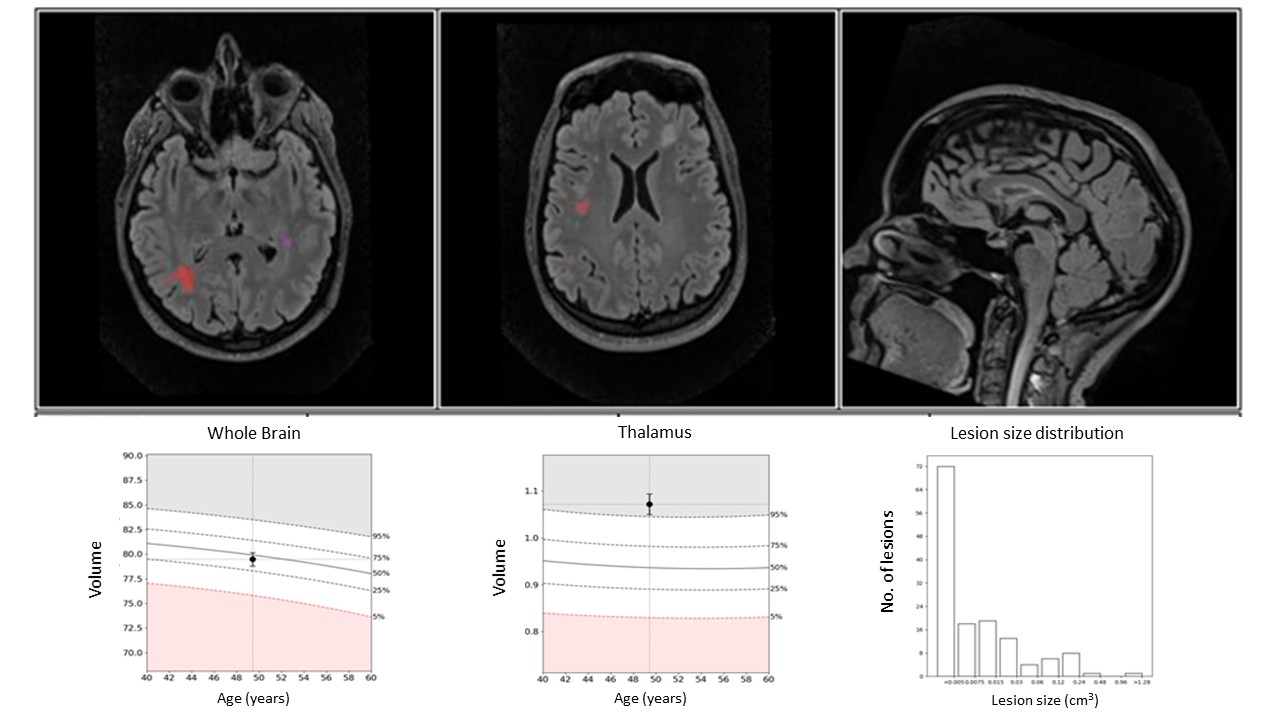
One hundred fifty-nine brain and 159 cervical spinal cord MRIs (attained within 0-10 days), using a standardized clinical MS imaging protocol from 106 consecutive patients with MS (age mean±SD=46.1±12.5 years, 75 women, 31 men) from a single center were included prospectively during routine clinical visits.For spinal cord area analysis, a previously published and established manual method was used1 (Figure-1) and cervical spinal cord areas at each level from C2 to C7 were measured twice and averaged to calculate CASA. An automated method called LesionQuant (LQ) was used to analyze brain structure and lesion volumes (Figure-2). LQ is a software, which segments and measures brain structure volumes automatically and compares them with established normative values.8,9 It is a software developed for the assessment of brain atrophy and lesions in patients with MS to be used uniformly across centers as a clinically available tool as opposed to center-specific research protocols.8
Results
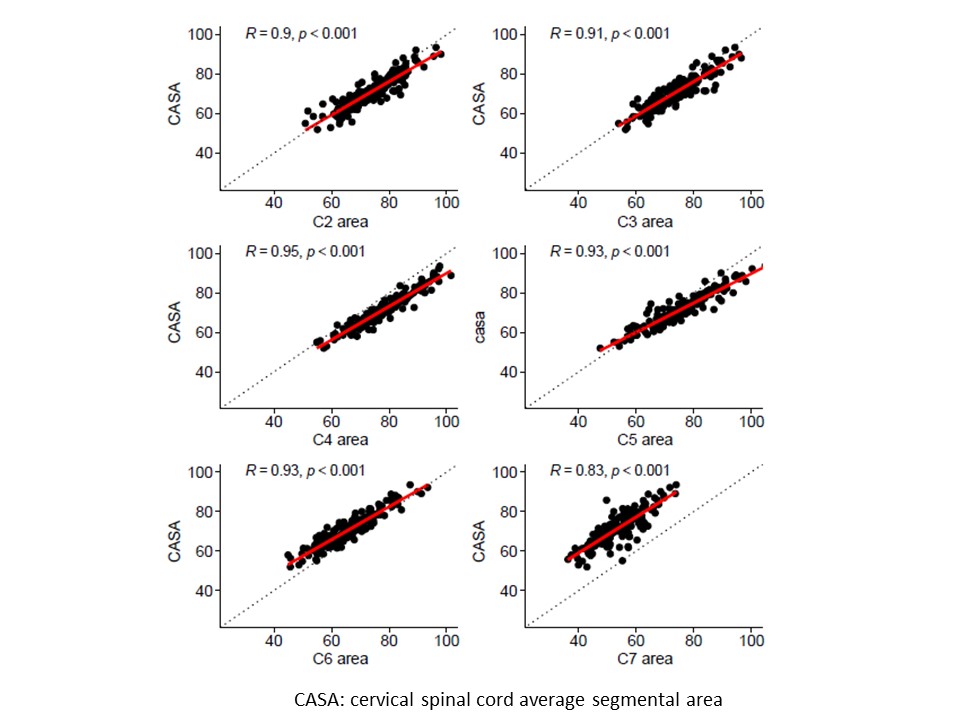
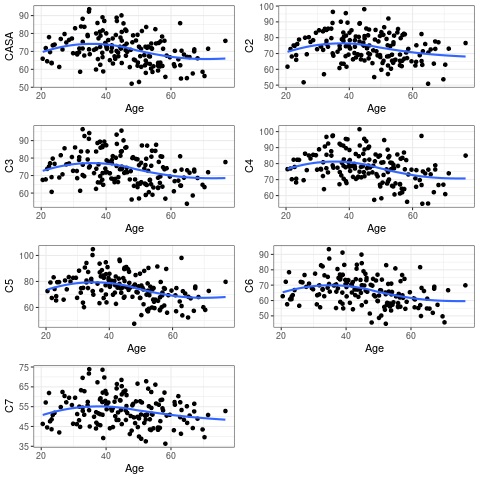
All cervical spinal cord segmental areas correlated with CASA, but the most significant correlations were between CASA and C4 (R=0.95, p<0.001), C5 (R=0.93, p<0.001) and C6 (R=0.93, p<0.001) levels (Figure-3). All cervical spinal cord segmental areas and CASA also correlated with age, and the most significant correlations existed between age and C4 (R=-0.34, p<0.001), C5 (R=-0.39, p<0.001) and C6 (R=-0.34, p<0.001) levels (Figure-4).CASA correlated with total brain volume both unadjusted (R=0.38, p<0.001) and adjusted for age and sex (R=0.29, p<0.001). CASA also correlated with thalamic volume both unadjusted (R=0.38, p<0.001) and adjusted for age and sex (R=0.30, p<0.001). While total brain and thalamic volumes correlated with CASA, there was no association found between total brain lesion volume and CASA (unadjusted, R=-0.13, p=0.117; adjusted for age and sex, R=-0.01, p=0.871). Total brain lesion volume did not correlate with total brain volume either (unadjusted, R=-0.13, p=0.122; adjusted for age and sex, R=-0.02, p=0.767), but a significant association was found between total brain lesion volume and thalamic volume (unadjusted, R=-0.26, p=0.002; adjusted for age and sex, R=-0.21, p=0.012).
Discussion
In this prospective study C4, C5 and C6 level segmental areas strongly correlated with CASA. In line with our previous findings, in an independent clinical cohort, C5 level stood out as it is the overlapping area between middle (C3-C4-C5) and lower (C5-C6-C7) segments of the cervical spinal cord, reflecting the cranio-caudal pattern of atrophy.As a subclinical progression biomarker, cervical spinal cord atrophy is a clinically relevant MRI measure in MS. Identifying potential factors that could be associated with cervical spinal cord atrophy is important. Cervical spinal cord atrophy becomes more evident with aging and it may be associated with total brain volume and thalamic volume. However, total brain lesion volume does not seem to strongly impact cervical spinal cord area measures suggesting the independence of cervical spinal cord area measurements as a subclinical progressive MS biomarker.
Conclusion
When evaluating cervical spinal cord atrophy measures; age, total brain volume and thalamic volume may need to be corrected for, while brain lesion burden appears to be an independent metric. From a practicality and ease of application standpoint in the clinic, single level area measurements such as C5 level may be used as it reflects average cervical spinal cord area in a cranio-caudal atrophy pattern in patients with MS.Acknowledgements
NIH (NIA:U54 AG44170) and Mayo Clinic CMSANReferences
1. Zeydan B, Gu X, Atkinson EJ, et al. Cervical spinal cord atrophy: An early marker of progressive MS onset. Neurol Neuroimmunol Neuroinflamm. 2018;5(2):e435.
2. Rocca MA, Valsasina P, Meani A, et al. Clinically relevant cranio-caudal patterns of cervical cord atrophy evolution in MS. Neurology. 2019.
3. Filippi M, Preziosa P, Barkhof F, et al. Diagnosis of Progressive Multiple Sclerosis From the Imaging Perspective: A Review. JAMA Neurol. 2021;78(3):351-364.
4. Liu W, Nair G, Vuolo L, et al. In vivo imaging of spinal cord atrophy in neuroinflammatory diseases. Ann Neurol. 2014;76(3):370-378.
5. Zeydan B, Ucem S, Dubuche T, et al. C5 level area can replace whole cervical spinal cord area measurements in multiple sclerosis as a practical biomarker of progression. ISMRM 2020.
6. Biberacher V, Boucard CC, Schmidt P, et al. Atrophy and structural variability of the upper cervical cord in early multiple sclerosis. Mult Scler. 2015;21(7):875-884.
7. Bot JC, Barkhof F. Spinal-cord MRI in multiple sclerosis: conventional and nonconventional MR techniques. Neuroimaging Clin N Am. 2009;19(1):81-99.
8. Brune S, Hogestol EA, Cengija V, et al. LesionQuant for Assessment of MRI in Multiple Sclerosis-A Promising Supplement to the Visual Scan Inspection. Front Neurol. 2020;11:546744.
9. Brewer JB. Fully-automated volumetric MRI with normative ranges: translation to clinical practice. Behav Neurol. 2009;21(1):21-28.
Figures