3979
Assessing Tissue Structure Differences Between RRMS and SPMS Patients Using Advanced Diffusion and MRI Texture Analysis1Neuroscience, University of Calgary, Calgary, AB, Canada, 2Clinical Neurosciences, University of Calgary, Calgary, AB, Canada, 3Hotchkiss Brain Institute, University of Calgary, Calgary, AB, Canada, 4Radiology, University of Calgary, Calgary, AB, Canada
Synopsis
Tissue structure changes underlying disease development and progression in MS are not fully understood. We investigated tissue structure in 29 RRMS and SPMS patients using advanced diffusion imaging and MRI texture measures using analyses over 3 spatial scales: white matter histogram analysis, tract ROI analysis, and along-tract statistics. We found that phase congruency texture analysis best differentiated RRMS and SPMS patients in histogram analysis. Diffusion measures differentiated the subtypes across all analyses in multiple tracts. The findings by advanced measures of tissue structure may further research into disease progression in MS.
Introduction
Multiple sclerosis (MS) is a common, chronic disease of the central nervous system characterized by inflammatory demyelination and neurodegeneration. Most patients start with a relapsing-remitting (RRMS) form, but 60–70% progress to a secondary-progressive phenotype (SPMS) within 20–25 years of disease onset1. This is accompanied by a critical shift from acute relapses to increasing disability without clinical and radiographic evidence of relapse activity and limited treatment options1. Only recently have spatiotemporal patterns underlying MS progression been postulated based on MRI measures of myelopathy and axonopathy2. To further this effort, we investigated whether tissue structure patterns of nerve fiber tracts were different between RRMS and SPMS using advanced diffusion MRI and texture analysis methods.Methods
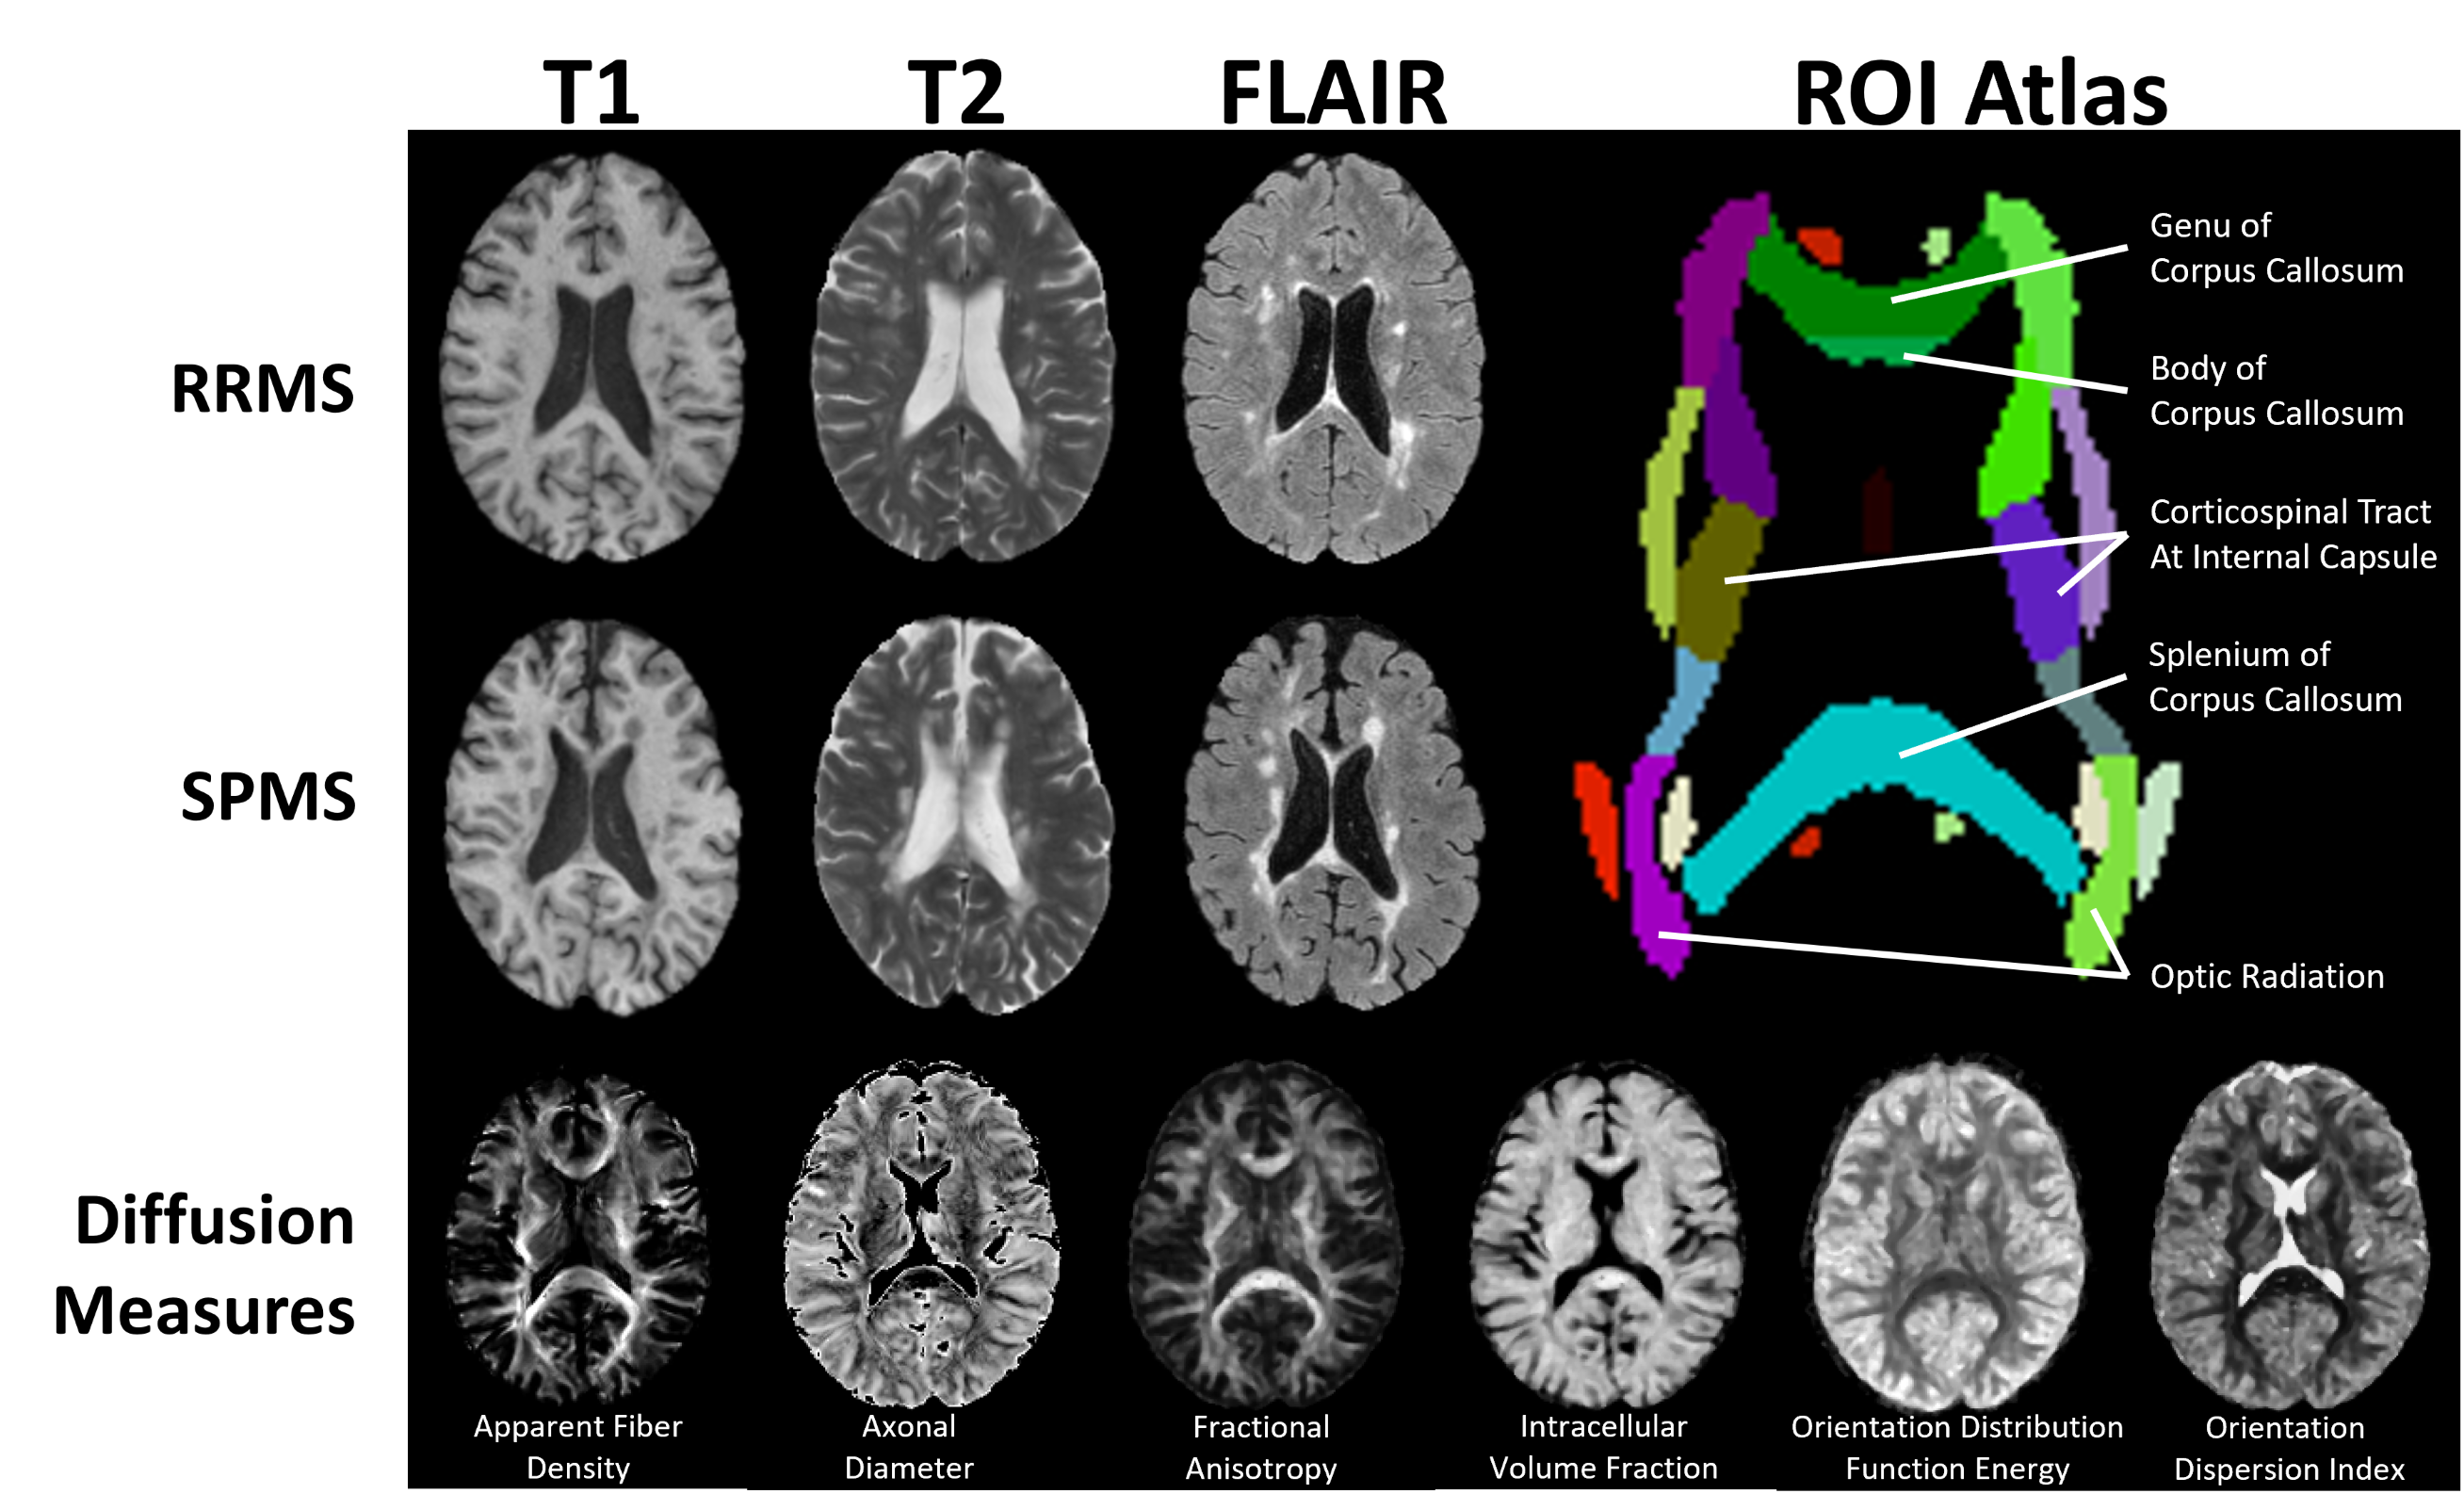
3T brain MRI from two clinical studies (Dataset1/Dataset2 = 10 RRMS / 10 RRMS & 9 SPMS) were analyzed for anatomical and diffusion MRI (Fig1). The imaging protocol included T1-weighted MRI acquired with a 1 mm isotropic magnetization-prepared fast-spoiled gradient echo BRAVO sequence using TR1/TR2/TE1/TE2/TI1/TI2 = 6.7/8.0/2.9/3.0/0.45/0.65 ms; T2-weighted MRI acquired with a spin-echo sequence using TR1/TR2/TE1/TE2 = 6000/5600/84/100 ms; matrix = 256x256/512x512, FOV = 24x24/22x22 cm, and slice thickness = 3 mm; and FLAIR MRI obtained with a spin-echo inversion recovery sequence using TR1/TR2/TE1/TE2 = 7000/6000/127/127 ms; matrix = 512x512, FOV = 24x24 cm. Diffusion MRI was acquired with a spin-echo echo-planar sequence using TR1/TR2/TE1/TE2 = 8000/8000/84/61 ms; matrix = 120x120, FOV = 24x24 cm, slice thickness=3/2 mm, #b0 = 5/3, and b-value = 850/1000 s/mm2, 23/45 directions.Texture analysis of T2 and FLAIR MRI focused on phase congruency (PC), a sensitive, contrast-robust method for detecting ‘edges and corners’ of structures3. Two parameters were calculated: PC and weighted mean phase (WMP), with maximum wavelengths of 16 and 32 voxels for detection of high frequency features. Diffusion MRI was preprocessed by denoising, compensation for Gibbs ringing, and susceptibility distortion and eddy current correction. Datasets were then harmonized by angular resampling4 and the LinearRISH method to remove voxel-wise scanning differences5. For high angular resolution diffusion imaging analysis, b=2000 s/mm2 datasets were predicted using an in-house deep learning algorithm. Diffusion measures included: 1) apparent fiber density (AFD), 2) fractional anisotropy (FA), 3) axonal diameter, axonal volume fraction (ICVF), and orientation dispersion index (ODI), and 4) orientation distribution function (ODF) energy, calculated using MRtrix3, FSL, AMICOx6, and a gaussian fit of ODF signal, respectively.
Three scales of analyses were performed: whole-brain normal-appearing white matter (NAWM) histogram analysis (256 bins), tract-based region of interest (ROI) analysis, and along-tract statistics. Histogram analysis examined histogram peaks, 50th percentile (p50), p75, and p95 features. ROI analysis examined lesion and NAWM areas of 3 key tracts: corpus callosum, corticospinal tracts, and optic radiations (JHU-ICBM atlas, Fig1). Lastly, investigating the same tracts, along-tract statistics were derived from TractSeg-based tractography reconstruction and tractometry7,8; statistical analysis used a mixed-effect age-controlled model9.
Results
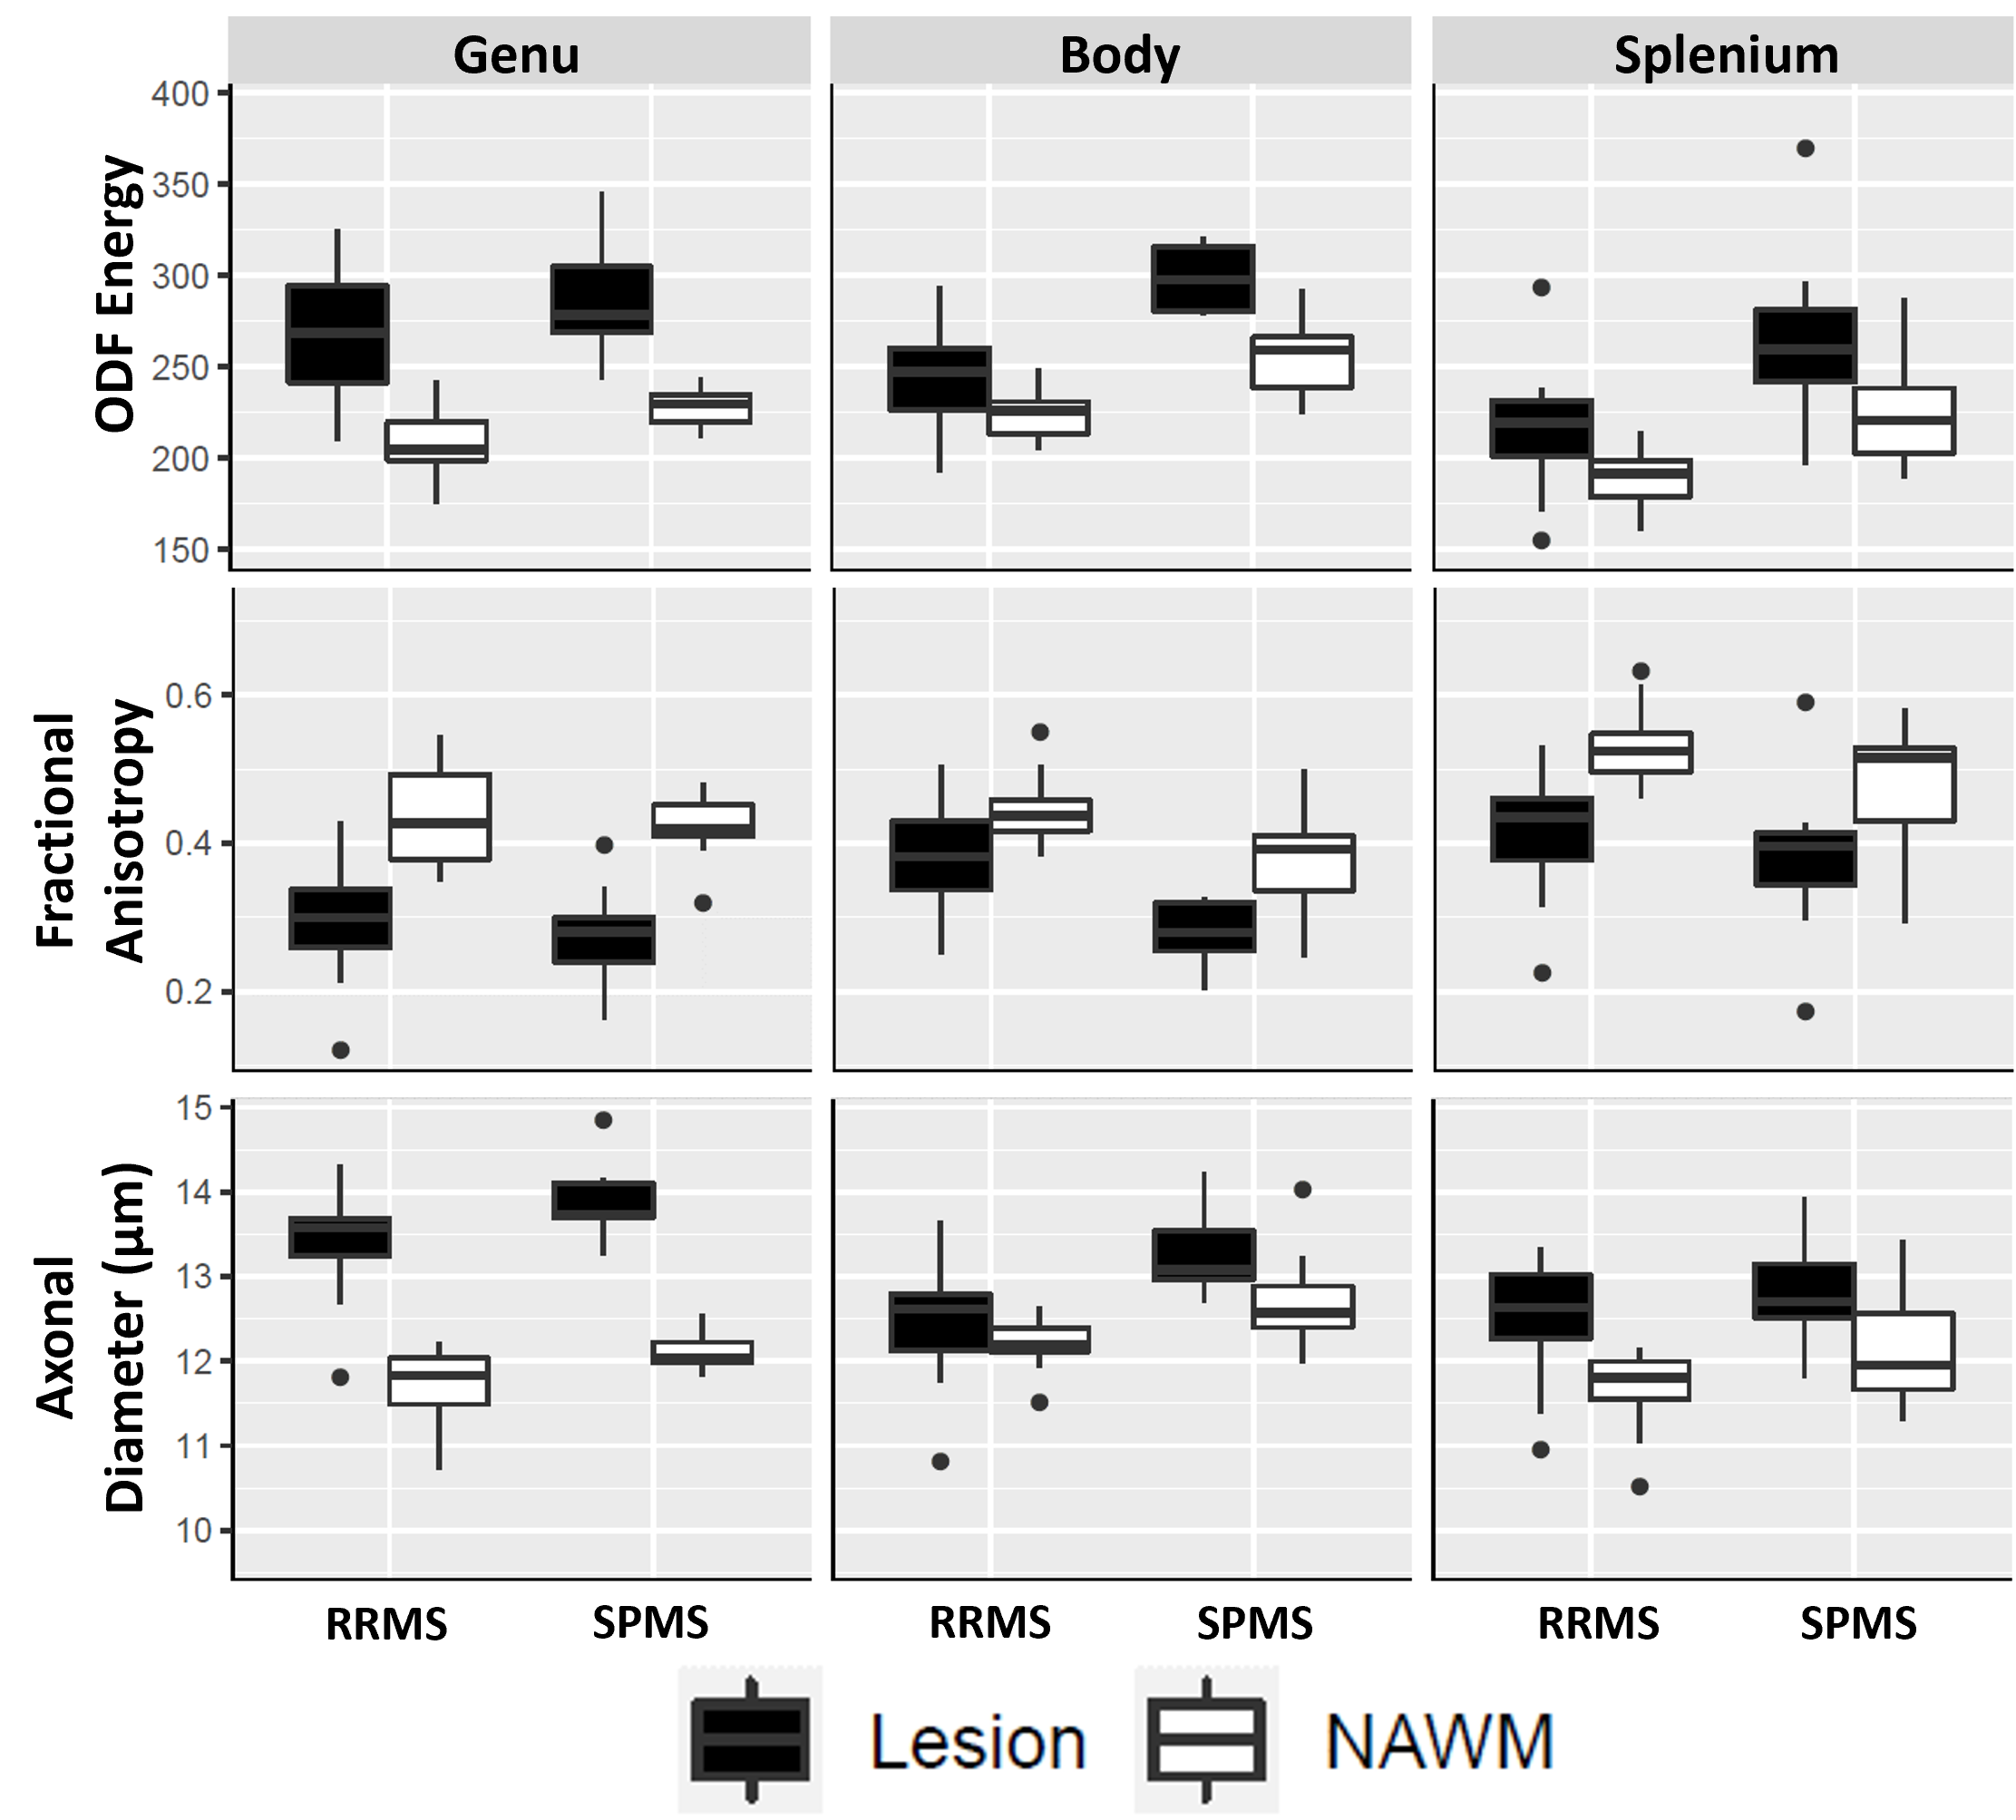
Texture histogram analysis showed significant differences between cohorts in T2 (p75) and FLAIR (peak, p50, p95) PC16, and in FLAIR PC32 and WMP16 (peak and p95). ODF energy detected significant differences across all histogram features, followed by ODI and FA with differences on 3/4 features excluding peak and p95 respectively.In ROI analysis, diffusion measures were more sensitive to cohort differences than textural measures (Fig2). Comparing lesion microstructure, all measures but ICVF and ODI differentiated cohorts in the corpus callosum body. FA and ODF energy differentiated cohorts in NAWM of the corpus callosum body and splenium, and optic radiations. Diameter and ICVF detected cohort differences only in the NAWM of left optic radiation, and ODI in right optic radiation.
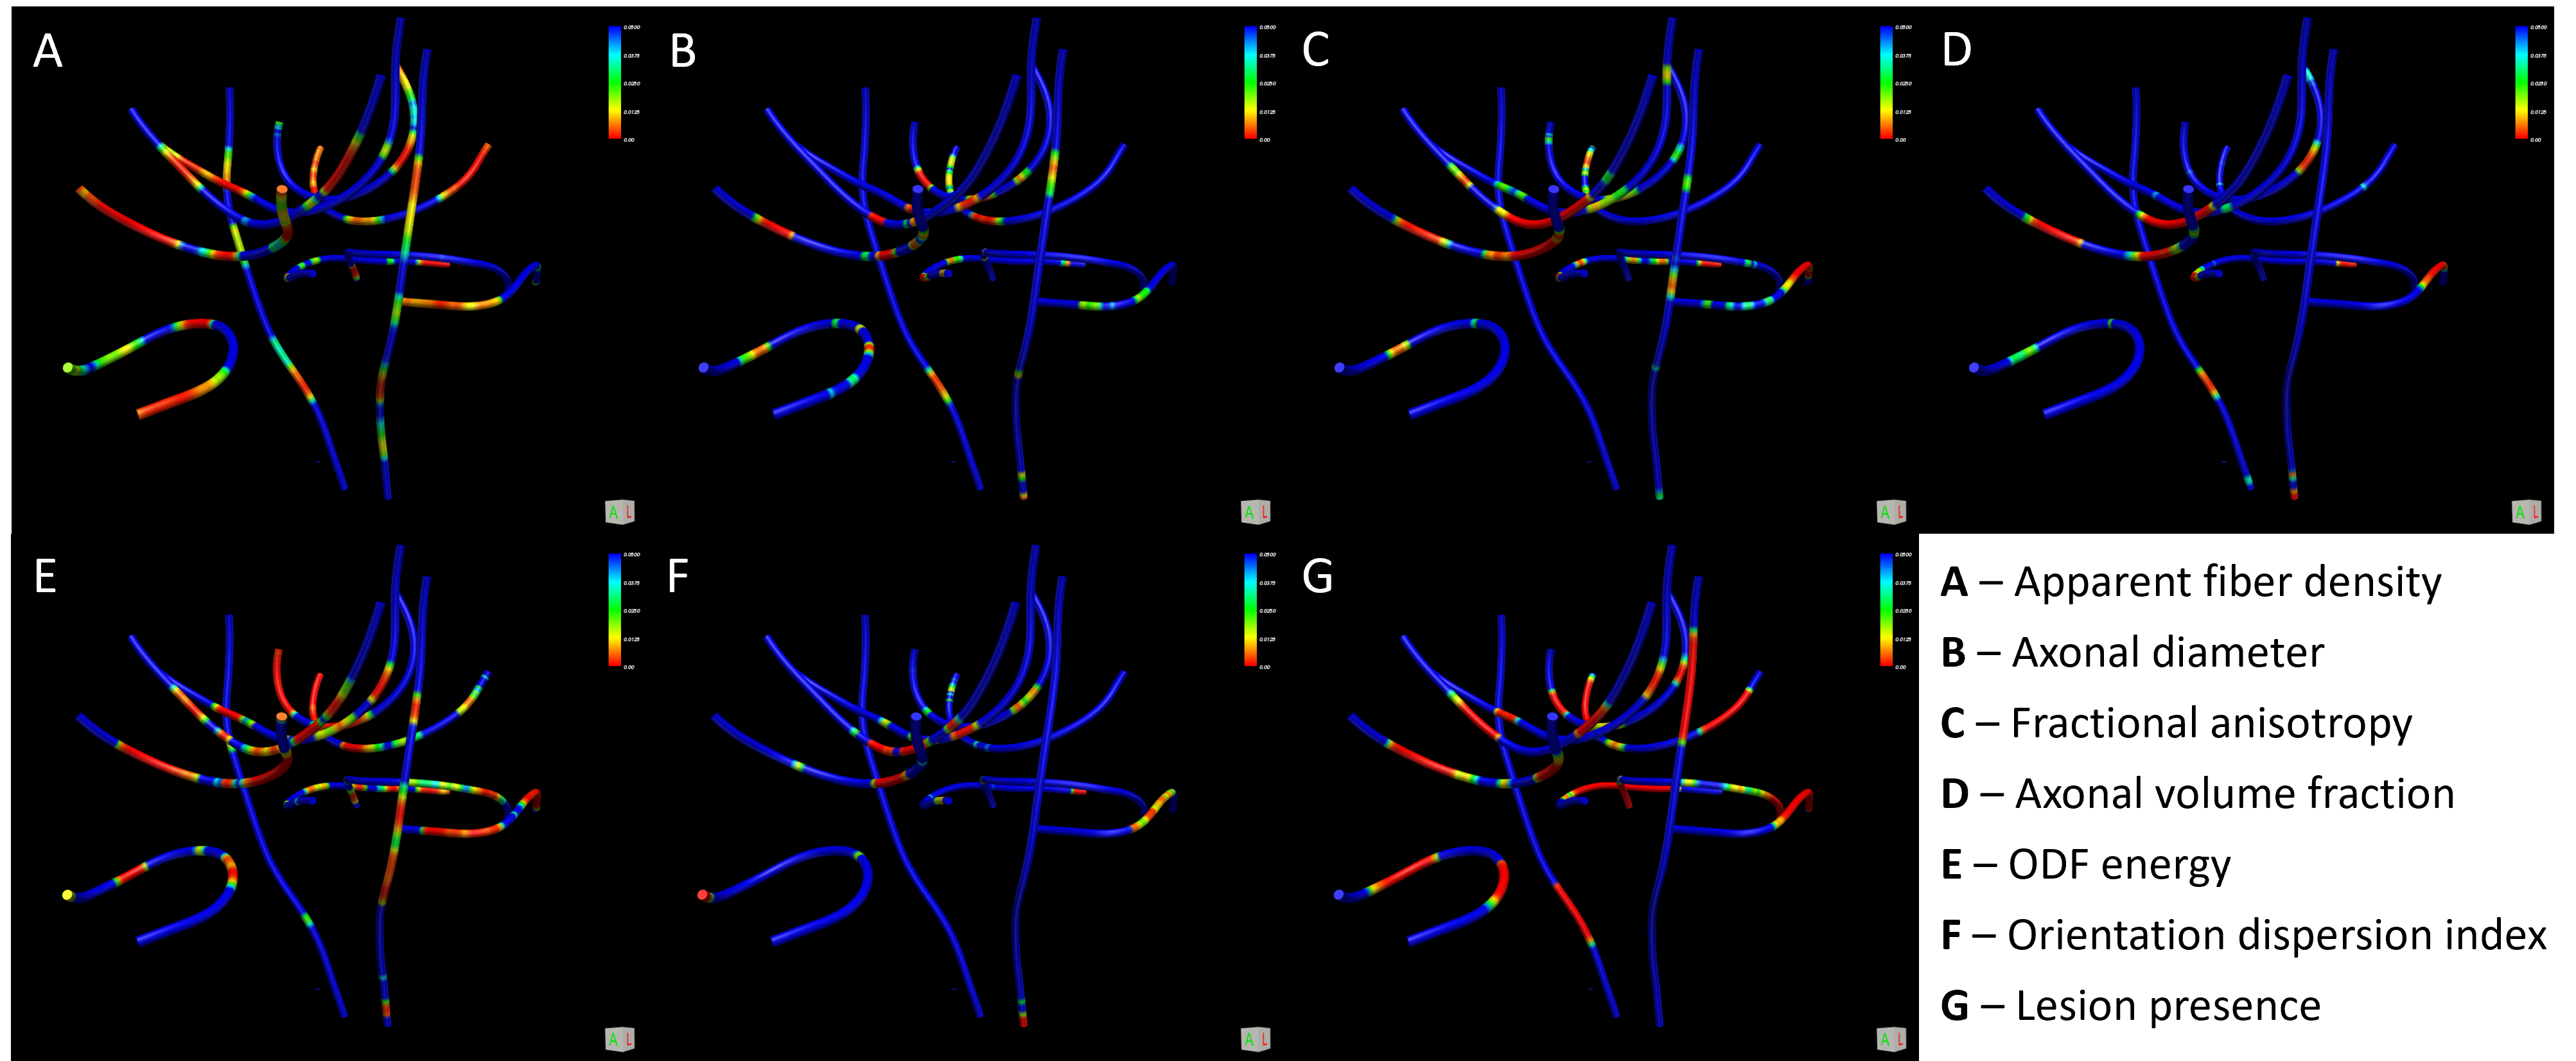
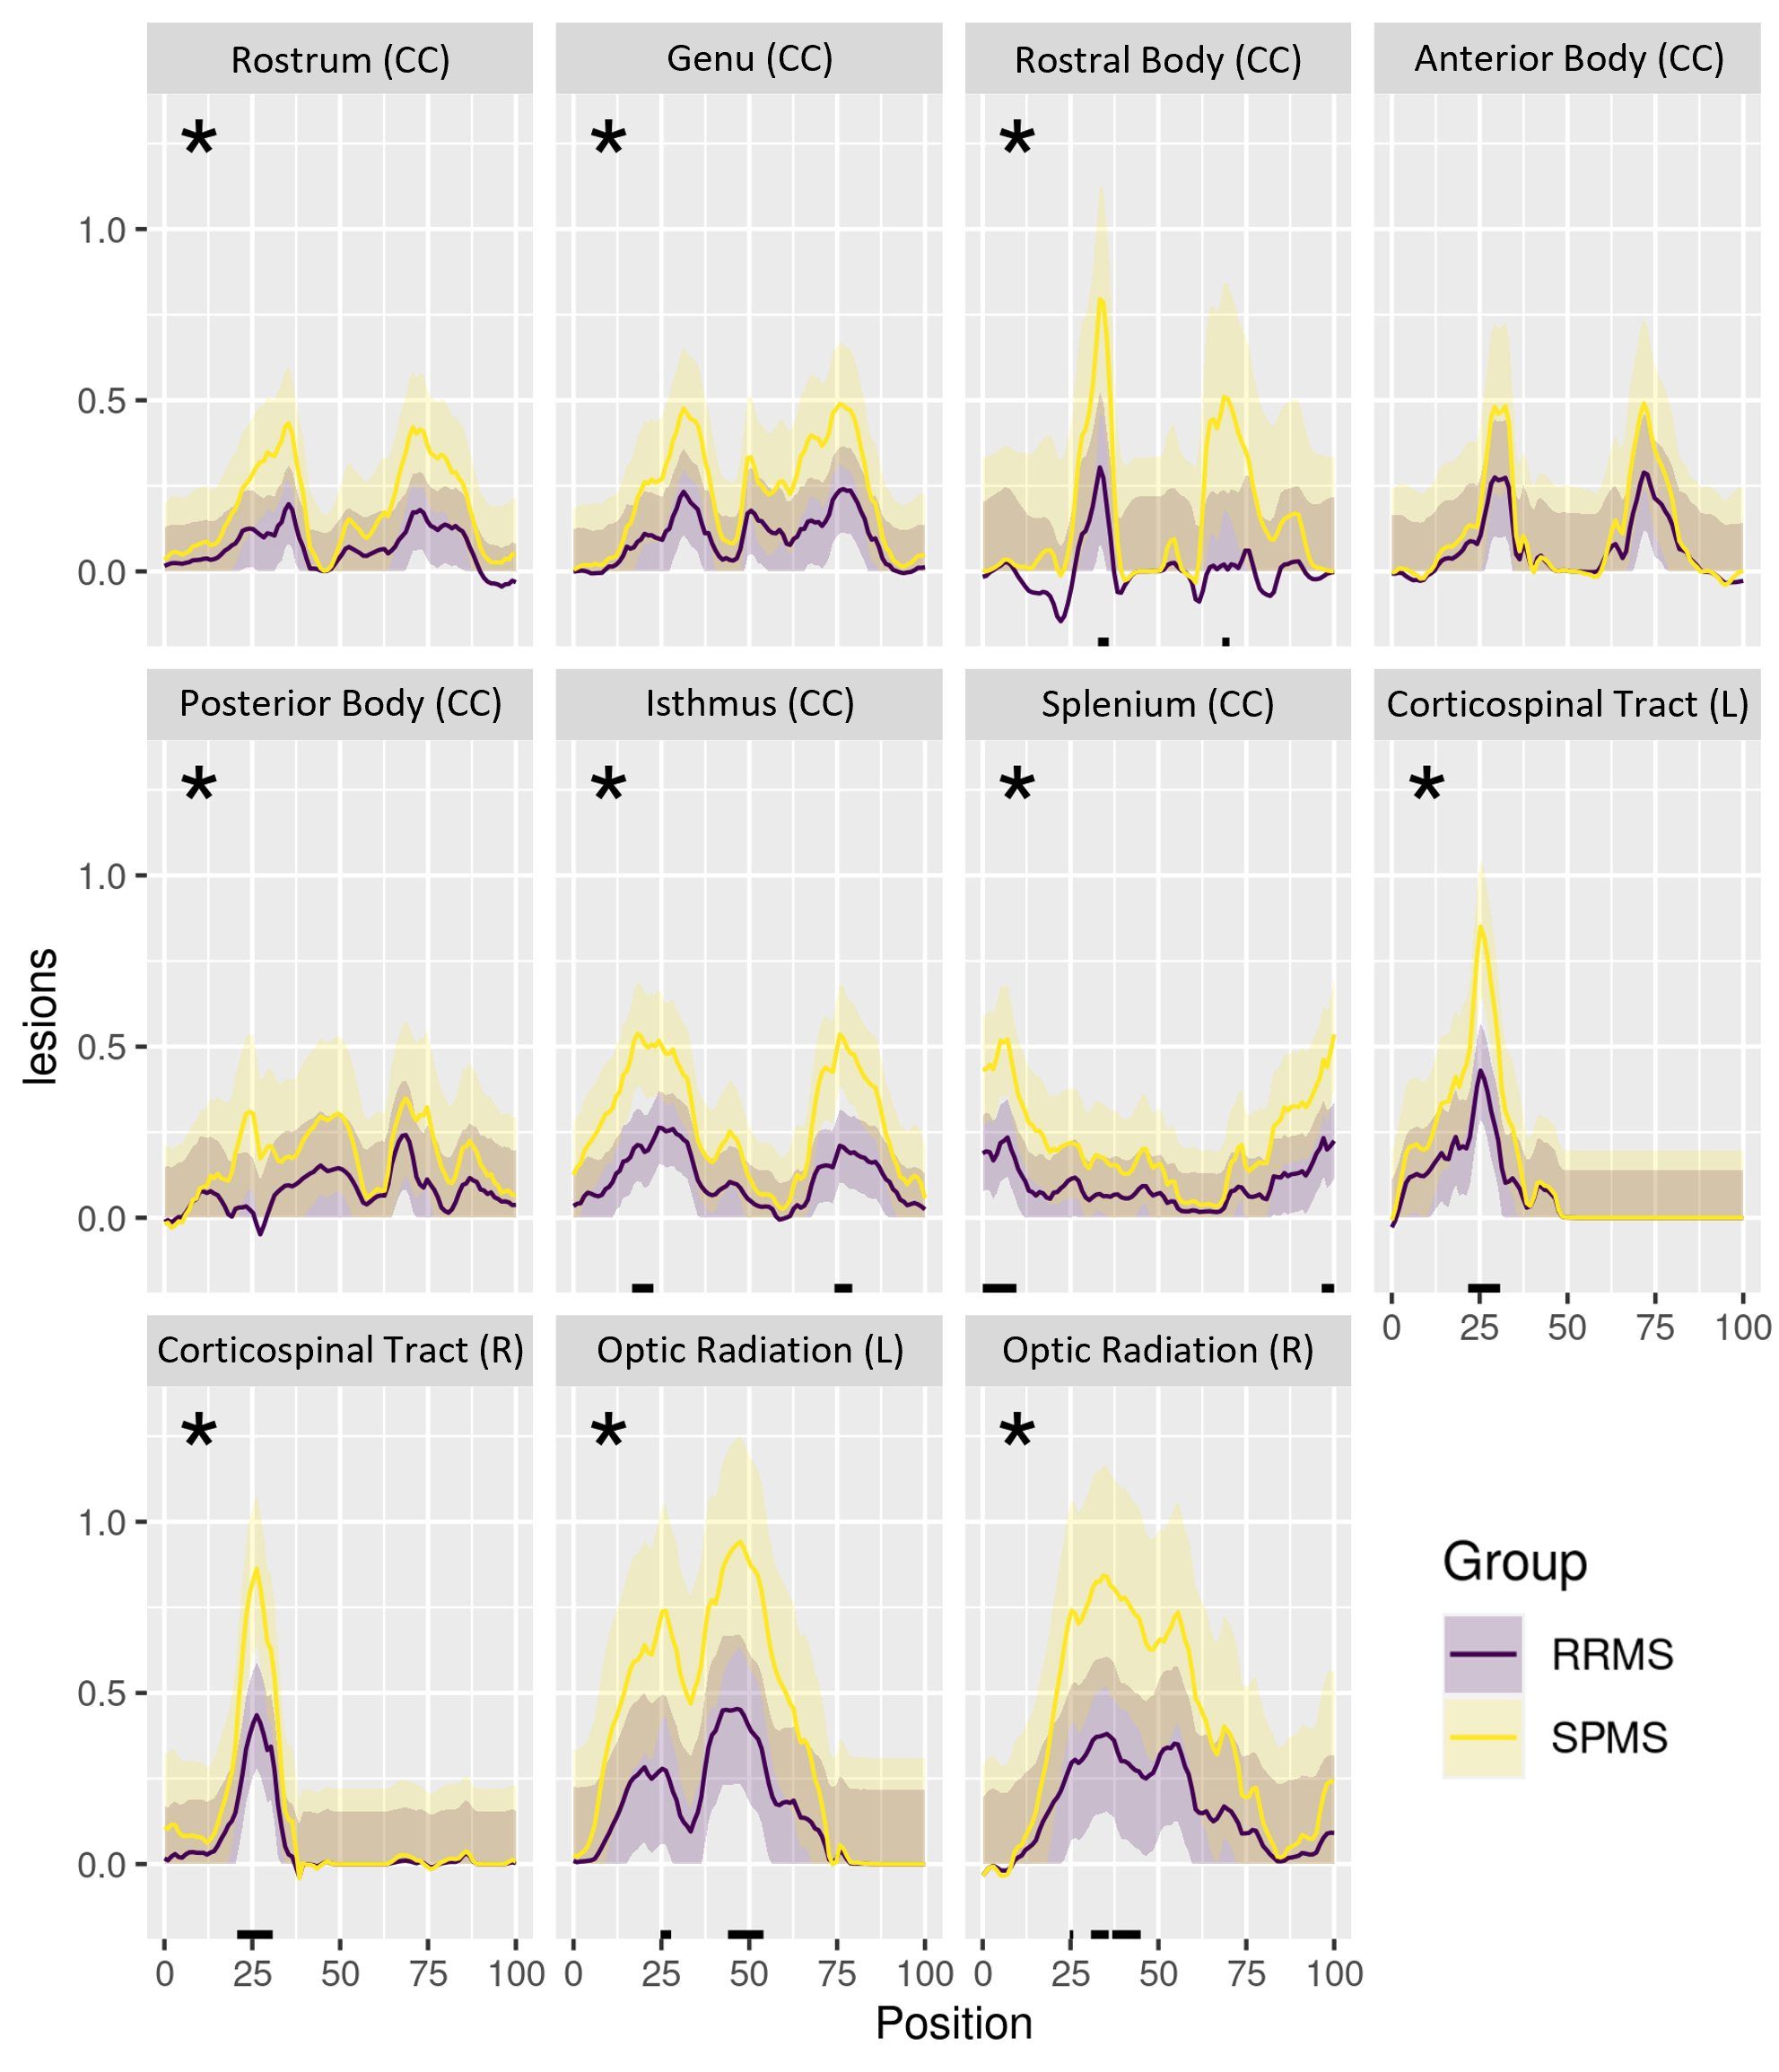
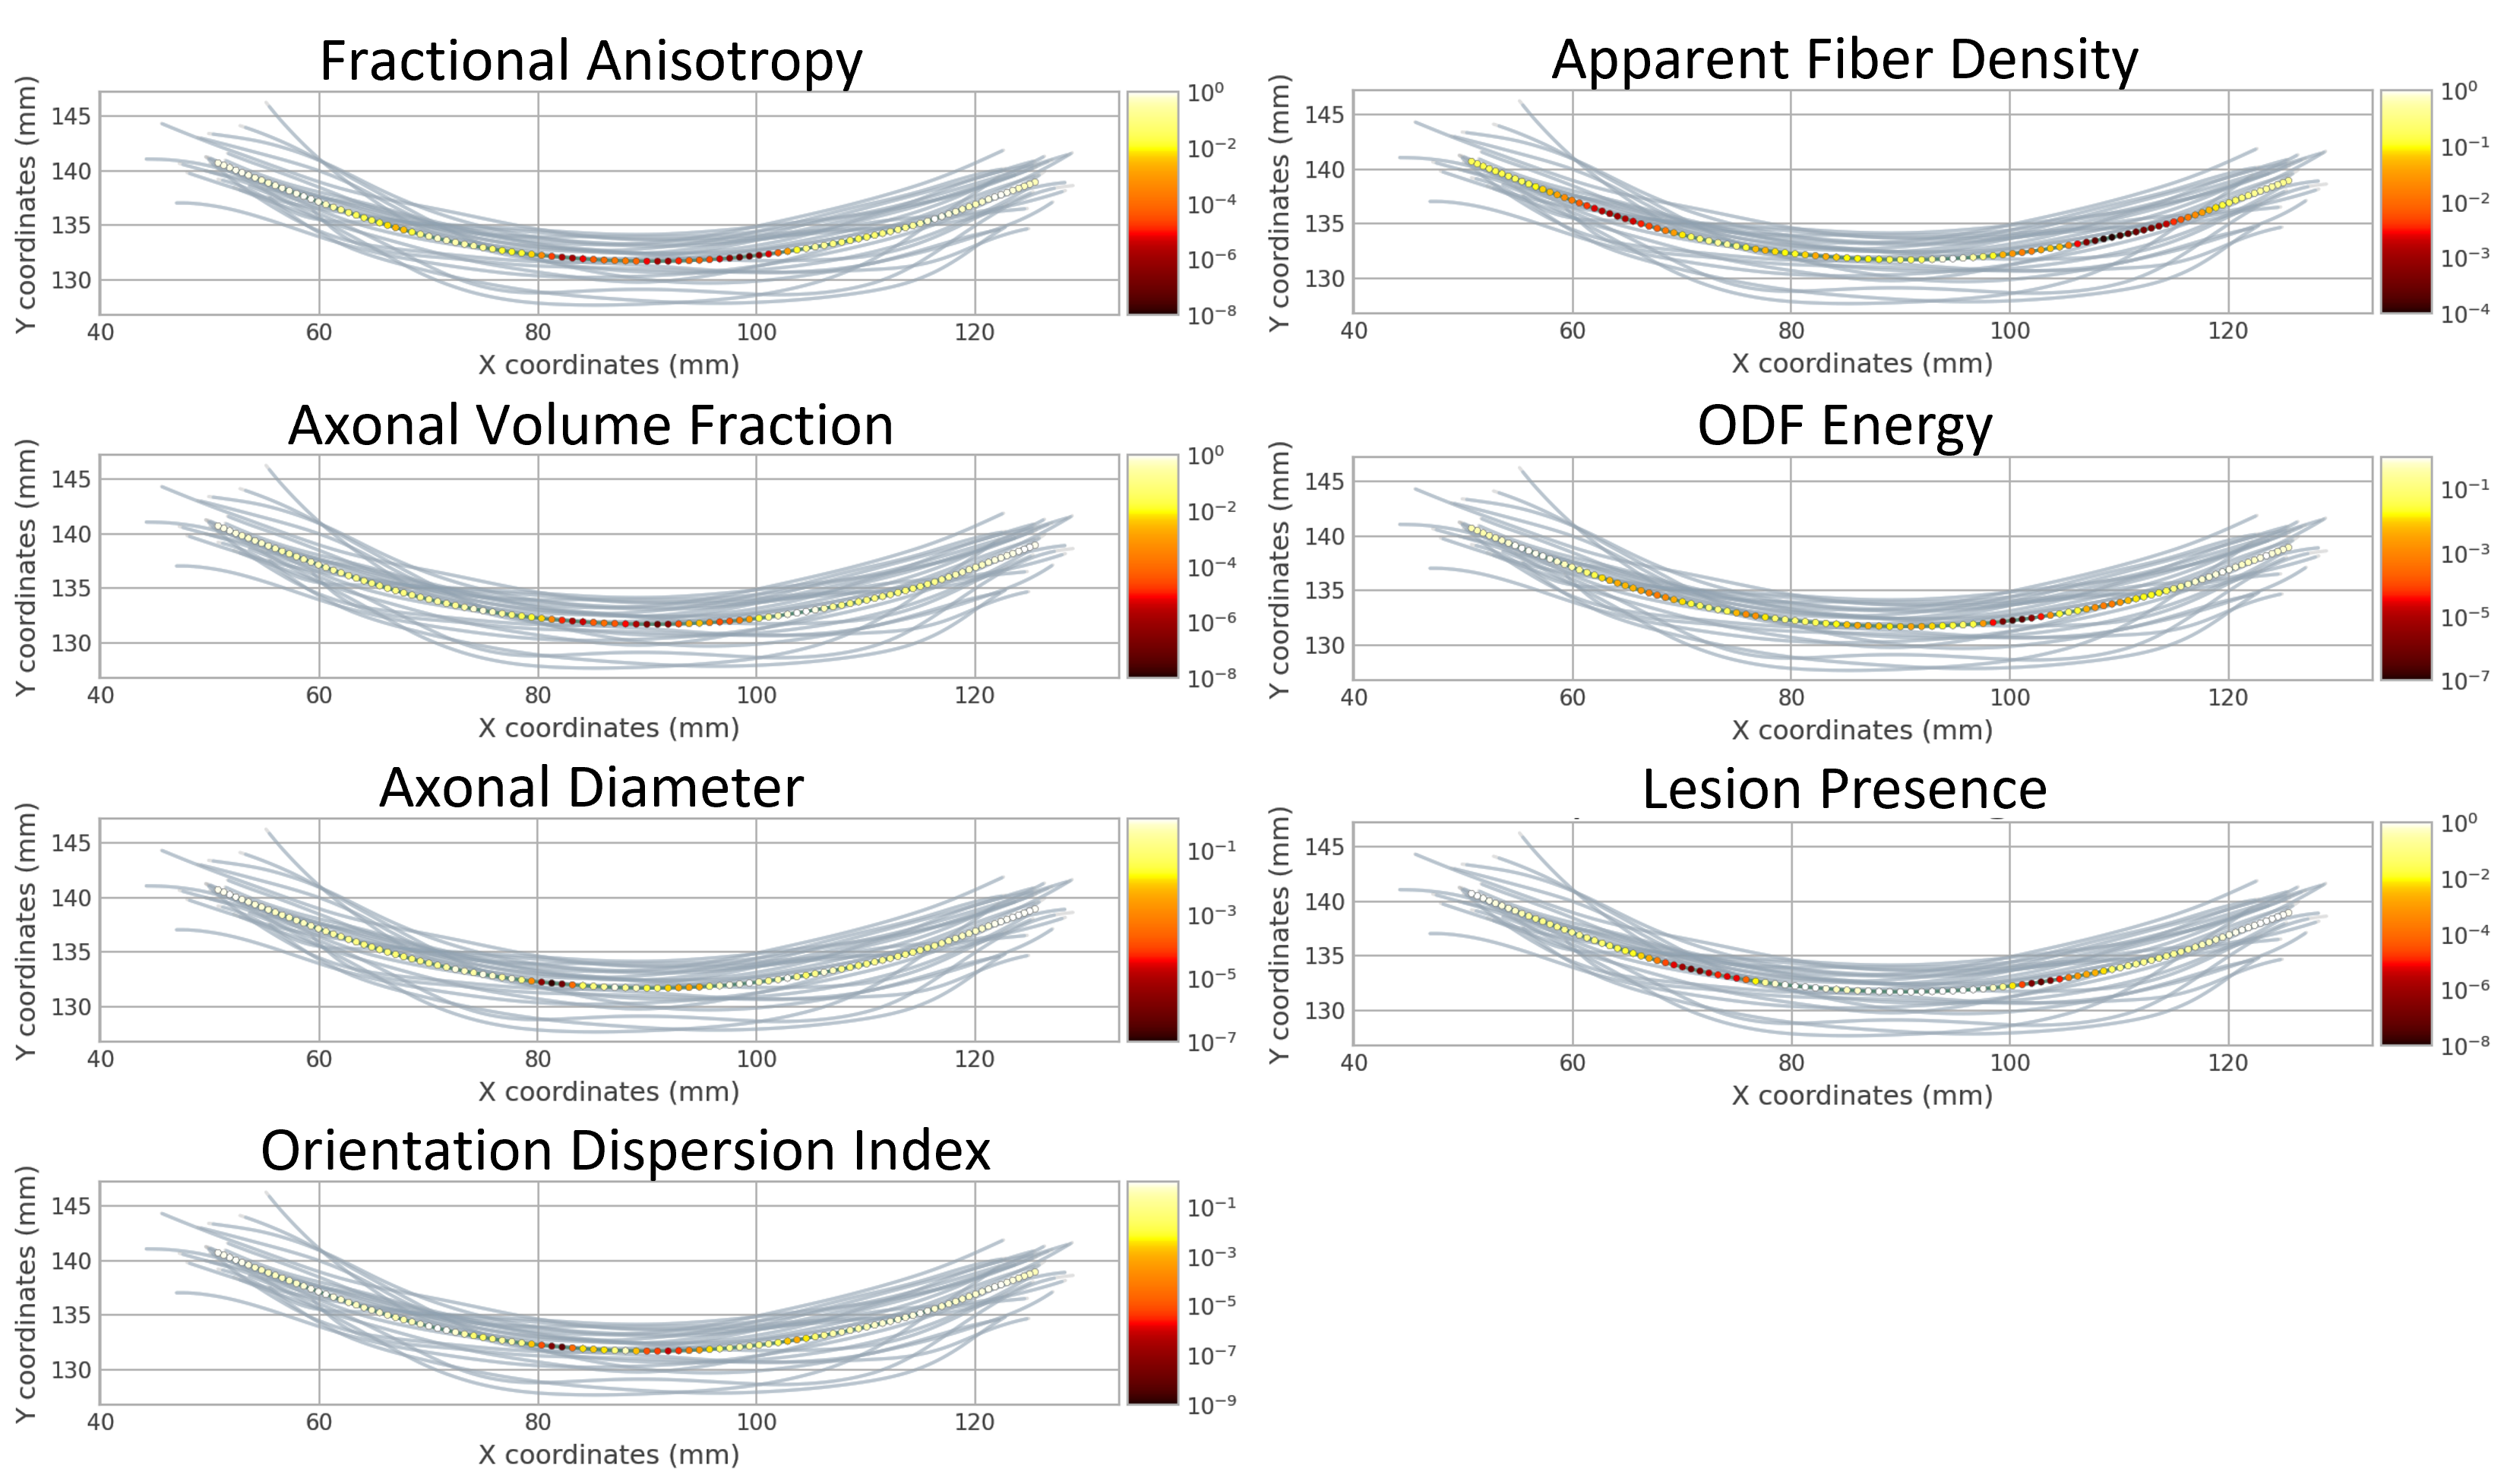
In along-tract statistics, ODF energy detected the most cohort differences across multiple tracts and tract segments (Fig3). Additionally, the presence of lesions along tracts mainly presented bilaterally (Fig4). Significant cohort differences were commonly detected in the rostral body of the corpus callosum by multiple measures where midsagittal or bilateral patterns of along-tract significance were noted (Fig5).
Discussion
Using unique diffusion and texture measures, this study detected various pathological differences between RRMS and SPMS. Both sets of measures identified significant differences in NAWM pathology, which aligned with prior findings suggesting the importance of non-lesion areas underlying the greater severity of SPMS than RRMS2,10. In tract-based ROI analysis, diffusion measures differentiated cohorts in multiple tracts, notably the lesion and NAWM differences in the corpus callosum body. Along-tract statistics showed consistent findings. Bilateral patterns in the rostral body coincided with lesion presence, suggesting the sensitivity of those measures to focal demyelination. On the other hand, the midsagittal regions hold the densest fiber tracts of the corpus callosum, so cohort-wise differences may reflect sensitivity to less salient alterations in axonal integrity. Further, the rostral body contains mainly thick nerve fibers directing motor function planning11. Thus, further study of rostral body pathology may be important in understanding the substrates of increased physical disability observed in SPMS patients12, including their relationship to select fiber tracts.Conclusion
Advanced diffusion and texture analyses can pinpoint critical brain regions that differentiate RRMS and SPMS, including the motor-coordinating regions of the corpus callosum, and whole brain NAWM regions, with or without tract localization, besides lesions. This work can advance the connections made between disease development and patient disability.Acknowledgements
We thank the graduate studentship funding support of the Alberta Graduate Education Scholarship. We also thank the funding support from the MS Society of Canada, Natural Sciences and Engineering Council of Canada (NSERC), and Alberta Innovates Health Solutions.References
1. Dutta R, Trapp BD. Relapsing and progressive forms of multiple sclerosis. Curr Opin Neurol 2014; 27: 271–278.
2. Eshaghi A, Young AL, Wijeratne PA, et al. Identifying multiple sclerosis subtypes using unsupervised machine learning and MRI data. Nat Commun 2021; 12: 2078.
3. Kovesi P. Phase congruency detects corners and edges. In: Digital Image Computing: Techniques and Applications: Proceedings of the VIIth Biennial Australian Pattern Recognition Society Conference - DICTA 2003, pp. 309–18.
4. Descoteaux M, Angelino E, Fitzgibbons S, et al. Regularized, fast, and robust analytical Q-ball imaging. Magn Reson Med 2007; 58: 497–510.
5. Mirzaalian H, Ning L, Savadjiev P, et al. Multi-site harmonization of diffusion MRI data in a registration framework. Brain Imaging Behav 2018; 12: 284–295.
6. Auria A, Romascano D, Canales-Rodriguen E, et al. Accelerated microstructure imaging via convex optimisation for regions with multiple fibres (AMICOx). Proc - Int Conf Image Process ICIP 2015; 2015-Decem: 1673–1676.
7. Wasserthal J, Neher P, Maier-Hein KH. TractSeg - Fast and accurate white matter tract segmentation. Neuroimage 2018; 183: 239–253.
8. Wasserthal J, Maier-Hein KH, Neher PF, et al. Multiparametric mapping of white matter microstructure in catatonia. Neuropsychopharmacology 2020; 45: 1750–1757.
9. Colby JB, Soderberg L, Lebel C, et al. Along-tract statistics allow for enhanced tractography analysis. Neuroimage 2012; 59: 3227–3242.
10. Filippi M, Bar-Or A, Piehl F, et al. Multiple sclerosis. Nat Rev Dis Prim 2018; 4: 43.
11. Caligiuri ME, Barone S, Cherubini A, et al. The relationship between regional microstructural abnormalities of the corpus callosum and physical and cognitive disability in relapsing–remitting multiple sclerosis. NeuroImage Clin 2015; 7: 28–33.
12. Pagani E, Filippi M, Rocca MA, et al. A method for obtaining tract-specific diffusion tensor MRI measurements in the presence of disease: Application to patients with clinically isolated syndromes suggestive of multiple sclerosis. Neuroimage 2005; 26: 258–265.
Figures