3978
Feasibility of $$$R_2^*$$$ /QSM susceptibility source separation for application in multiple sclerosis1Radiology, Weill Cornell Medicine, New York, NY, United States, 2Neurology, Weill Cornell Medicine, New York, NY, United States, 3Neurology, Yale School of Medicine, New Haven, CT, United States
Synopsis
For determination of dia- and paramagnetic sources, quantitative susceptibility mapping (QSM) of phase is combined with a R2* model of magnitude of multiecho gradient echo data, which is advantageous over R2’ model that requires additional T2 mapping, Magnetic source separation was performed in in vivo (17 multiple sclerosis (MS) patients) and ex vivo (a whole brain and 3 MS brain tissue blocks). Both R2* and R2’ methods were found to be well correlated in vivo data. R2* based positive and negative susceptibility sources estimation in ex vivo MS lesions correlated with optical density of lesion histology.
Introduction
Multiple sclerosis (MS) is a debilitating autoimmune disease in the central nervous system characterized by the presence of demyelinated lesions. Progression of demyelination can be monitored using noninvasive MRI methods such as myelin water fraction mapping(1-4), and ongoing inflammation can be detected by the presence of increased iron around the rims of MS lesions(5-8). It is valuable to separate and quantify myelin and iron effects in MRI to allow specific in vivo monitoring of MS pathophysiology. Both myelin and iron can be quantified in MRI based on their non-zero magnetic susceptibility with respect to water. QSM measures the total susceptibility. Further processing is needed to separate the susceptibilities of diamagnetic myelin and paramagnetic iron when they are present within the same voxel. Additional biophysical modeling of gradient echo magnitude decay(9-13) and additional measurements of $$$R_2$$$ have been proposed for separating the contributions of negative and positive susceptibility sources, such as $$$\chi$$$–separation(13) and DECOMPOSE(14). Both types of magnetic sources increase $$$R_2^′=R_2^*-R_2$$$ (13, 15) but cancel each other out on QSM. Therefore, the joint measurement of QSM and allows their separation. However, this approach requires two acquisitions: gradient echo and mapping. In this work, we explore the feasibility of magnetic source separation based on gradient echo data alone.Methods
In this work, the effects of magnetic susceptibility on a complex MRI signal are modeled following the $$$\chi$$$–separation method(9, 13),$$R_2^′(r)+i2\pi\delta f(r) = r^+ |\chi^+ (r)|+r^- |\chi^- (r)| + i\gamma\cdot d * (\chi^+ (r)+ \chi^- (r))$$
Here $$$\chi^+ (r)$$$ and $$$\chi^- (r)$$$ are sought volumetric susceptibilities of positive and negative sources, $$$r^+$$$ and $$$r^-$$$ are their corresponding relaxometric constants, $$$d$$$ - dipole kernel. Considering that both $$$R^′_2$$$ and $$$R_2$$$ are affected in the presence of susceptibility sources, we propose a first-order approximation:
$$R_2^*(r)\approx\alpha R_2^′(r)$$
Eqs. 1 and 2 can be formulated as a minimization problem similar to the $$$\chi$$$–separation(13) and solved solved iteratively using Gauss-Newton iterations. The calibration parameter $$$\alpha$$$ was estimated through the linear fit with zero-intercept of $$$R_2^*(r)\approx\alpha R_2^′(r)$$$ within a set of ROIs when both and maps were available. Values of $$$\chi^+ (r)$$$ and $$$\chi^- (r)$$$ were assumed to be equal to 137 Hz/ppm(13).
In vivo data I
5 MS patients were scanned on a 3T clinical MR scanner (Siemens Healthineers, Erlangen, Germany). A 3D multi-echo gradient echo (GRE) sequence was acquired with the following parameters: voxel size = 0.75×0.75×3 mm3, TE1 = 6.3 msec, ΔTE = 4.1ms, TR = 48ms, FA = 15°, readout bandwidth (rBW) = 260 Hz/pixel. FAST-T2(1, 16) parameters: TR/TE = 7.5/0.5ms, TR = 2000 ms, T2prep echo times = 0, 7.5, 17.5, 67.5, 147.5, and 307.5ms, FA = 10°, spiral leaves per stack = 32, voxel size = 0.9x0.9x5mm3.
Ex vivo data
Additional data was obtained in 3 formalin-fixed coronal brain slabs (Rocky Mountain Multiple Sclerosis Center Tissue Bank) scanned on a 3T clinical scanner (Siemens Healthineers, Erlangen, Germany) using the 64-channel head coiland GRE sequence (voxel size=0.5×0.5×0.5 mm3, TE1=3.7ms, ΔTE=6.6ms, TR=42 ms, FA=20o, rBW=163 Hz/pixel).
In vivo data II
We investigated early change and 1st-y myelin recovery in 44 new Gadolinium-enhancing lesions in 12 MS patients (mean age/disease-duration 40y/7.6y). Follow-up was performed 1y later. Acquisition was identical to In vivo data I. (myelin susceptibility) and MWF from FAST-T2 data were computed. Linear mixed effects model with a random effect for patient and with adjustment for lesion volume was used to study association between $$$\chi^-$$$ and MWF.
Results
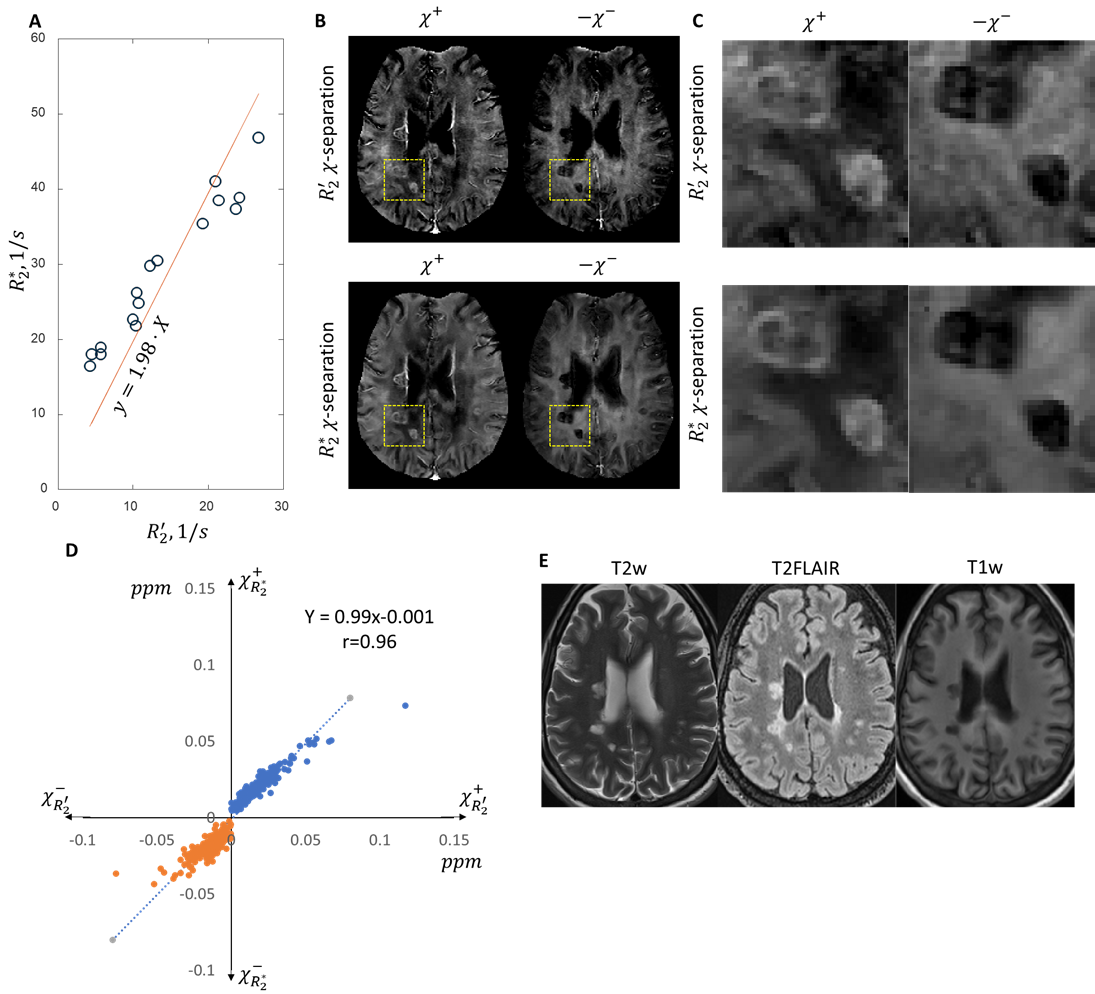
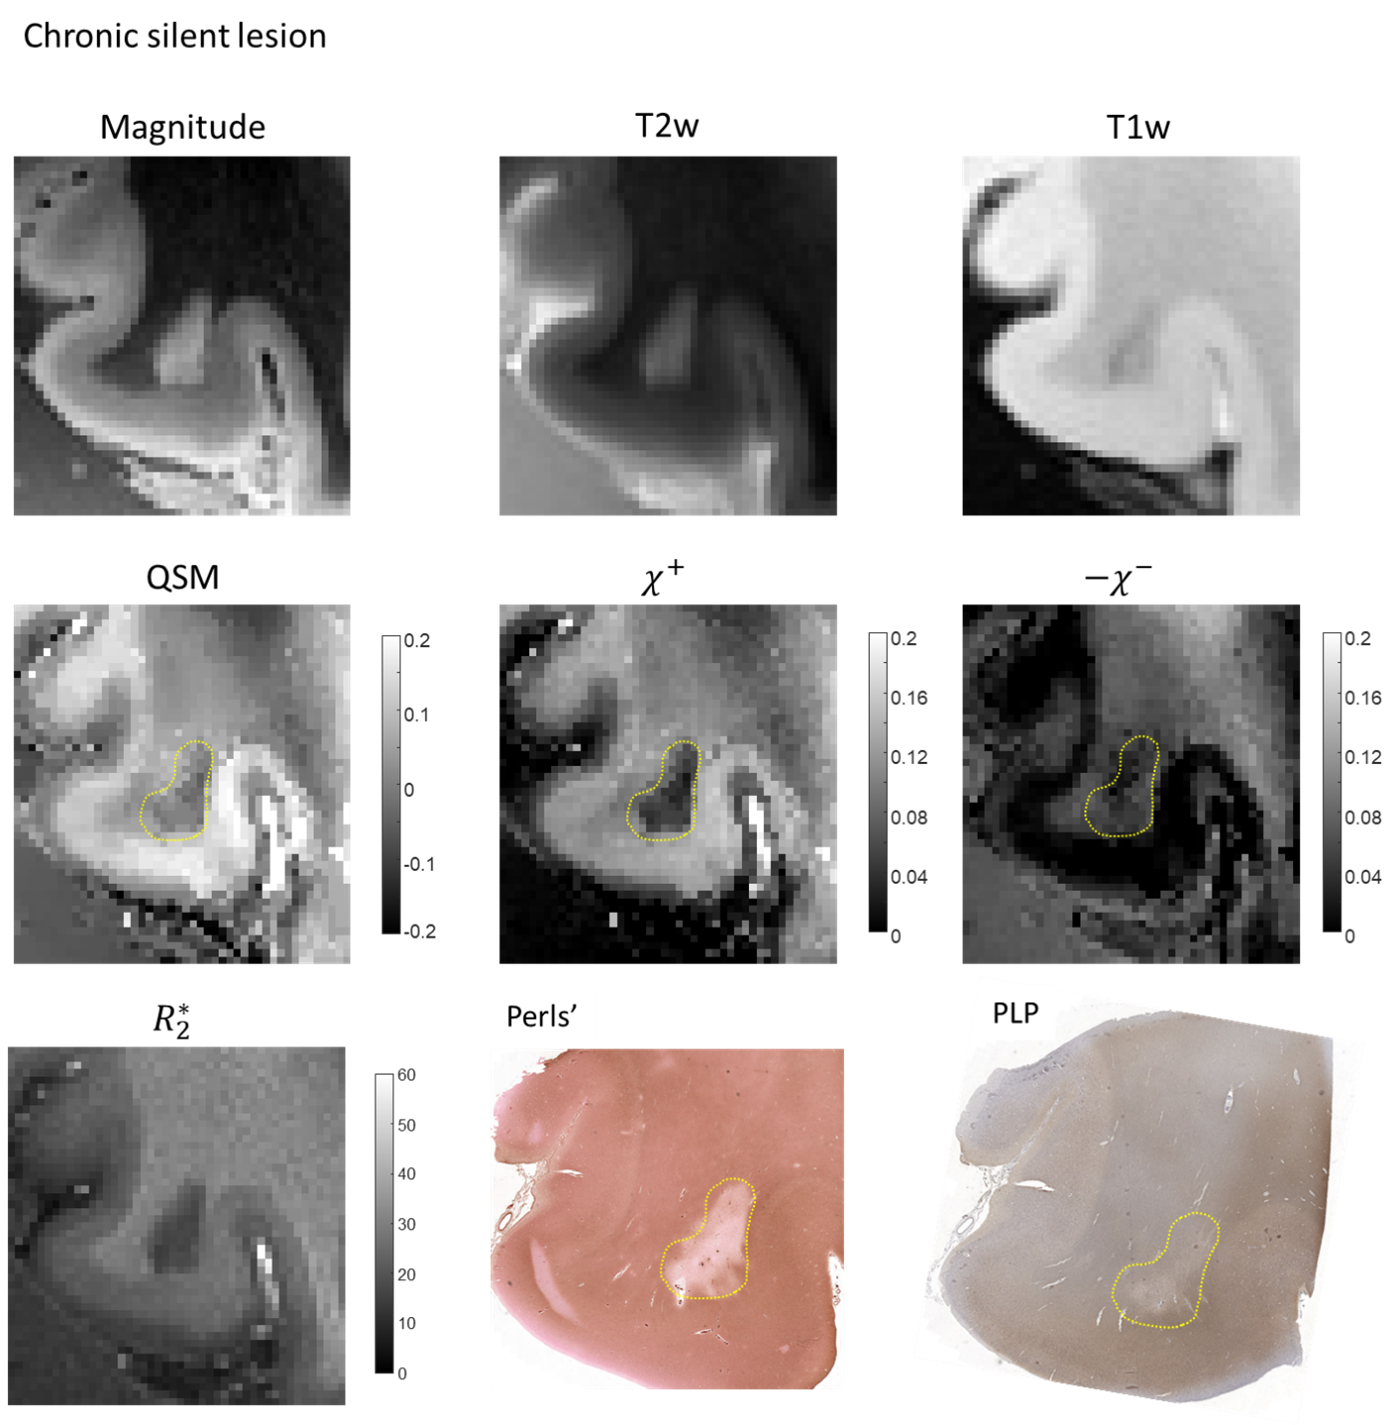
Figure 1A shows calibration results achieved in a single MS patient. The linear regression resulted in $$$\alpha=1.98$$$ ($$$r^2=0.94, p<0.05$$$). Figures 1B and 1C show representative results of magnetic source separations performed by two methods. $$$R_2^*$$$ and the $$$R_2^′(r)$$$ based separation methods demonstrated good agreement,A chronic silent lesion (Figure 2, circled in yellow dashed line) appearing uniformly hypointense on QSM was characterized by strong depletion of iron according to the Perls’ staining and a minor decrease of myelin proteolipid protein. Estimated distributions of $$$\chi^+ (r)$$$ and $$$\chi^- (r)$$$ had similar appearance, indicating greater depletion of paramagnetic sources compared to diamagnetic.
For the chronic active lesion (Figure 3), the lesion core demonstrated minor hyperintensity compared to NAWM and a pronounced paramagnetic rim on QSM, while tissue staining showed evidence of almost uniform depletion of myelin, and heterogeneous distribution of iron. These findings were found to be in good correspondence with distribution of magnetic sources.
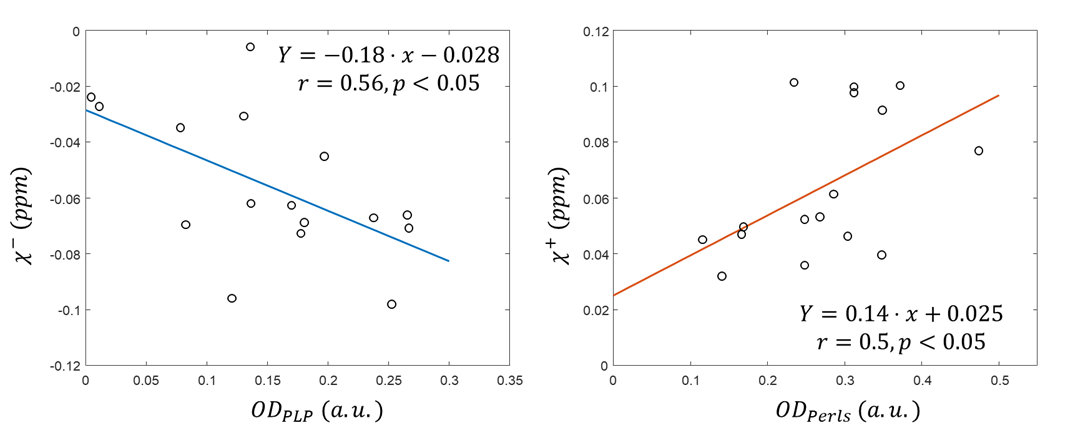
Linear regression analysis between estimation of the optical density of the PLP/Perl’s histology and mean susceptibility of the corresponding sources within the ROIs of lesion and NAWM demonstrated a statistically significant correlation (PLP/$$$\chi^- $$$: correlation coefficient r=0.56 , p<0.05, Perls’/$$$\chi^+ $$$: r=0.5, p<0.05) (Figure 4).
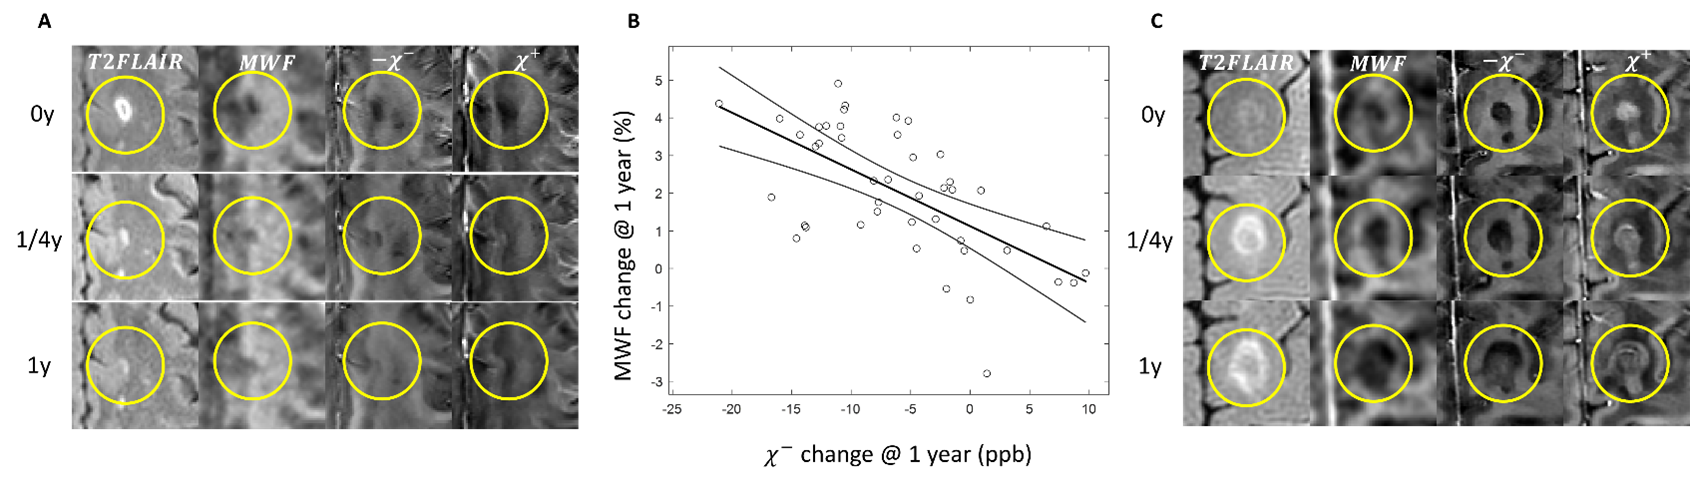
We found a significant positive association between the $$$\chi^- (r)$$$ increase @1y relative to 0y and the MWF increase @1y relative to 0y (β=-0.144, 95% CI: [-0.199, -0.1], p=0.0008, Figure 5). Our study indicates that change may serve as a biomarker for myelin recovery/damage in acute MS lesions.
Conclusion
This study shows the feasibility of using magnetic source separation based solely on GRE complex data to characterize MS lesion composition. The ability to use GRE data alone simplifies acquisition protocols and allows retrospective analysis of already existing data.Acknowledgements
No acknowledgement found.References
1. Nguyen TD, Spincemaille P, Gauthier SA, Wang Y. Rapid whole brain myelin water content mapping without an external water standard at 1.5T. Magn Reson Imaging. 2017;39:82-8.
2. MacKay A, Whittall K, Adler J, Li D, Paty D, Graeb D. In vivo visualization of myelin water in brain by magnetic resonance. Magn Reson Med. 1994;31(6):673-7.
3. Rahmanzadeh R, Lu PJ, Barakovic M, Weigel M, Maggi P, Nguyen TD, et al. Myelin and axon pathology in multiple sclerosis assessed by myelin water and multi-shell diffusion imaging. Brain. 2021;144(6):1684-96.
4. Laule C, Leung E, Lis DK, Traboulsee AL, Paty DW, MacKay AL, et al. Myelin water imaging in multiple sclerosis: quantitative correlations with histopathology. Mult Scler. 2006;12(6):747-53.
5. Gillen KM, Mubarak M, Nguyen TD, Pitt D. Significance and In Vivo Detection of Iron-Laden Microglia in White Matter Multiple Sclerosis Lesions. Frontiers in immunology. 2018;9:255.
6. Dal-Bianco A, Grabner G, Kronnerwetter C, Weber M, Hoftberger R, Berger T, et al. Slow expansion of multiple sclerosis iron rim lesions: pathology and 7 T magnetic resonance imaging. Acta neuropathologica. 2017;133(1):25-42.
7. Mehta V, Pei W, Yang G, Li SY, Swamy E, Boster A, et al. Iron Is a Sensitive Biomarker for Inflammation in Multiple Sclerosis Lesions. Plos One. 2013;8(3).
8. Absinta M, Sati P, Schindler M, Leibovitch EC, Ohayon J, Wu TX, et al. Persistent 7-tesla phase rim predicts poor outcome in new multiple sclerosis patient lesions. J Clin Invest. 2016;126(7):2597-609.
9. Yablonskiy DA, Haacke EM. Theory of NMR signal behavior in magnetically inhomogeneous tissues: the static dephasing regime. Magn Reson Med. 1994;32(6):749-63.
10. Kiselev VG, Posse S. Analytical model of susceptibility-induced MR signal dephasing: effect of diffusion in a microvascular network. Magn Reson Med. 1999;41(3):499-509.
11. Kiselev VG, Strecker R, Ziyeh S, Speck O, Hennig J. Vessel size imaging in humans. Magn Reson Med. 2005;53(3):553-63.
12. Schweser F, Deistung A, Lehr B, Sommer K, Reichenbach J, editors. SEMI-TWInS: simultaneous extraction of myelin and iron using a T2*-weighted imaging sequence. Proceedings of the 19th Meeting of the International Society for Magnetic Resonance in Medicine; 2011.
13. Shin HG, Lee J, Yun YH, Yoo SH, Jang J, Oh SH, et al. chi-separation: Magnetic susceptibility source separation toward iron and myelin mapping in the brain. Neuroimage. 2021;240:118371.
14. Chen. J, Gong N-J, Liu C. Decompose QSM to diamagnetic and paramagnetic components via a complex signal mixture model of gradient-echo MRI data. ISMRM 2021 Annual Meeting, progam number 0790. 2021.
15. Stuber C, Morawski M, Schafer A, Labadie C, Wahnert M, Leuze C, et al. Myelin and iron concentration in the human brain: a quantitative study of MRI contrast. Neuroimage. 2014;93 Pt 1:95-106.
16. Nguyen TD, Deh K, Monohan E, Pandya S, Spincemaille P, Raj A, et al. Feasibility and reproducibility of whole brain myelin water mapping in 4 minutes using fastFigures