3977
Decrease in magnetic susceptibility correlates with reduction in cortical blood flow in a model of systemic inflammation: A 9.4T in-vivo study1Department of Radiology, University of Calgary, Calgary, AB, Canada, 2School of Information Technology and Electrical Engineering, University of Queensland, Brisbane, Australia
Synopsis
Brain hypoxia is present in multiple sclerosis, a condition associated with inflammation. Hypoxia may be related to inflammation. Quantitative susceptibility mapping (QSM) is sensitive to deoxyhemoglobin and so hypoxia. Here, we combined perfusion MRI with QSM to assess hypoxia and cerebral blood flow (CBF) in the lipopolysaccharide (LPS) inflammatory model. We report a reduction in susceptibility, as well as a significant reduction in CBF, in the cortex of the LPS model. As reduced tissue susceptibility was observed in more hypoxic subjects, this could be consistent with hypoxia in the inflammatory model, and QSM might be a possible biomarker.
Introduction
Systemic inflammation is often accompanied by the presence of hypoxia (low oxygenation). This link has been observed in inflammatory central nervous system conditions, such as multiple sclerosis (MS). We have shown that hypoxia is present in the cortex of experimental autoimmune encephalomyelitis, an inflammatory disease model of MS, and in people with MS1, 2. We proposed that hypoxia and inflammation are linked in a cycle, where inflammation can stimulate hypoxia, and hypoxia can further exacerbate inflammation3. The underlying pathology of hypoxia is not well understood – not only in MS, but likely in other inflammatory conditions as well. One mechanism for the development of hypoxia following inflammation may relate to reducing vasoreactivity of blood vessels, which could lead to reductions in cerebral blood flow (CBF). We applied quantitative susceptibility mapping (QSM) as a marker of hypoxia as it is sensitive to increased deoxyhemoglobin4. We used arterial spin labeling for CBF and studied a mouse model of neuroinflammation-- the bacterial lipopolysaccharide (LPS). This model has very little, if any, demyelination. A previous QSM study found that hypoxia in the rat brain induced a decrease in susceptibility (ppm) in the neocortex5. A change in QSM (ppm) could support the presence of hypoxia. If observed in inflammation, it would also support the use of QSM to detect neuroinflammation –important because of the reduction in the use of Gd-enhanced MRI for inflammation and the need for new inflammatory biomarkers in MRI.Methods
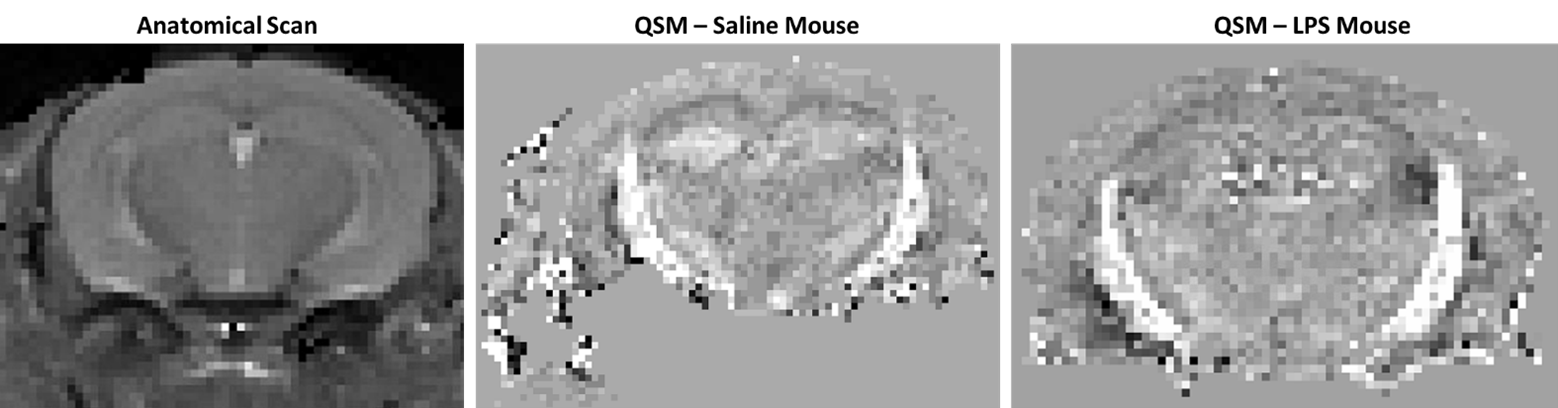
C57BL/6 female mice received saline (n=7) or 2 mg/kg LPS (n=10) via intraperitoneal injection once a day for three days. Sickness was assessed at baseline and once-daily two hours post-treatment using the open-field (OF)6. Three hours after the final injection (Day 3), we performed 9.4T MRI (Bruker) using a volume coil cryoprobe. A continuous arterial spin labeling sequence (cASL) was used to quantify cerebral blood flow (TR = 3000ms, TE = 2.7ms, TEeff = 13.5 ms, averages: 16, RARE factor = 36, matrix = 128x128, FOV = 25.6x25.6 mm). T1 map was obtained using RAREVTR (TR=100, 500, 1000, 3000, 7500 ms, TE=10 ms). QSM maps were generated using a 3D multi-gradient echo (MGE) sequence (TR = 100ms, TEeff = 3.1 7.1 11.1 15.1 19.1, echo spacing = 4 ms, matrix = 128x106x62 mm, FOV = 19.2x15.9x9.3 mm). ITK-SNAP software was used for binary brain mask extraction. FSL PRELUDE unwrapping was executed on images acquired at five echo times and was followed by intermittent corrections at each interval between echoes; corrections consisted of 2π jumps. Magnitude weighted least square fitting was implemented to generate a total field map by way of its application to the collected unwrapped phase maps. The RESHARP ("Regularization Enabled Harmonic Artefact Reduction for Phase data") method facilitated the removal of the background field by use of a 300µm-sized spherical kernel in conjunction with the 5x10⁻⁴ Tikhonov regularization parameter7. Susceptibility maps were acquired using the iLSQR method from the STI suite8. ImageJ was used to draw a region of interest around the cortex for voxel-based analysis of susceptibility (ppm).Results
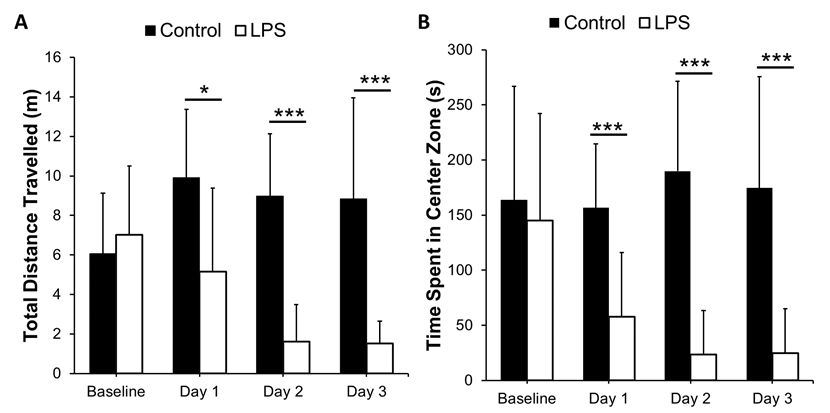
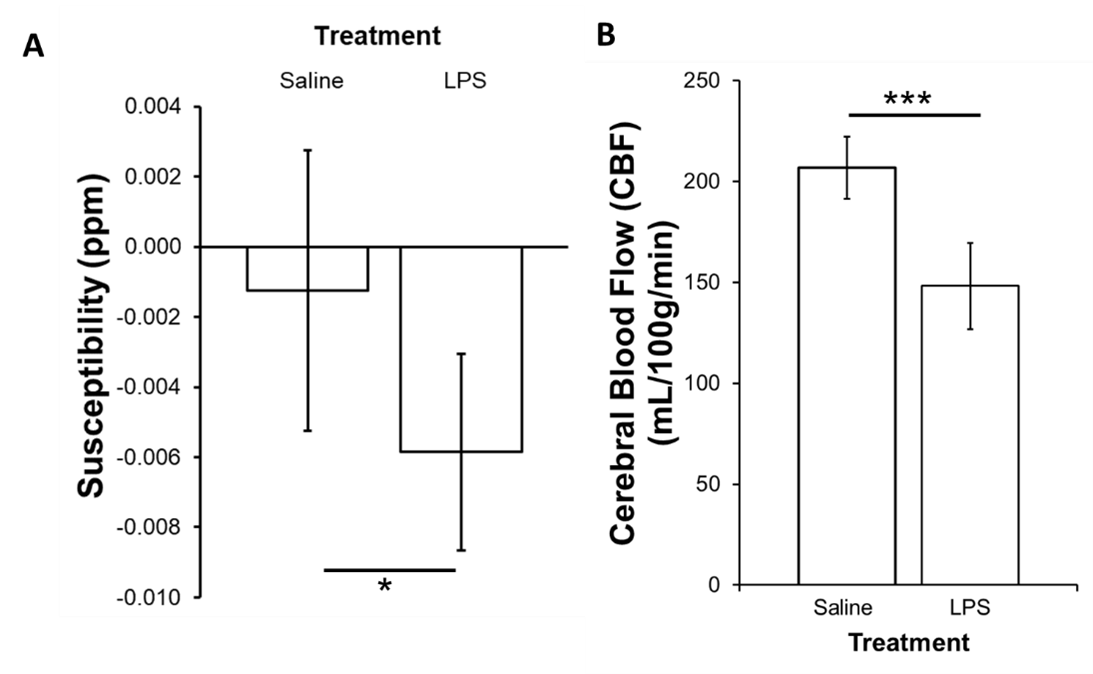
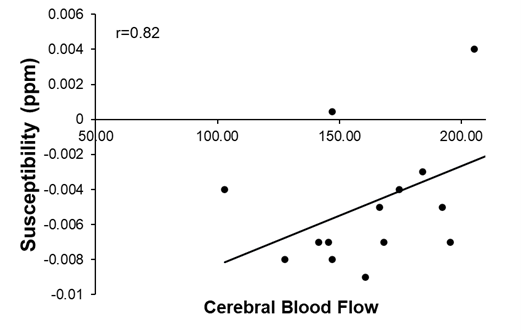
There were significant reductions in locomotion on Day 1 (p<0.05), 2 (p<0.001), and 3 (p<0.001) post-LPS as compared to controls, with no differences at baseline (Figure 2A). There was also a significant reduction in time spent in the center zone on Days 1, 2 and 3 post-LPS (p<0.001) as compared to controls, with no differences at baseline (Figure 2B). The susceptibility of the cortical gray matter was significantly lower (-0.0060±003 ppm vs. -0.002±0.004 ppm, for LPS and controls respectively, p<0.05) (Figure 3A). This was associated with a significant reduction in cortical CBF (148±21 mL/100g/min vs. 207±15 mL/100g/min, in LPS vs controls respectively, p<0.001) (Figure 3B). Susceptibility was positively correlated with CBF in the cortex (p<0.001, r = 0.82) (Figure 4).Discussion
We showed a reduction in locomotion and time spent in the center zone in the LPS group, which is consistent with infection-related sickness behaviors6. We report a significant reduction in cortical CBF alongside a decrease in QSM susceptibility following systemic inflammation. QSM is increasingly being used to assess changes in neurological conditions. In particular, susceptibility measured by QSM has been used to study plaques and myelin loss in multiple sclerosis9. Many neurological conditions are associated with demyelination, inflammation and/or reduced CBF. We have argued that inflammation is also associated with hypoxia and so increased deoxyhemoglobin3. These data, showing reduced susceptibility in normal-appearing gray matter, are consistent with a report in rats where tissue showed reduced ppm when deoxyhemoglobin in the blood increased5. A reduction in CBF correlates with this change, which indicates that vascular coupling is abnormal since hypoxia normally stimulates CBF. This observation also supports the use of QSM for detection of inflammation. This latter use is timely as there is a move to reduce Gd-enhanced MRI as a marker of inflammation in the brain.Conclusion
Diffuse inflammation in the brain is associated with decreased susceptibility in the cortex measured by QSM. These data support the hypothesis that neuroinflammation causes hypoxia in that such a reduction was also observed in rats. These data also support the use of QSM for the detection of inflammation in normal-appearing gray matter.Acknowledgements
This work was funded by Natural Sciences and Engineering Research Council (RGPIN-2015-06517), Canadian Foundation for Innovation, and Brain Canada. QS received undergraduate funding from Alberta MS Network, UCalgary Biomedical Engineering, and Alberta Innovates Health Solutions. HS acknowledges support from the Australian Research Council (DE210101297).References
1. Johnson TW, Wu Y, Nathoo N, Rogers JA, Wee Yong V and Dunn JF. Gray Matter Hypoxia in the Brain of the Experimental Autoimmune Encephalomyelitis Model of Multiple Sclerosis. PLOS ONE. 2016; 11: e0167196.
2. Yang R and Dunn JF. Reduced cortical microvascular oxygenation in multiple sclerosis: a blinded, case-controlled study using a novel quantitative near-infrared spectroscopy method. Scientific Reports. 2015; 5: 16477.
3. Yang R and Dunn JF. Multiple sclerosis disease progression: Contributions from a hypoxia-inflammation cycle. Mult Scler. 2019; 25: 1715-8.
4. Xu B, Liu T, Spincemaille P, Prince M and Wang Y. Flow compensated quantitative susceptibility mapping for venous oxygenation imaging. Magnetic resonance in medicine. 2014; 72: 438-45.
5. Hsieh MC, Kuo LW, Huang YA and Chen JH. Investigating hyperoxic effects in the rat brain using quantitative susceptibility mapping based on MRI phase. Magnetic resonance in medicine. 2017; 77: 592-602.
6. Mansour HA, Hassan WA and Georgy GS. Neuroinflammatory reactions in sickness behavior induced by bacterial infection: Protective effect of minocycline. Journal of biochemical and molecular toxicology. 2018; 32.
7. Sun H and Wilman AH. Background field removal using spherical mean value filtering and Tikhonov regularization. Magnetic resonance in medicine. 2014; 71: 1151-7.
8. Li W, Wang N, Yu F, et al. A method for estimating and removing streaking artifacts in quantitative susceptibility mapping. NeuroImage. 2015; 108: 111-22.
9. Kaunzner UW, Kang Y, Zhang S, et al. Quantitative susceptibility mapping identifies inflammation in a subset of chronic multiple sclerosis lesions. Brain : a journal of neurology. 2019; 142: 133-45.
Figures